
In my last post on 16th July I was looking at a significant high that may be forming here on equities. There was some unfinished business that I was looking to finish on the upside and one of those was a high retest on DIA which we saw yesterday and there is now a daily RSI 14 sell signal brewing on DIA to go with the daily sell signals already fixed on SPX, QQQ and IWM.
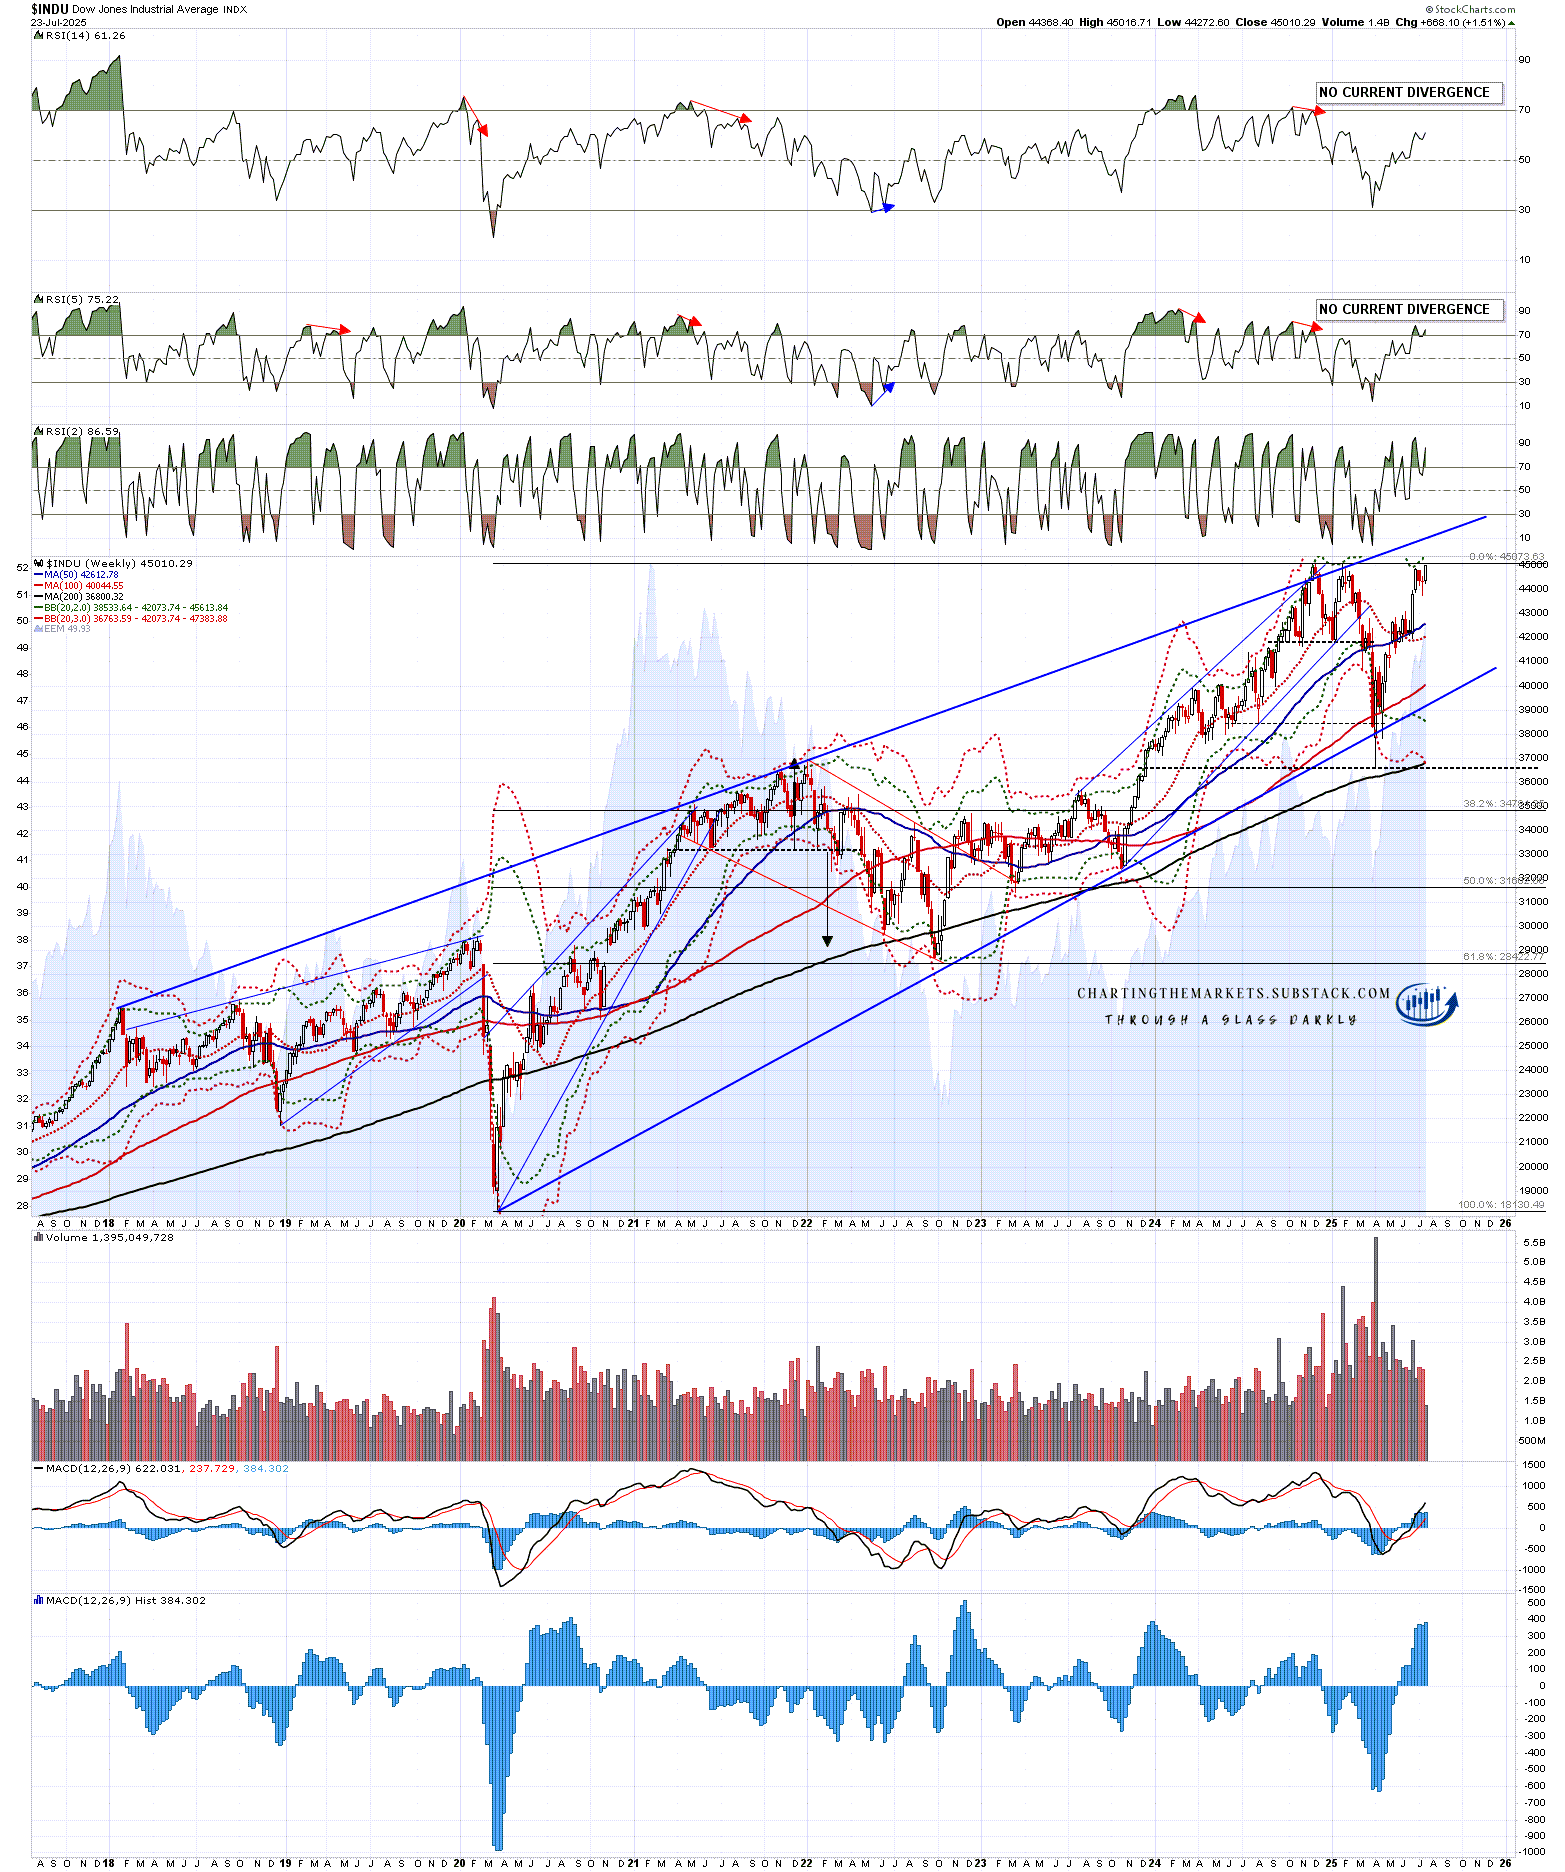
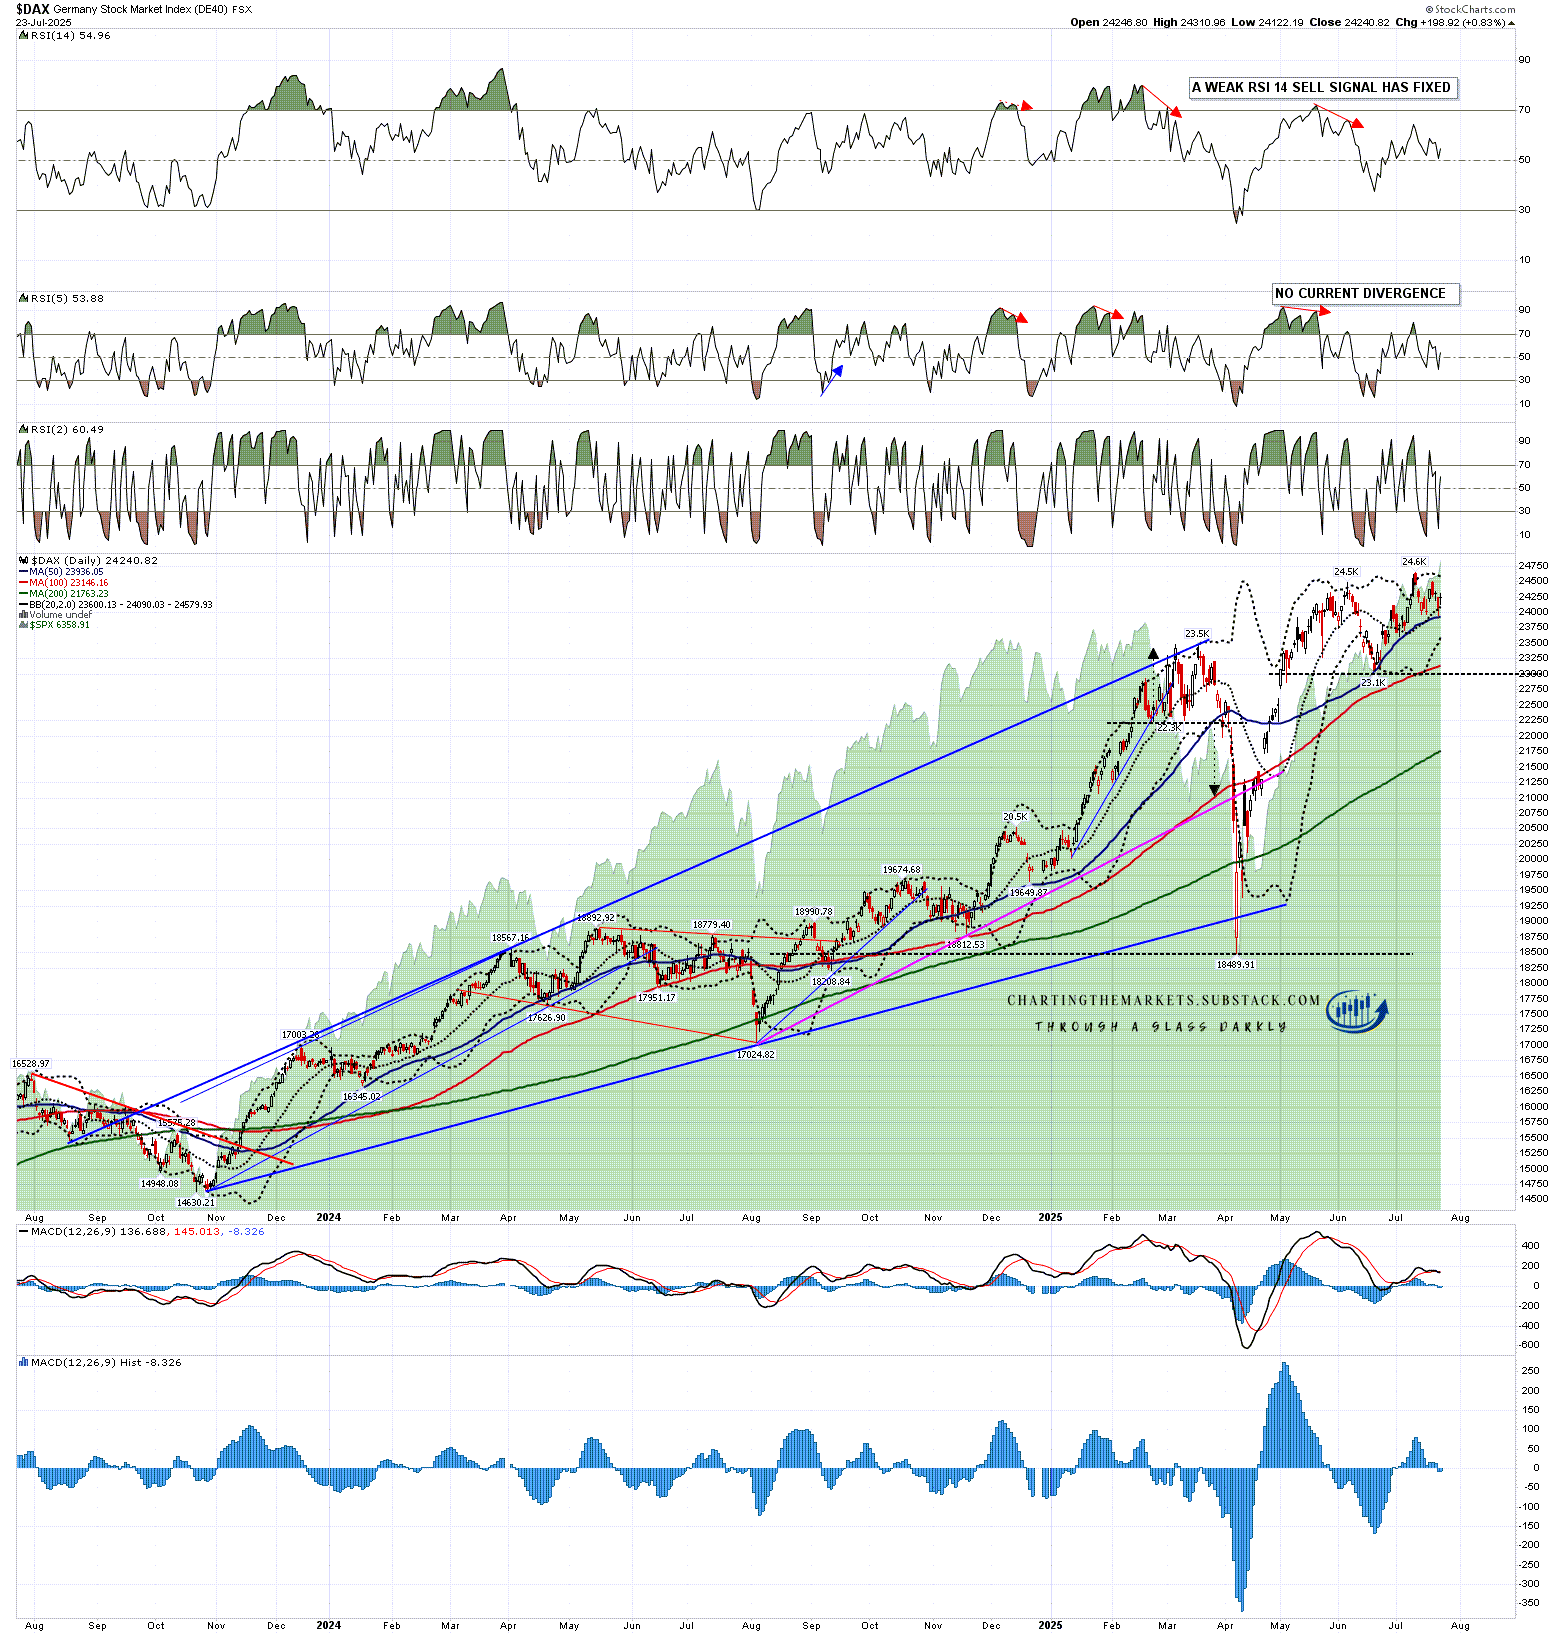
I went through a more thorough list of the unfinished business both finished and remaining on my The Bigger Picture video yesterday night but in brief I was looking on my premarket videos over the last few days for high retests on DIA and Nikkei, which we saw yesterday, a full all time high retest on INDU, not quite seen yesterday but close, and high retests on DAX and ESTX50, both of which have formed bull flags which have broken up but not yet made target.
I have also been looking for a possible topping setup to form on Crypto, which I ran through on last night’s video. I also covered that in a post on Tuesday. That too is forming as expected.
Altogether I’m thinking that we reach this inflection point in the next few days, likely next week, and that may well coincide with the legal ruling on the legality on Trump’s tariffs that is currently scheduled for the end of July. At the inflection point equities should either deliver at least a strong retracement, as I was looking at last week, or a break up towards the higher targets on SPX and QQQ that I was looking at in my post on Tuesday 3rd June.
On the DIA daily chart the high has been retested and a daily RSI 14 sell signal is now brewing.
DIA daily chart:
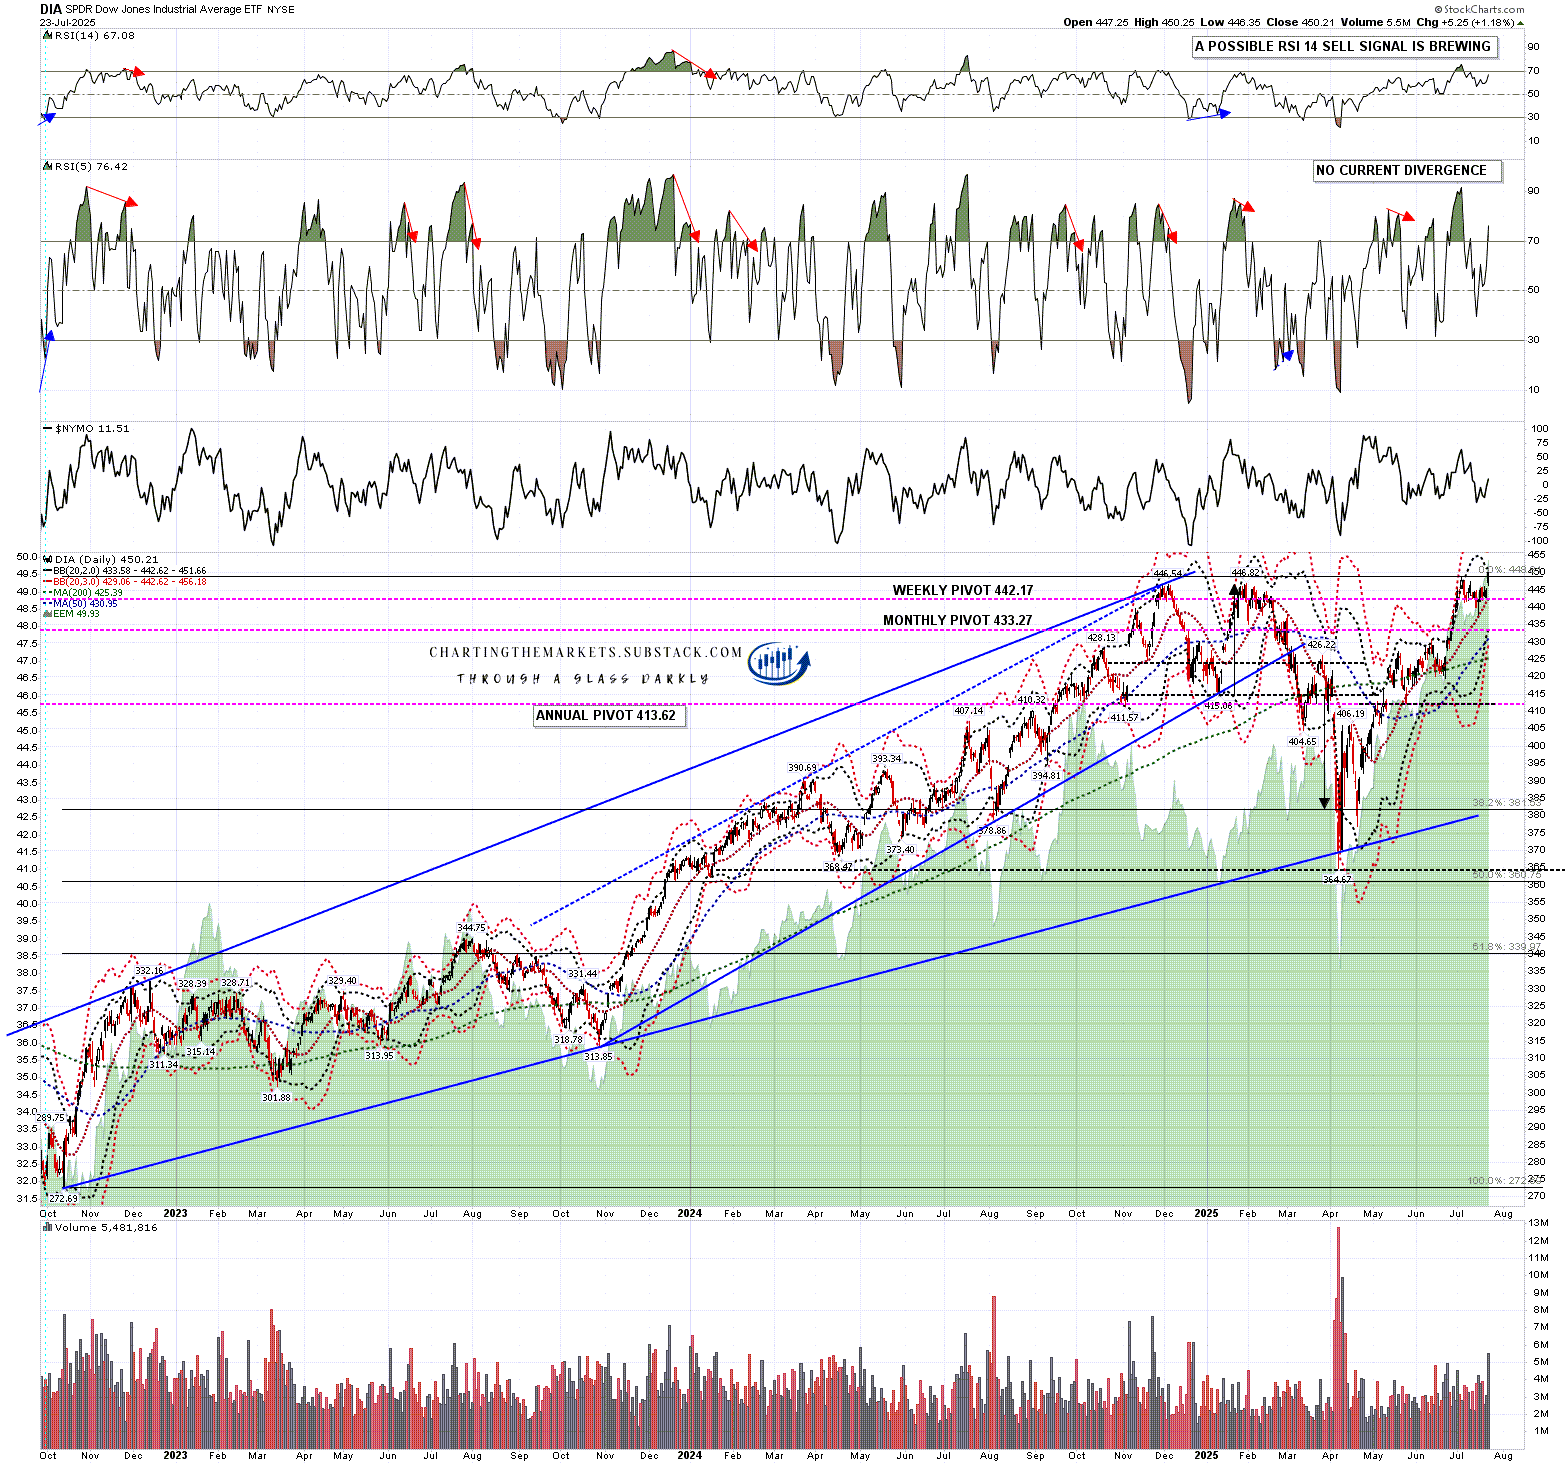
DIA needs to go just a little higher to deliver the retest of the all time high on INDU, which was very close at yesterday’s highs.
INDU weekly chart:
A bull flag has formed and broken up on the DAX hourly chart. That should deliver another all time high retest there:
DAX daily chart:
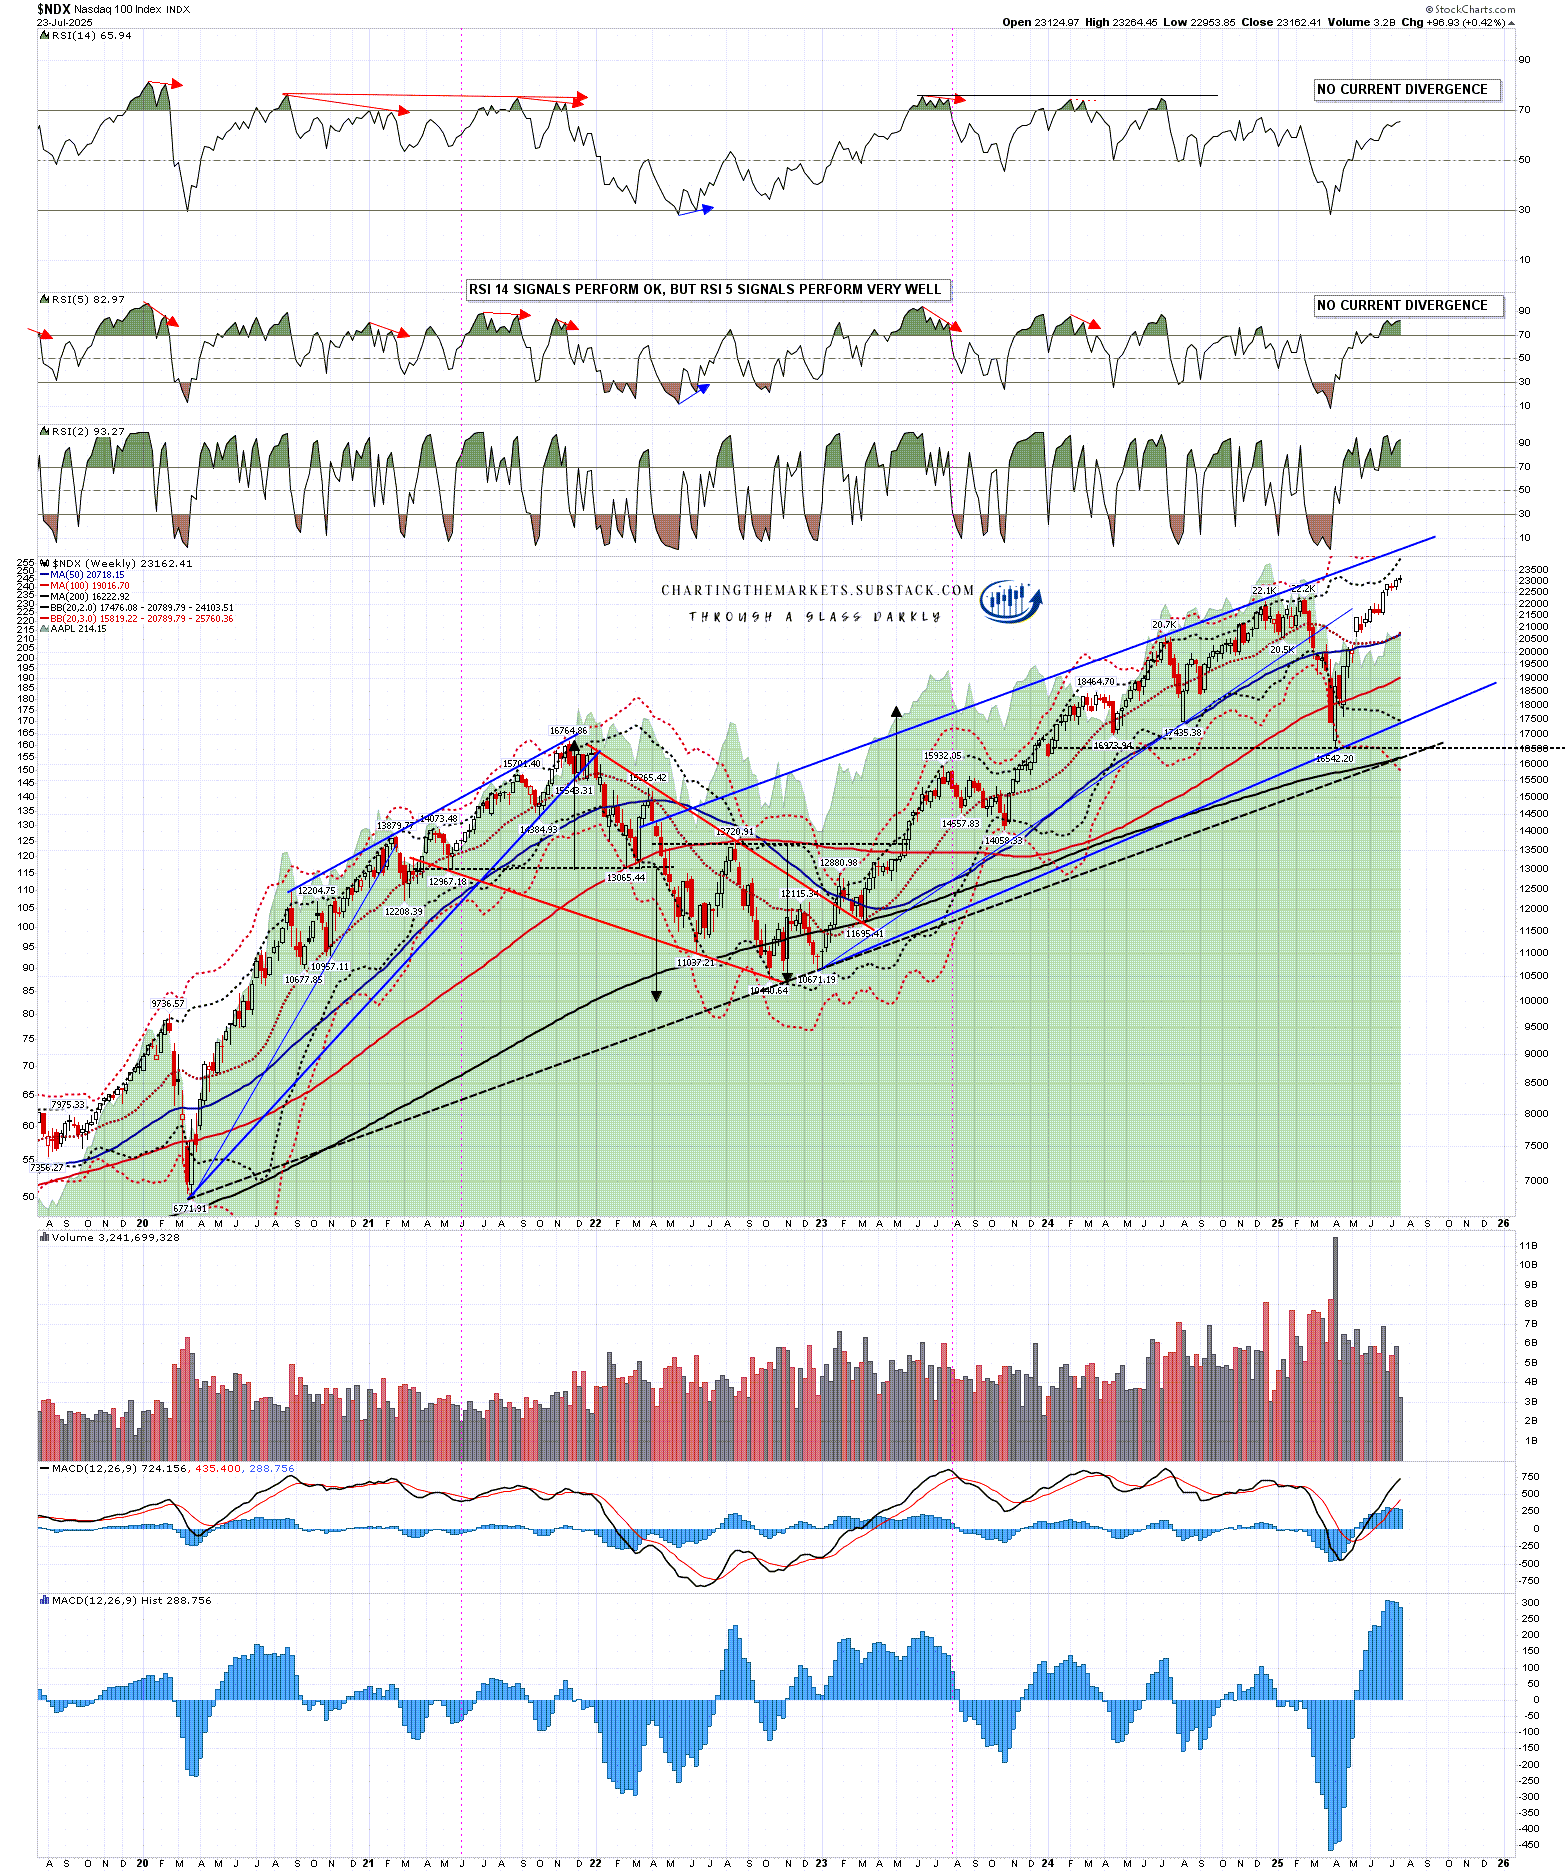
If equities break up at this inflection point the obvious upside target on NDX would be the resistance trendline on the chart below, currently in the 24,500 area.
NDX weekly chart:
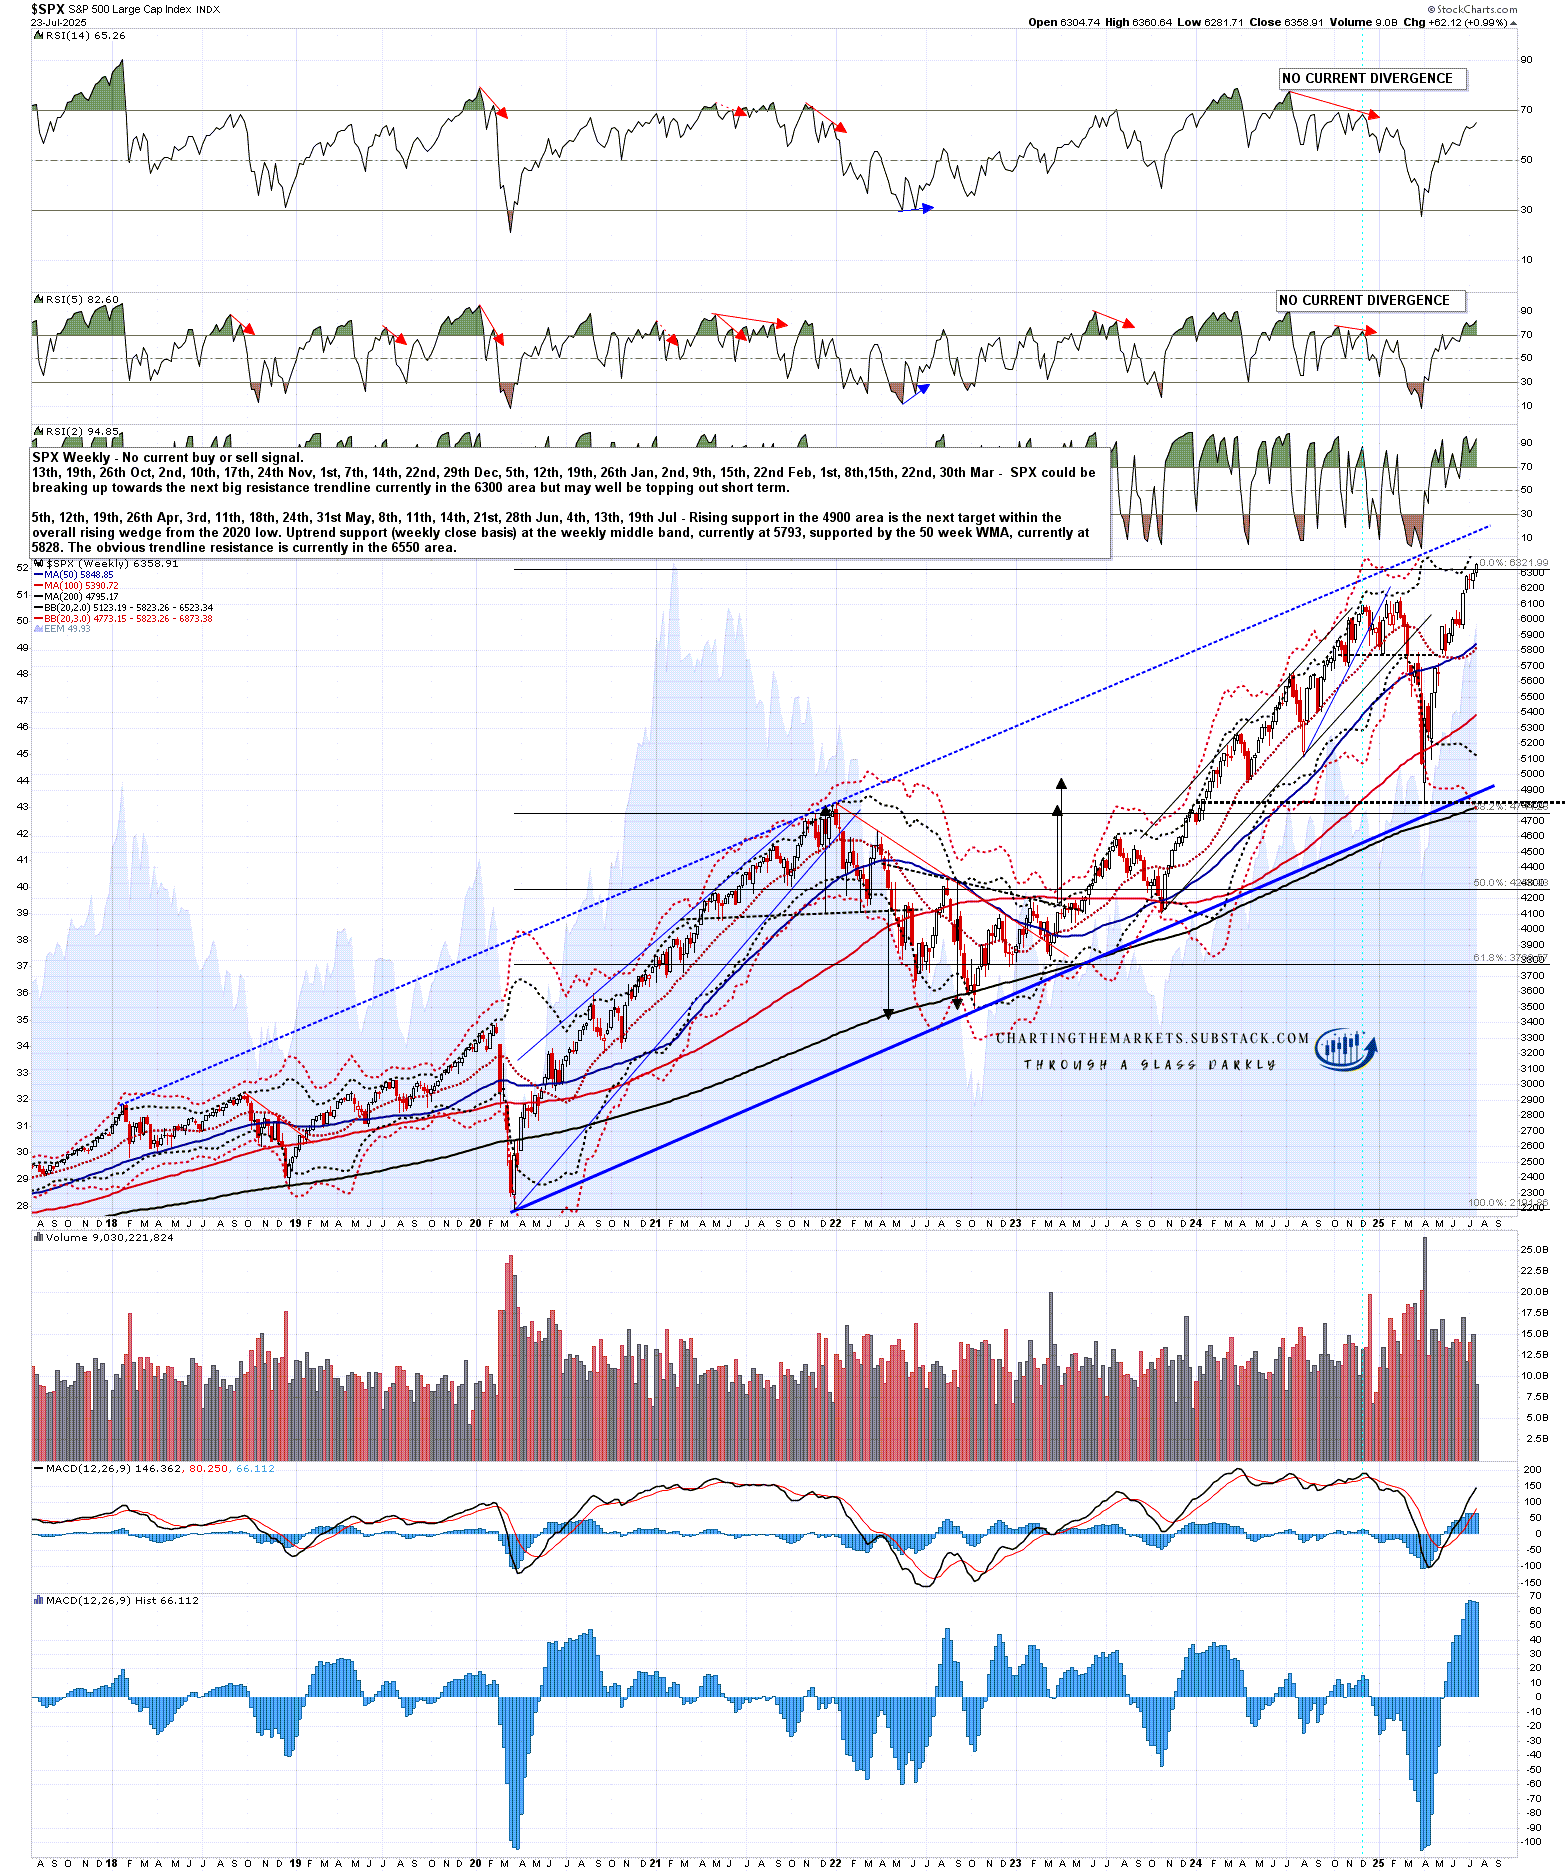
If equities break up at this inflection point the obvious upside target on SPX would be the resistance trendline on the chart below, currently in the 6500 area.
SPX weekly chart:
Trump has now made a deal on tariffs with Japan and appears to be close to another with the EU. If the tariffs are ruled illegal that would likely be positive for equities, if not then a deal with the EU would also likely be positive. I’m doubtful about the larger economic backdrop but either could deliver those higher targets. We’ll see.
I’ve been saying the following on all my posts so far this year:
As I have been since the start of 2025 I’m still leaning on the bigger picture towards a weak first half of 2025 and new all time highs later in the year, very possibly as a topping process for a much more significant high. One way or another I think we’ll be seeing lower soon and I’m not expecting this to be a good year for US equities, not least because both of the last two years have been banner years for US equities. A third straight year of these kinds of gains looks like a big stretch. I could of course however be mistaken. UPDATE 16th July 2025 - We may now be completing the initial strong decline and then the new all time highs I projected for this year, and making the more significant high I was projecting that process might deliver.
If you like my analysis and would like to see more, please take a free subscription at my chartingthemarkets substack, where I publish these posts first. I also do a premarket video every day on equity indices, bonds, currencies, energies, precious commodities and other commodities at 8.45am EST, but only for paying subscribers. Other places to find me are my twitter, and my Youtube channel.
No comments:
Post a Comment