
Back on Tuesday 3rd June I laid out a possible bullish scenario in which I was looking for retests of the all time highs on SPX and NDX, with follow-on targets if both ran higher, a retest of the all time high on INDU, and a possible longer shot retest of the all time high on IWM based on a large IHS. Since then we have seen all three of those new all time highs on SPX, NDX and INDU, and the IHS on IWM has broken up hard and made it slightly less than halfway to the target at a retest of that all time high.
What we haven’t seen yet is the further extension to the possible trendline targets that I was looking at on SPX into the 6450-6500 area, or on NDX into the 24000-24500 area, or the new all time high on IWM of course, but I think this rally is likely now very close to at minimum to a steep retracement and may currently be making the highest highs that we will see in 2025.
Why’s that? Well tariffs have been making a big comeback in the last few days with a new 50% tariff on copper, and letters sent to Canada, Mexico, the EU, Japan and South Korea scheduling tariffs over 30% to start on August 1st. This is dashing previous hopes that the Trump administration might just leave tariffs at a basic rate of 10% with a few other higher tariffs on steel, aluminium, vehicles and so on. Not to put too fine a point on it there is little doubt historically that both tariffs and uncertainty are bad for economic growth and, if sustained, the return of the tariffs drama is not likely to be good for the US economy.
These could all be negotiated away or delayed before August 1st of course but I think that is looking less likely because Trump is aware of the TACO meme, and after the April tariff pause and his embarrassing showing negotiating with Putin so far this year, may be feeling that his ability to be tough in a negotiation needs to be demonstrated, and additionally because he’s very keen for everyone to be interested in anything other than the Epstein Files, and likely that will remain the case for a while.
The pattern and divergence setups here across the US indices and many top US stocks are also signalling that a significant high is likely close and that could be either a very significant high leading to lower lows for 2025 or at minimum deliver a stronger retracement than we have seen since the April low.
The rising wedge on SPX from the April low is a beauty, and started to break down slightly yesterday. This break down likely puts SPX into a topping process. An hourly RSI 14 sell signal has fixed which I am expecting to reach target, though we could see another high retest first:
SPX 60min chart:
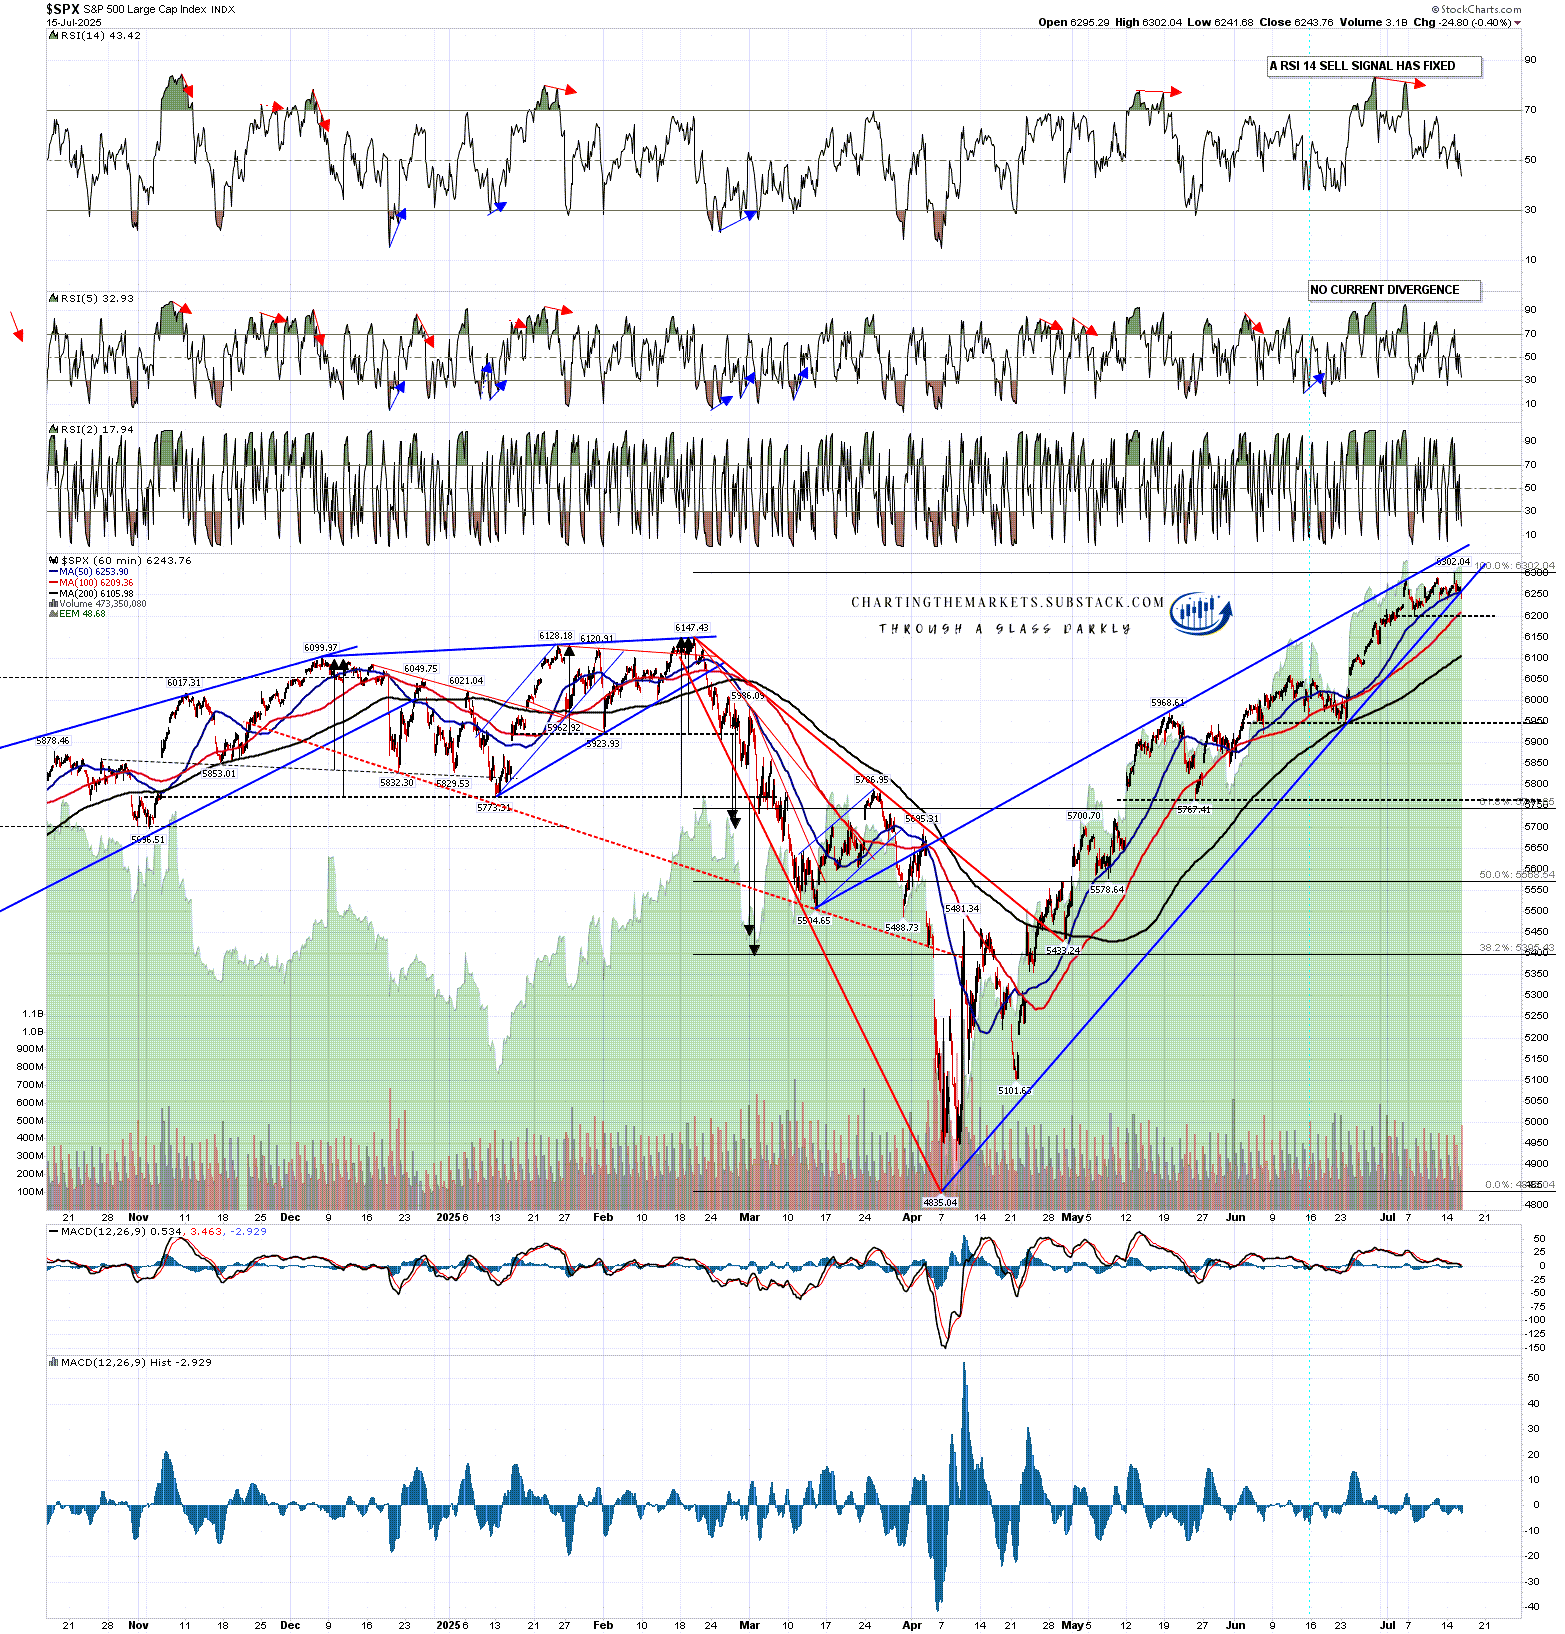
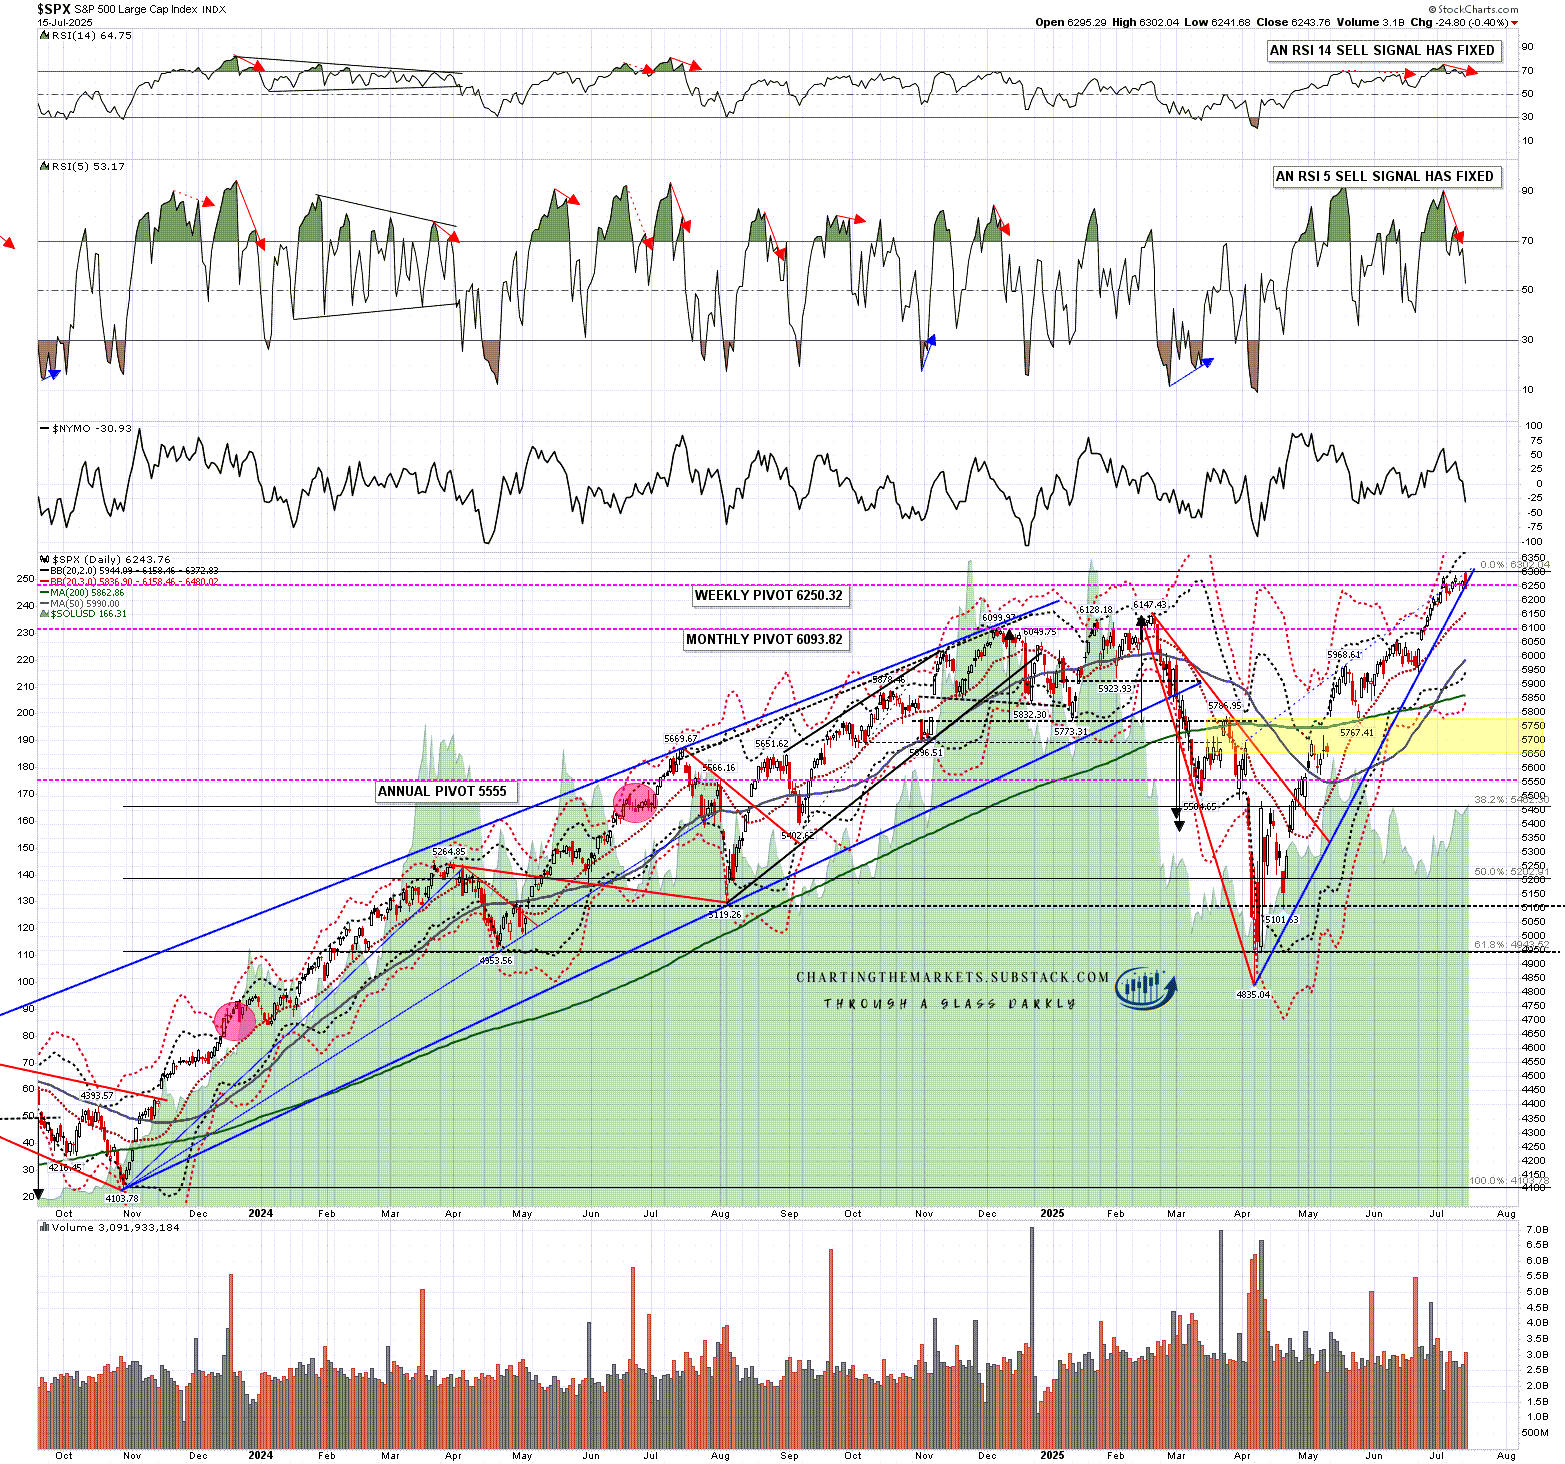
On the daily chart RSI 14 and RSI 5 sell signals fixed yesterday, so on the next retracement I’d be looking ideally for a retracement low in the 5750 or 5500 areas, and if a larger topping pattern forms via either of those, then we might well see a full retracement back into the April low at 4835.04. I would note that the April low is also possible double top support that on a strong break would look for a target in the 3400-3500 area.
SPX daily chart:
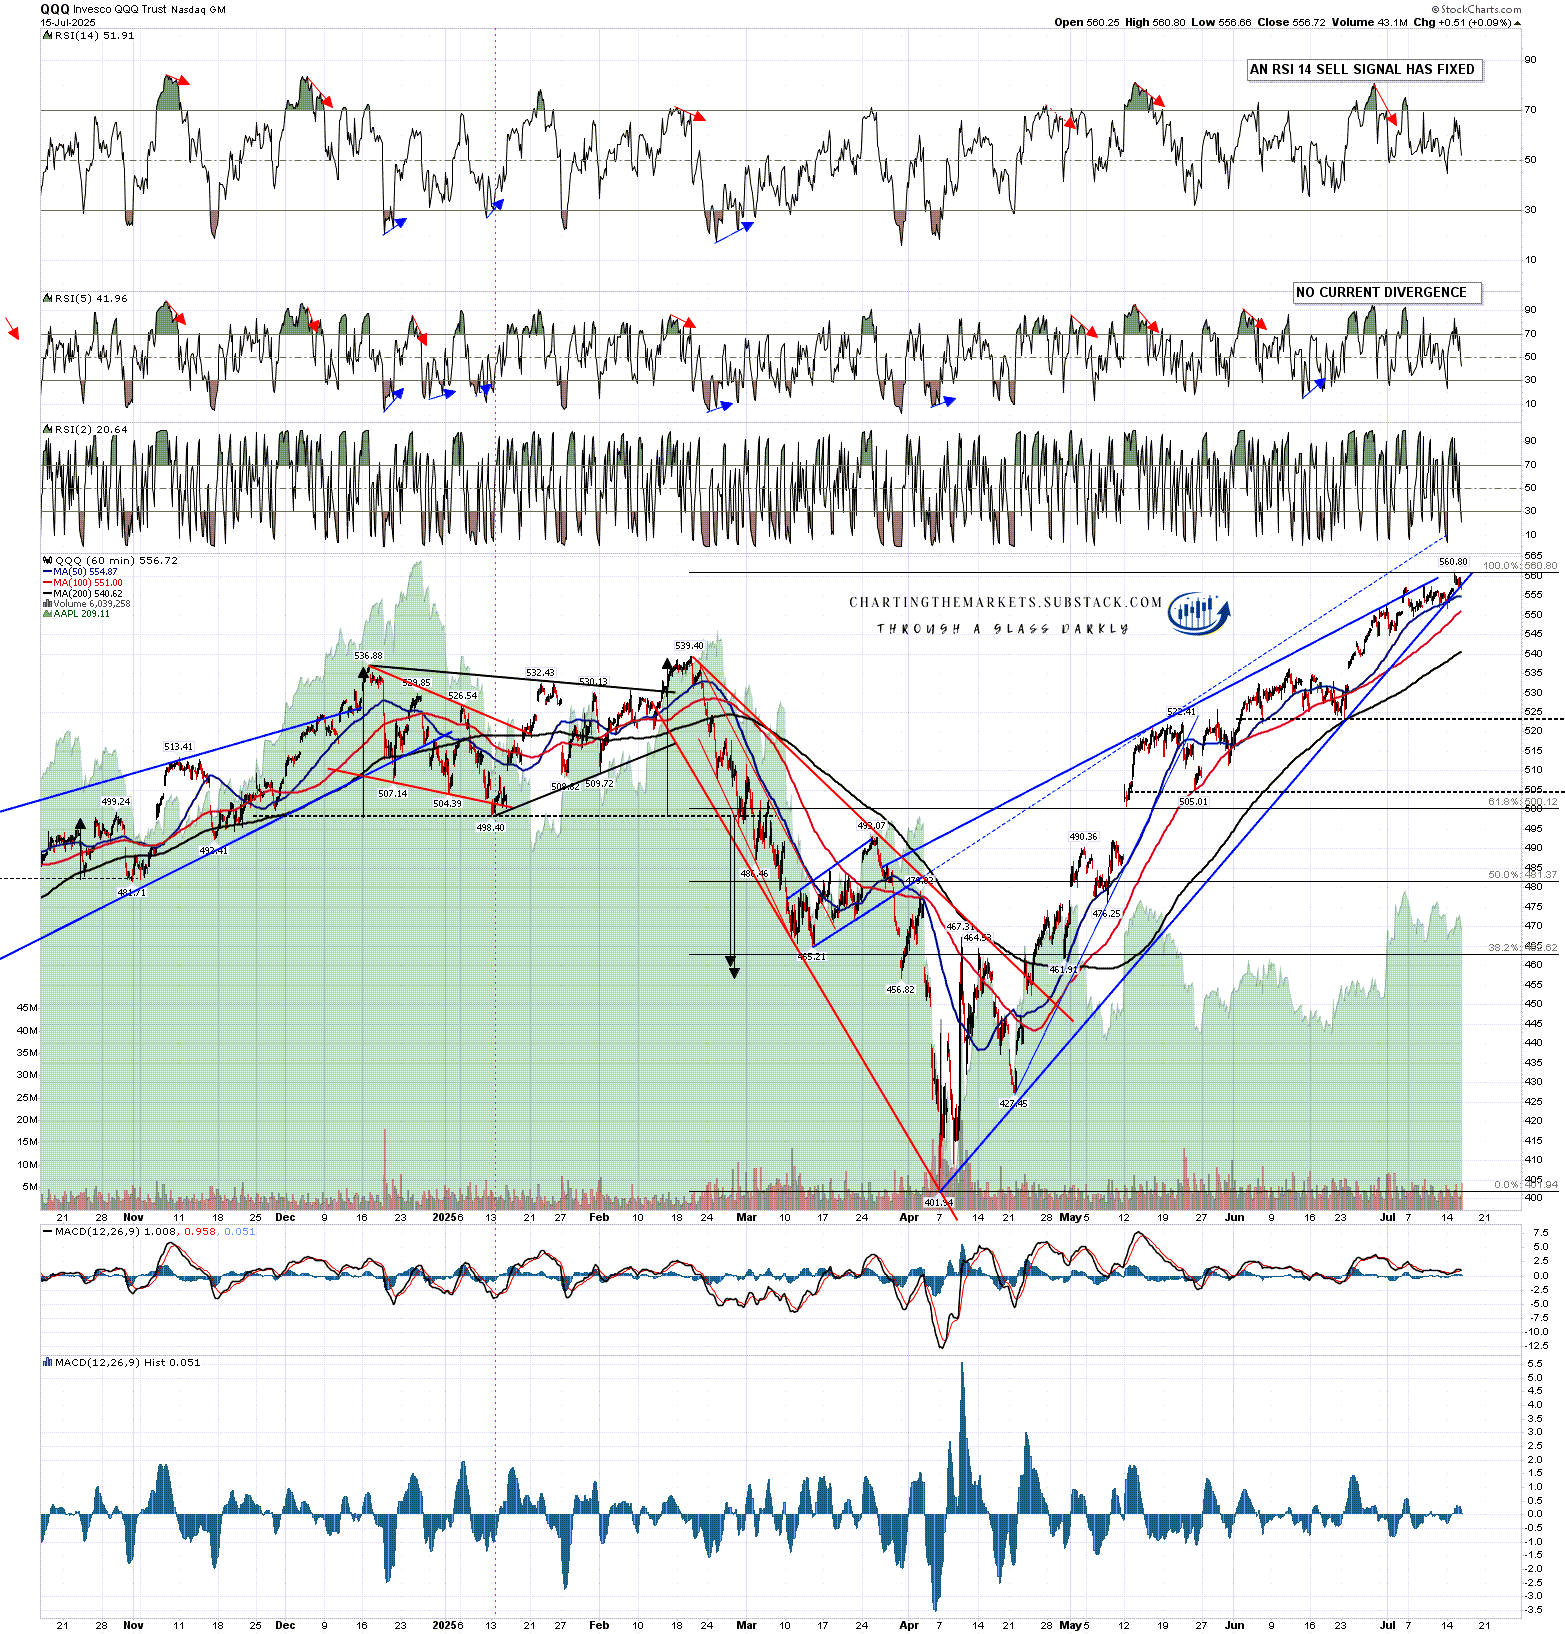
On the Qs the rising wedge is also of very high quality, overthrew slightly at the high and is starting to break down. On the daily chart (not shown) an RSI 5 sell signal has already fixed and a weak RSI 14 sell signal is brewing. This also looks very bearish. An hourly RSI 14 sell signal has fixed which I am expecting to reach target, though we could see another high retest first.
QQQ 60min chart:
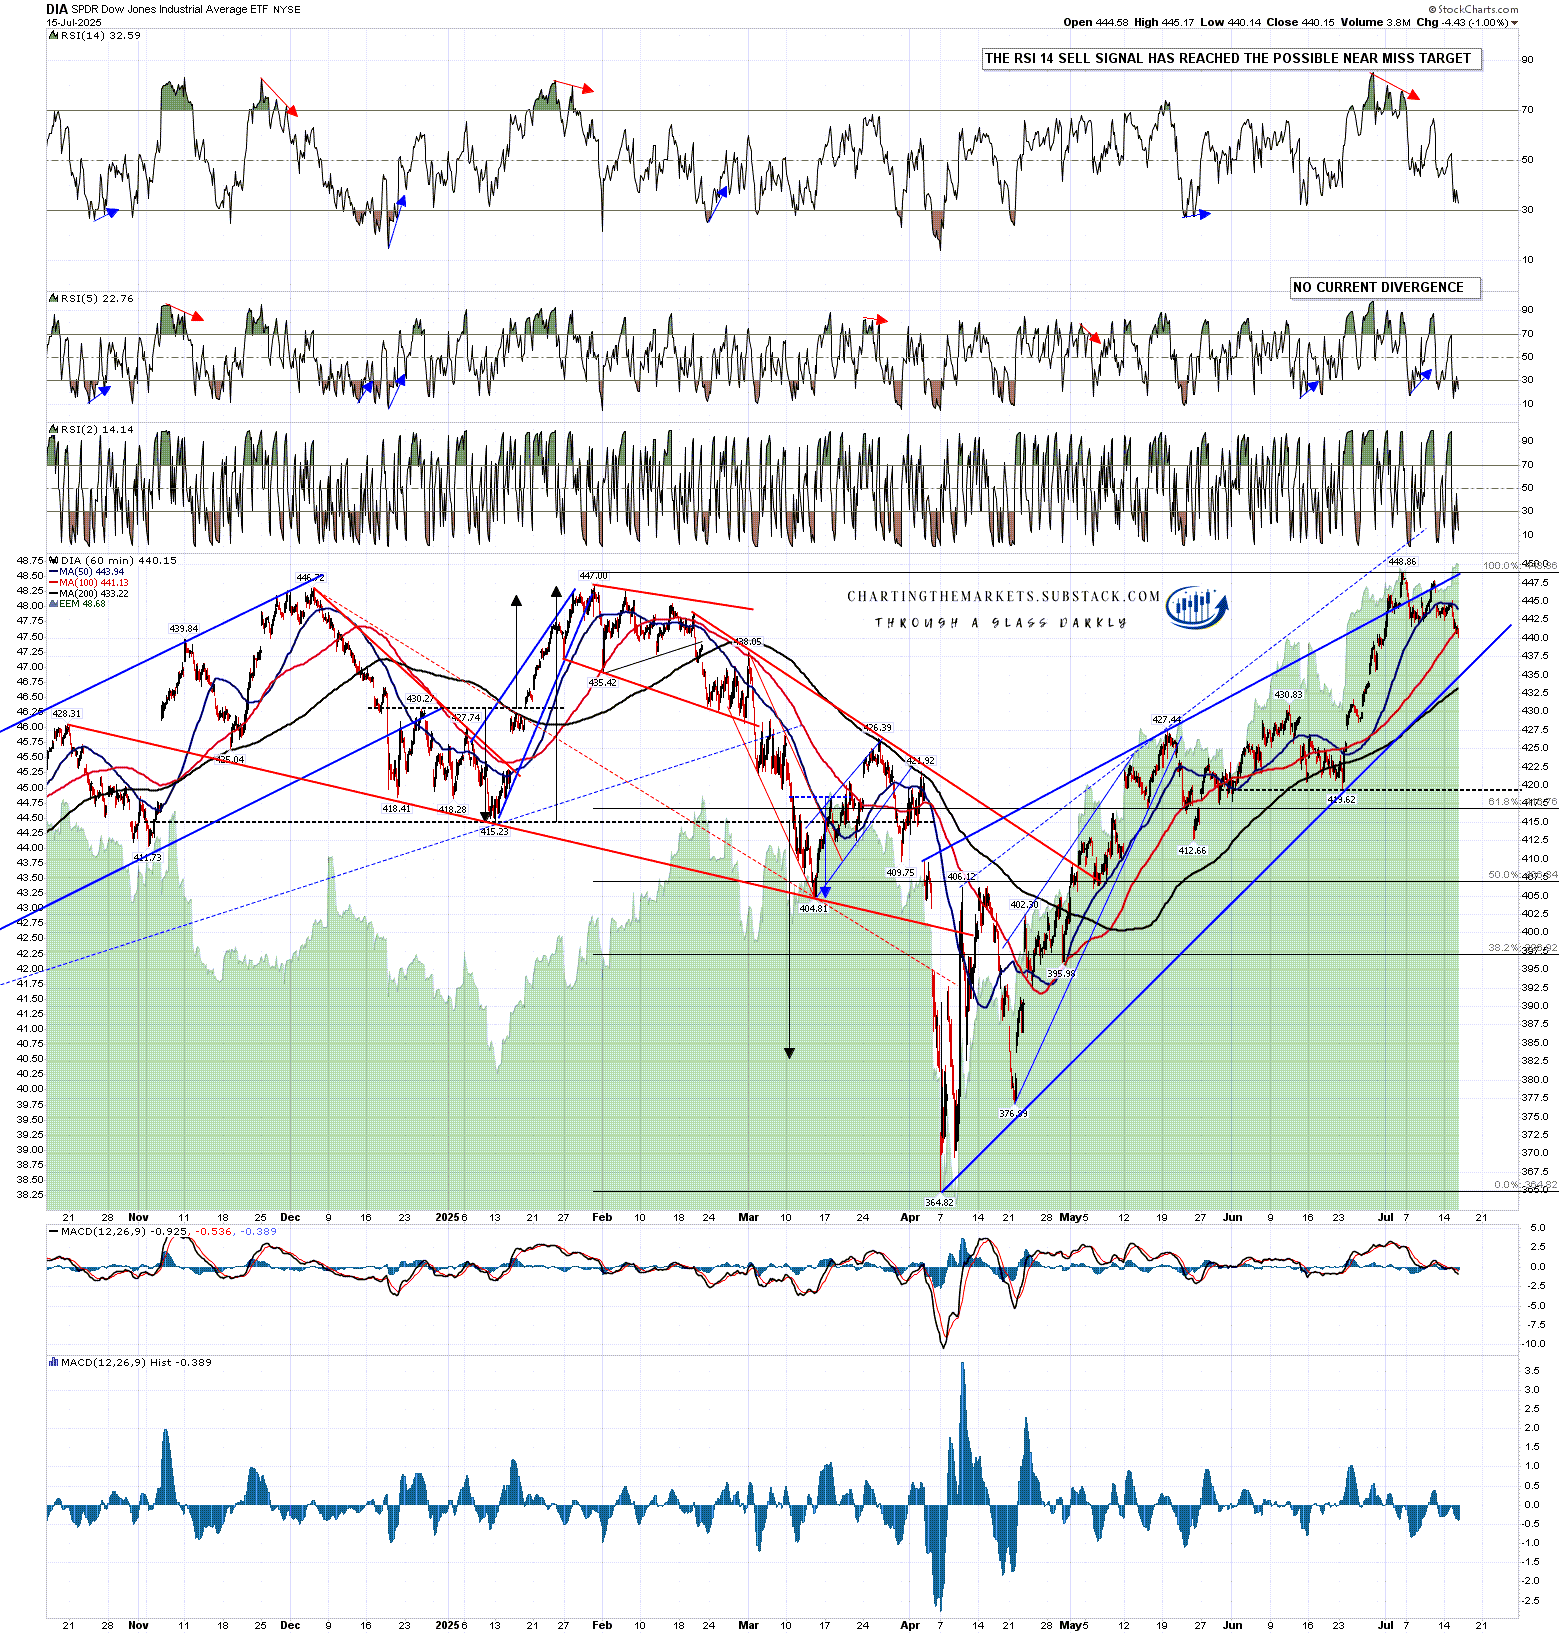
The rising wedges from the April low aren’t as nice on DIA and IWM but are still decent quality. The wedge on DIA has overthrown bearishly but DIA is the only one of these four US indices not currently showing daily negative divergence. That could be fixed with another high retest which would likely set both RSI 14 and RSI 5 sell signals brewing on the daily chart.
In the shorter term an hourly RSI 14 sell signal has fixed and reached the possible near miss target yesterday.
DIA 60min chart:
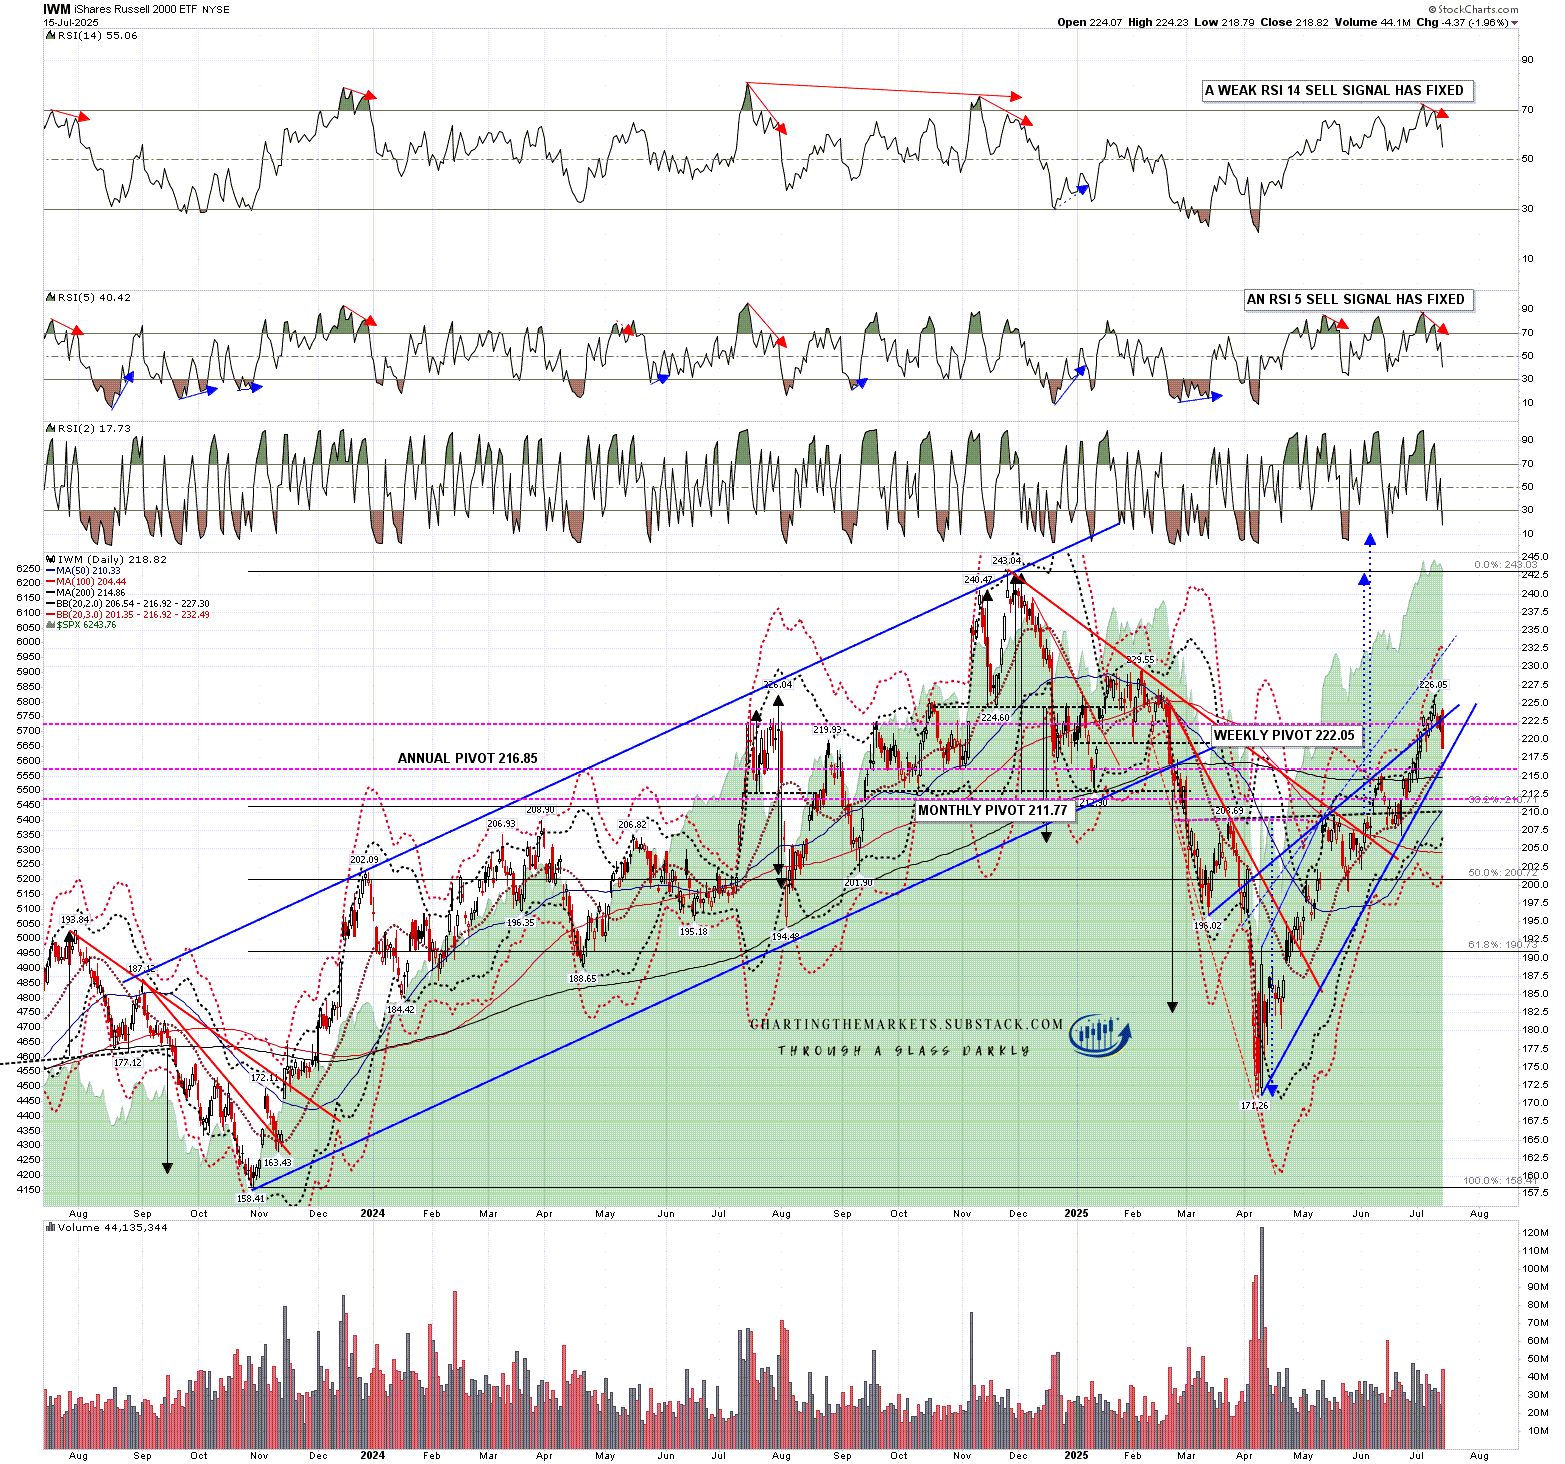
Daily RSI 14 and RSI 5 sell signals fixed on the IWM chart a few days ago and IWM has been the weakest index since. In my view that seems likely to continue as IWM is the most vulnerable to higher interest rates and inflation, both of which have become more likely with the recent passing of Trump’s tax and spending bill and the return of tariffs.
This also calls into serious question the centrepiece of the bullish case on equities here, which is the big IHS on IWM that I was writing about in my post on Tuesday 3rd June. If this IHS fails then the next obvious target would be a return to the April lows.
IWM daily chart:
Subject to how the tariff situation develops my working assumption is now that all the US indices may well be topping out for 2025 and that we will likely soon see at least a strong retracement on all of these, ideally retracing 50% or so of the move up from the April low. If tariffs are coming back in a big way then I think the April lows could be broken hard in the next few months.
I’ll be doing another post this week looking at the big topping patterns that may be forming here on all four of these US equity indices that could now start to play out and would note that looking at big US stocks across the indices, I am seeing patterns and divergences as negative or worse than I am seeing on these indices. I’m planning to post a selection of those over the next few days as well.
I’ve been saying the following on all my posts so far this year:
As I have been since the start of 2025 I’m still leaning on the bigger picture towards a weak first half of 2025 and new all time highs later in the year, very possibly as a topping process for a much more significant high. One way or another I think we’ll be seeing lower soon and I’m not expecting this to be a good year for US equities, not least because both of the last two years have been banner years for US equities. A third straight year of these kinds of gains looks like a big stretch. I could of course however be mistaken. UPDATE 16th July 2025 - We may now be completing the initial strong decline and then the new all time highs I projected for this year, and making the more significant high I was projecting that process might deliver.
If you like my analysis and would like to see more, please take a free subscription at my chartingthemarkets substack, where I publish these posts first. I also do a premarket video every day on equity indices, bonds, currencies, energies, precious commodities and other commodities at 8.45am EST, but only for paying subscribers. Other places to find me are my twitter, and my Youtube channel.
No comments:
Post a Comment