
Back in my post on 11th April I called the likely start of a strong rally which we then saw.
Back in my post on 12th May I called for new all time highs on Bitcoin (BTCUSD) and laid out possible IHS scenarios on both Solana (SOLUSD) and Ethereum (ETHUSD), looking for ideal right shoulder lows on Solana in the 125.43 area and on Ethereum in the 2074.27 area. That hasn’t gone quite as I drew then but essentially both are still running that scenario.
Back in my post on 23rd June I called the likely lows on those right shoulders made on Solana at 126.09 and on Ethereum at 2113.65, and was looking for that IHS scenario on both to start to play out.
In my last post on 18th July I was looking at the IHS that had since broken up on Ethereum and the progress made towards the IHS neckline on Solana.
On my daily premarket videos I’ve been raising the possibility that the Solana IHS might fail hard after breaking up and, with that IHS having now broken up, I want to look at that possibility today.
First though we have seen Bitcoin consolidating in recent days as Ethereum and Solana have been powering higher. That’s not too surprising as the big declines on Ethereum and Solana this year also happened without much reaction on Bitcoin.
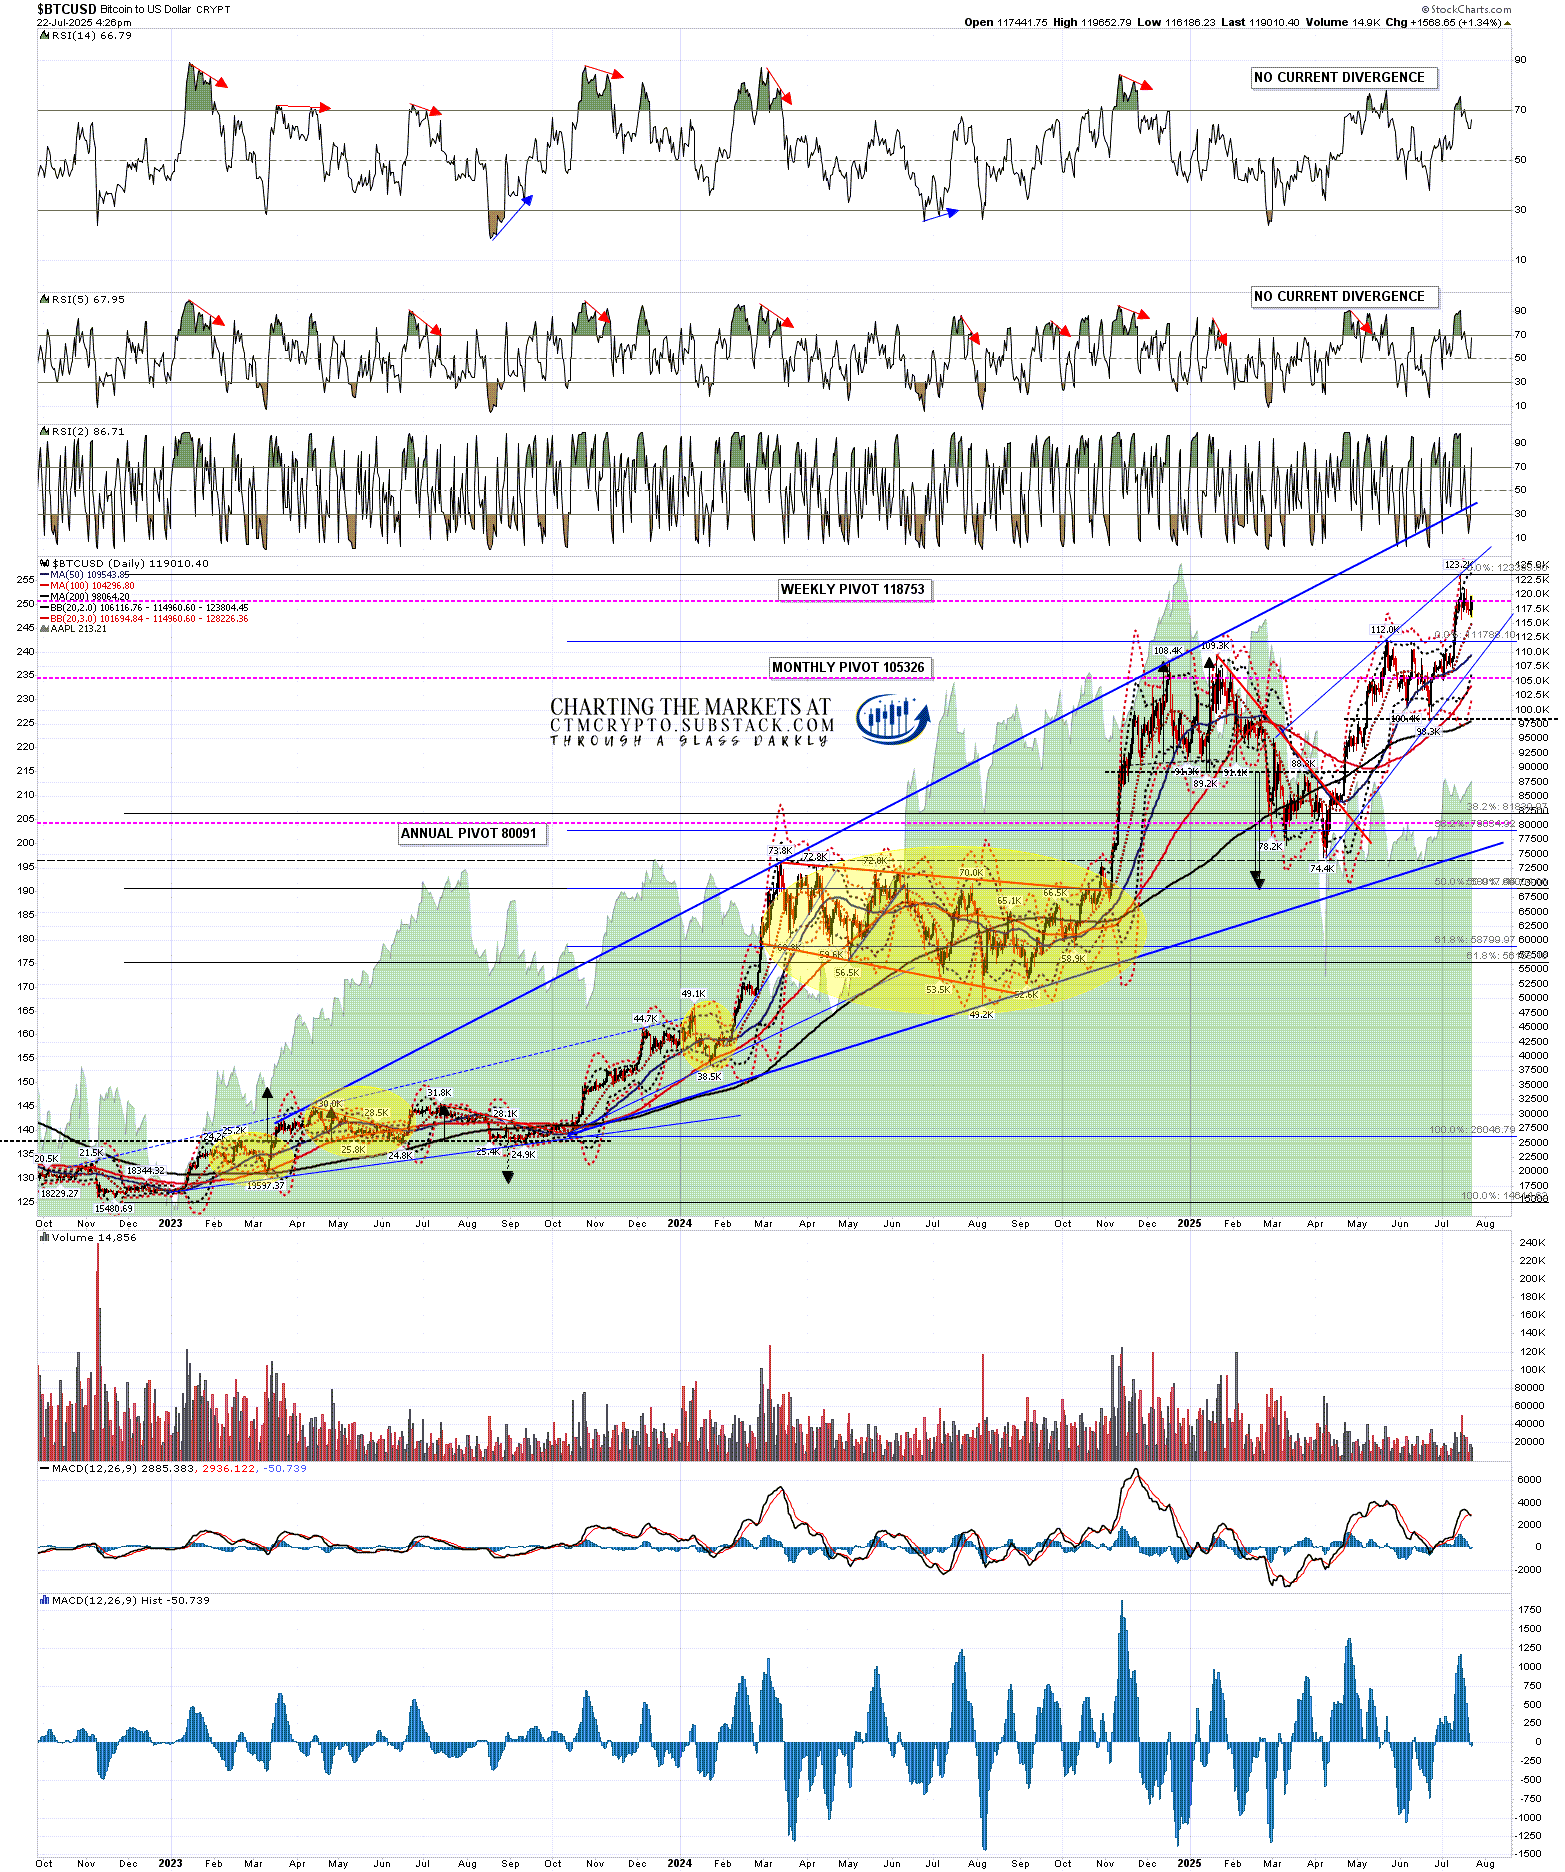
On the Bitcoin daily chart I’m seeing this as a bullish consolidation, which should likely deliver a retest of the all time high in due course. If seen now that would set possible RSI 14 and RSI 5 sell signals brewing. If Bitcoin goes a bit lower first then the retest would likely still set a possible RSI 14 sell signal brewing.
BTCUSD daily chart:
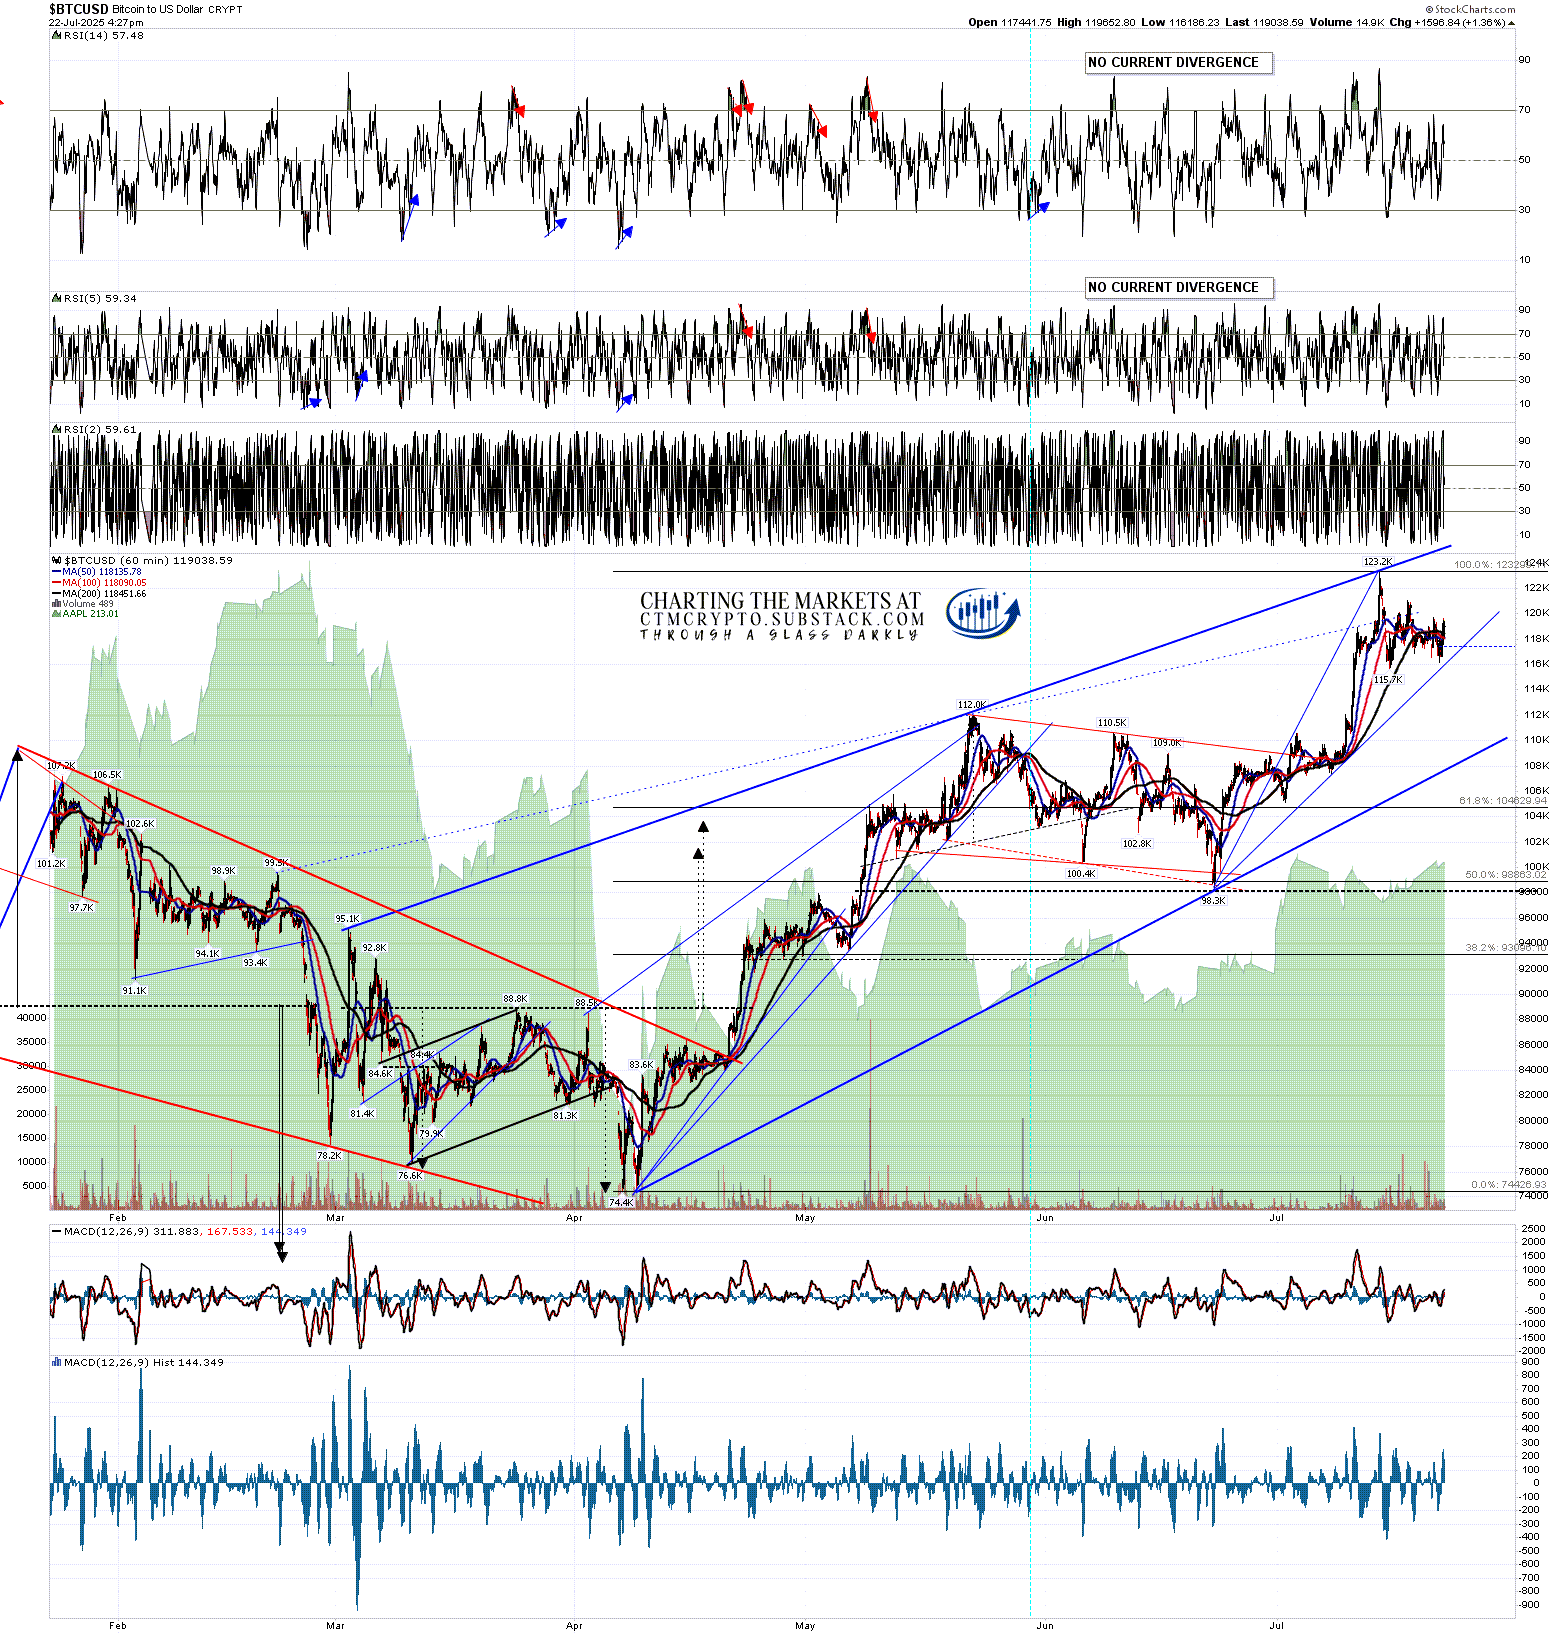
On the hourly chart there is a high quality rising wedge which has formed since the April low. The next obvious target within the wedge is rising wedge support, currently in the 107.5k area, but I would note that a common way to reach that target from here would be to retest the current all time high, setting up the second high of a small double top, and then break down from that double top towards a target (based on the current ATH) in the 108.3k area.
BTCUSD 60min chart:
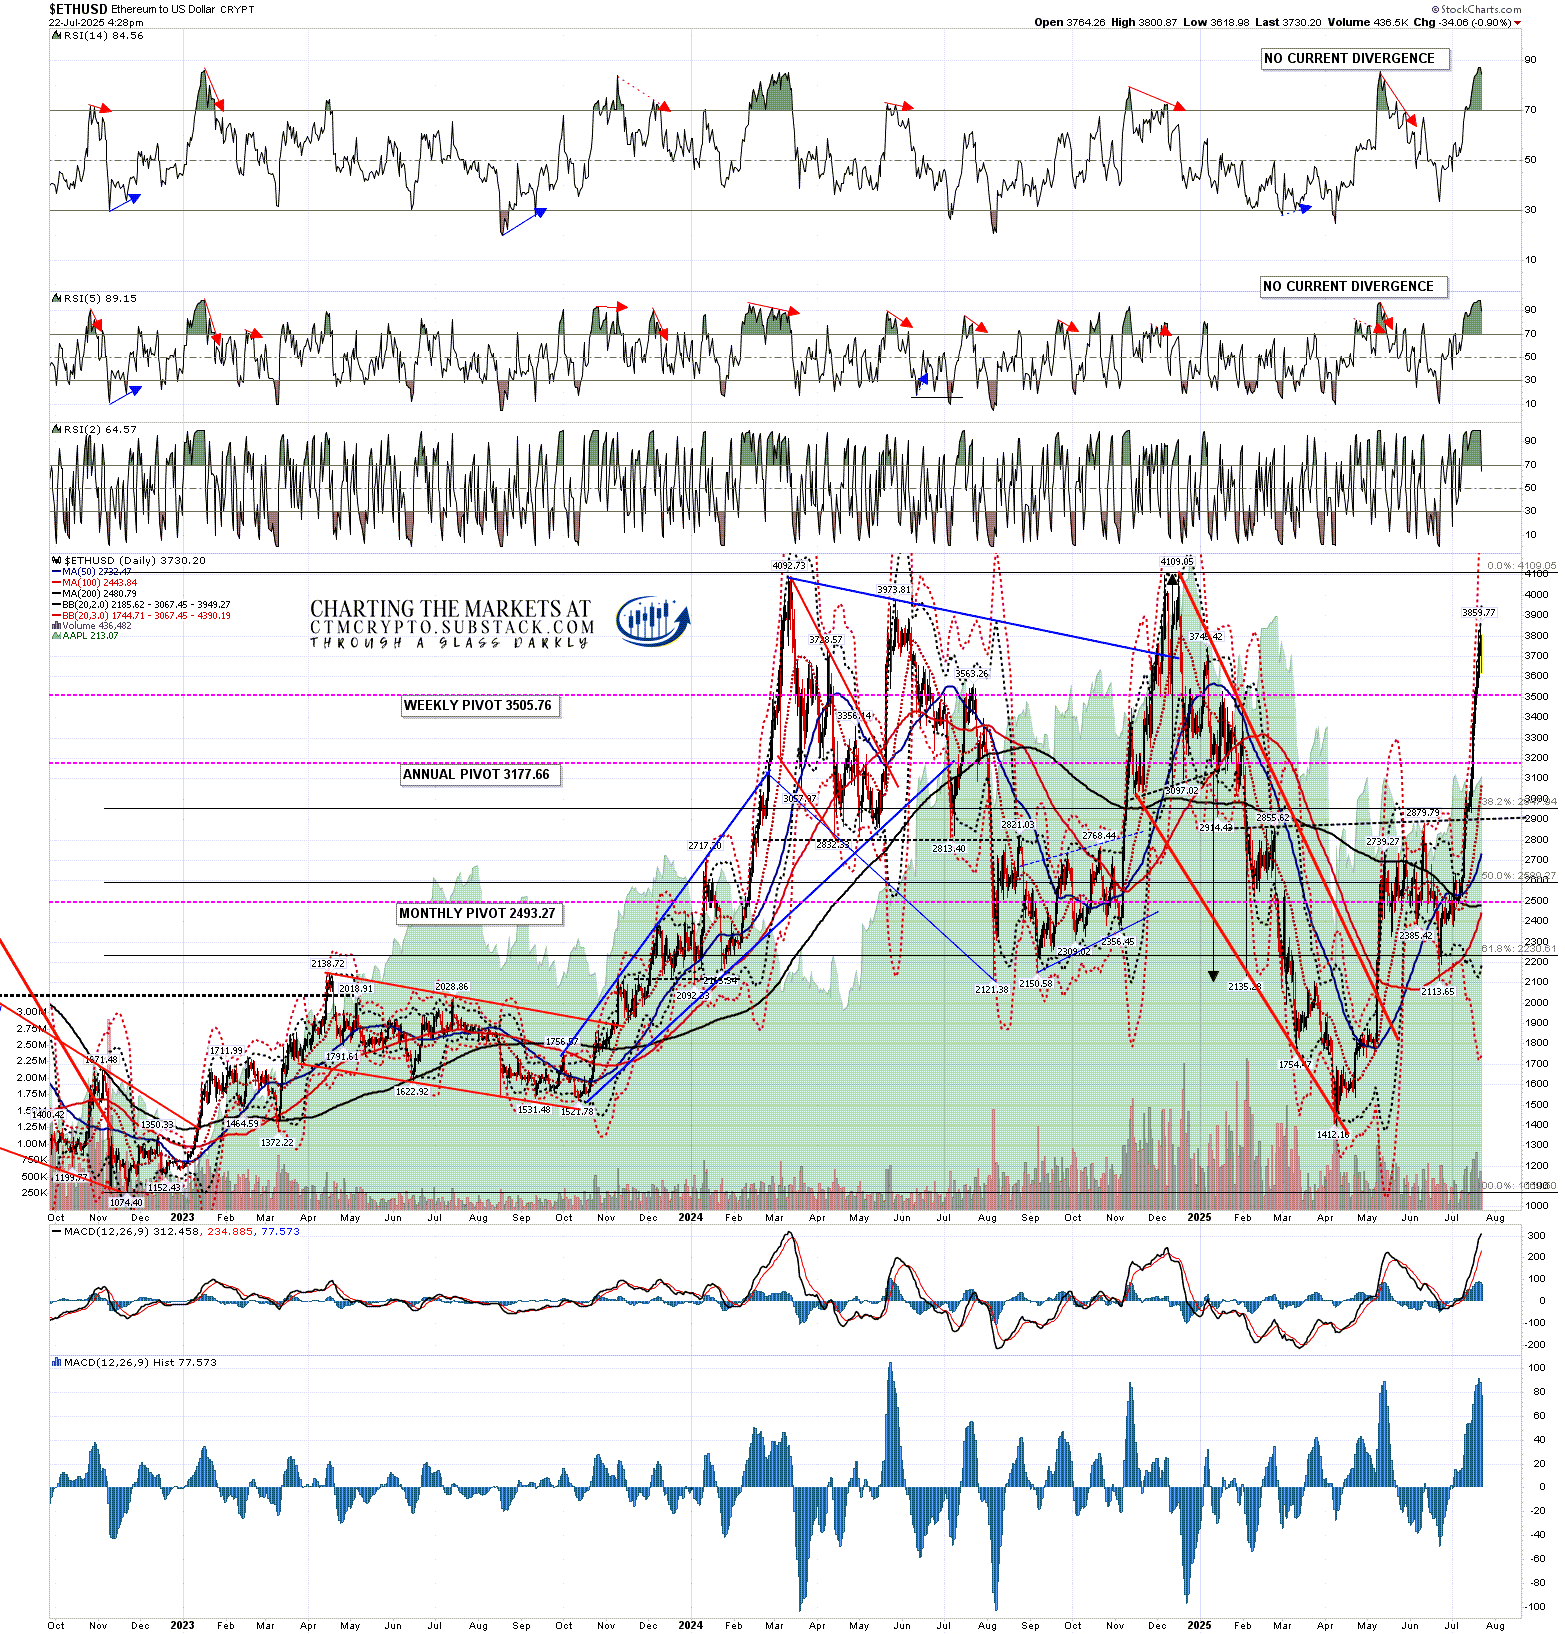
Looking at the Ethereum daily chart, both RSI 14 and RSI 5 have reached levels higher than anything seen in the last three years. The IHS target is at a retest of the last 2025 high at 4109.05 and Ethereum has now come close enough to that target that I would be surprised if that target is not reached before this current wave up ends.
ETHUSD daily chart:
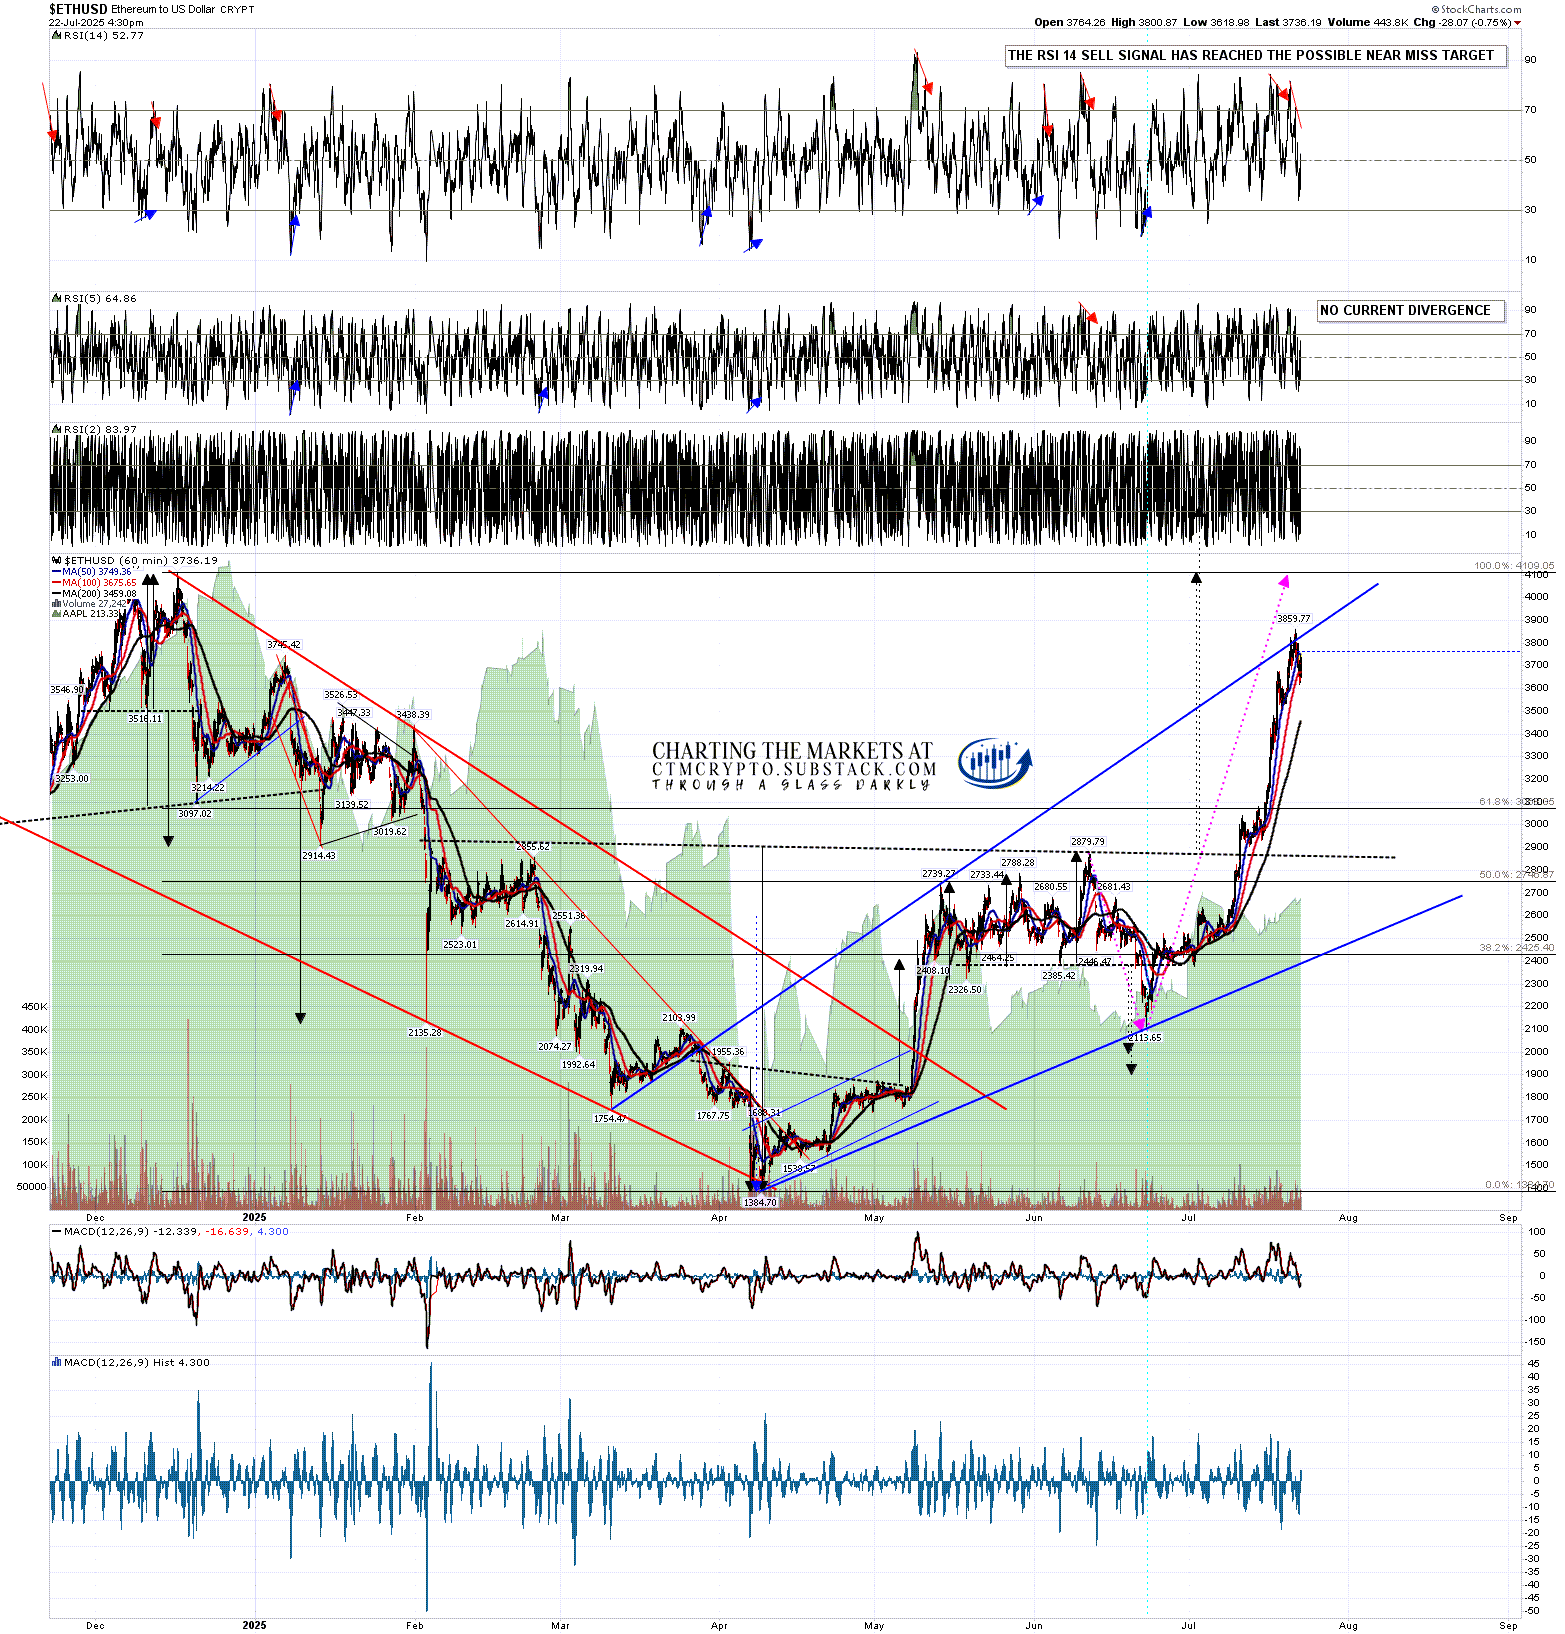
Looking at the hourly chart Ethereum has reached the obvious resistance trendline I showed in my post last week, and is so far finding resistance there. I am thinking we might see some bullish consolidation here that might then retest the short term high and set up some negative RSI divergence. I would also note that Ethereum could reach that IHS target at 4109.05 under that resistance trendline by mid-August.
ETHUSD 60min chart:
On the Solana daily chart RSI 14 and RSI 5 have now also both reached levels not seen in the last three years. The IHS on Solana has now also broken up with a target in the 283 area, but effectively with a target at a retest of the all time high at 294.95.
This is a good setup, with my concern being that US equities might top out before it has a chance to reach that target. There remains little evidence that Crypto can sustain a strong uptrend while equities are in a significant downtrend, though that may change when there is a serious bonds crisis in the US, which seems likely in the next year or two but less likely within the next few months.
If Solana isn’t going to make that IHS target, then the most obvious place for any IHS to fail is just after it breaks up, so I’m watching this area over 200 with great interest.
If we are going to see Solana fail in this area then ideally I’d be looking for some retracement here, then a retest of this high setting up possible daily RSI sell signals, and then a hard fail.
SOLUSD daily chart:

Is there any setup to see this possible topping sequence on Solana? Yes, though I wouldn’t be that surprised to see Solana break up through it.
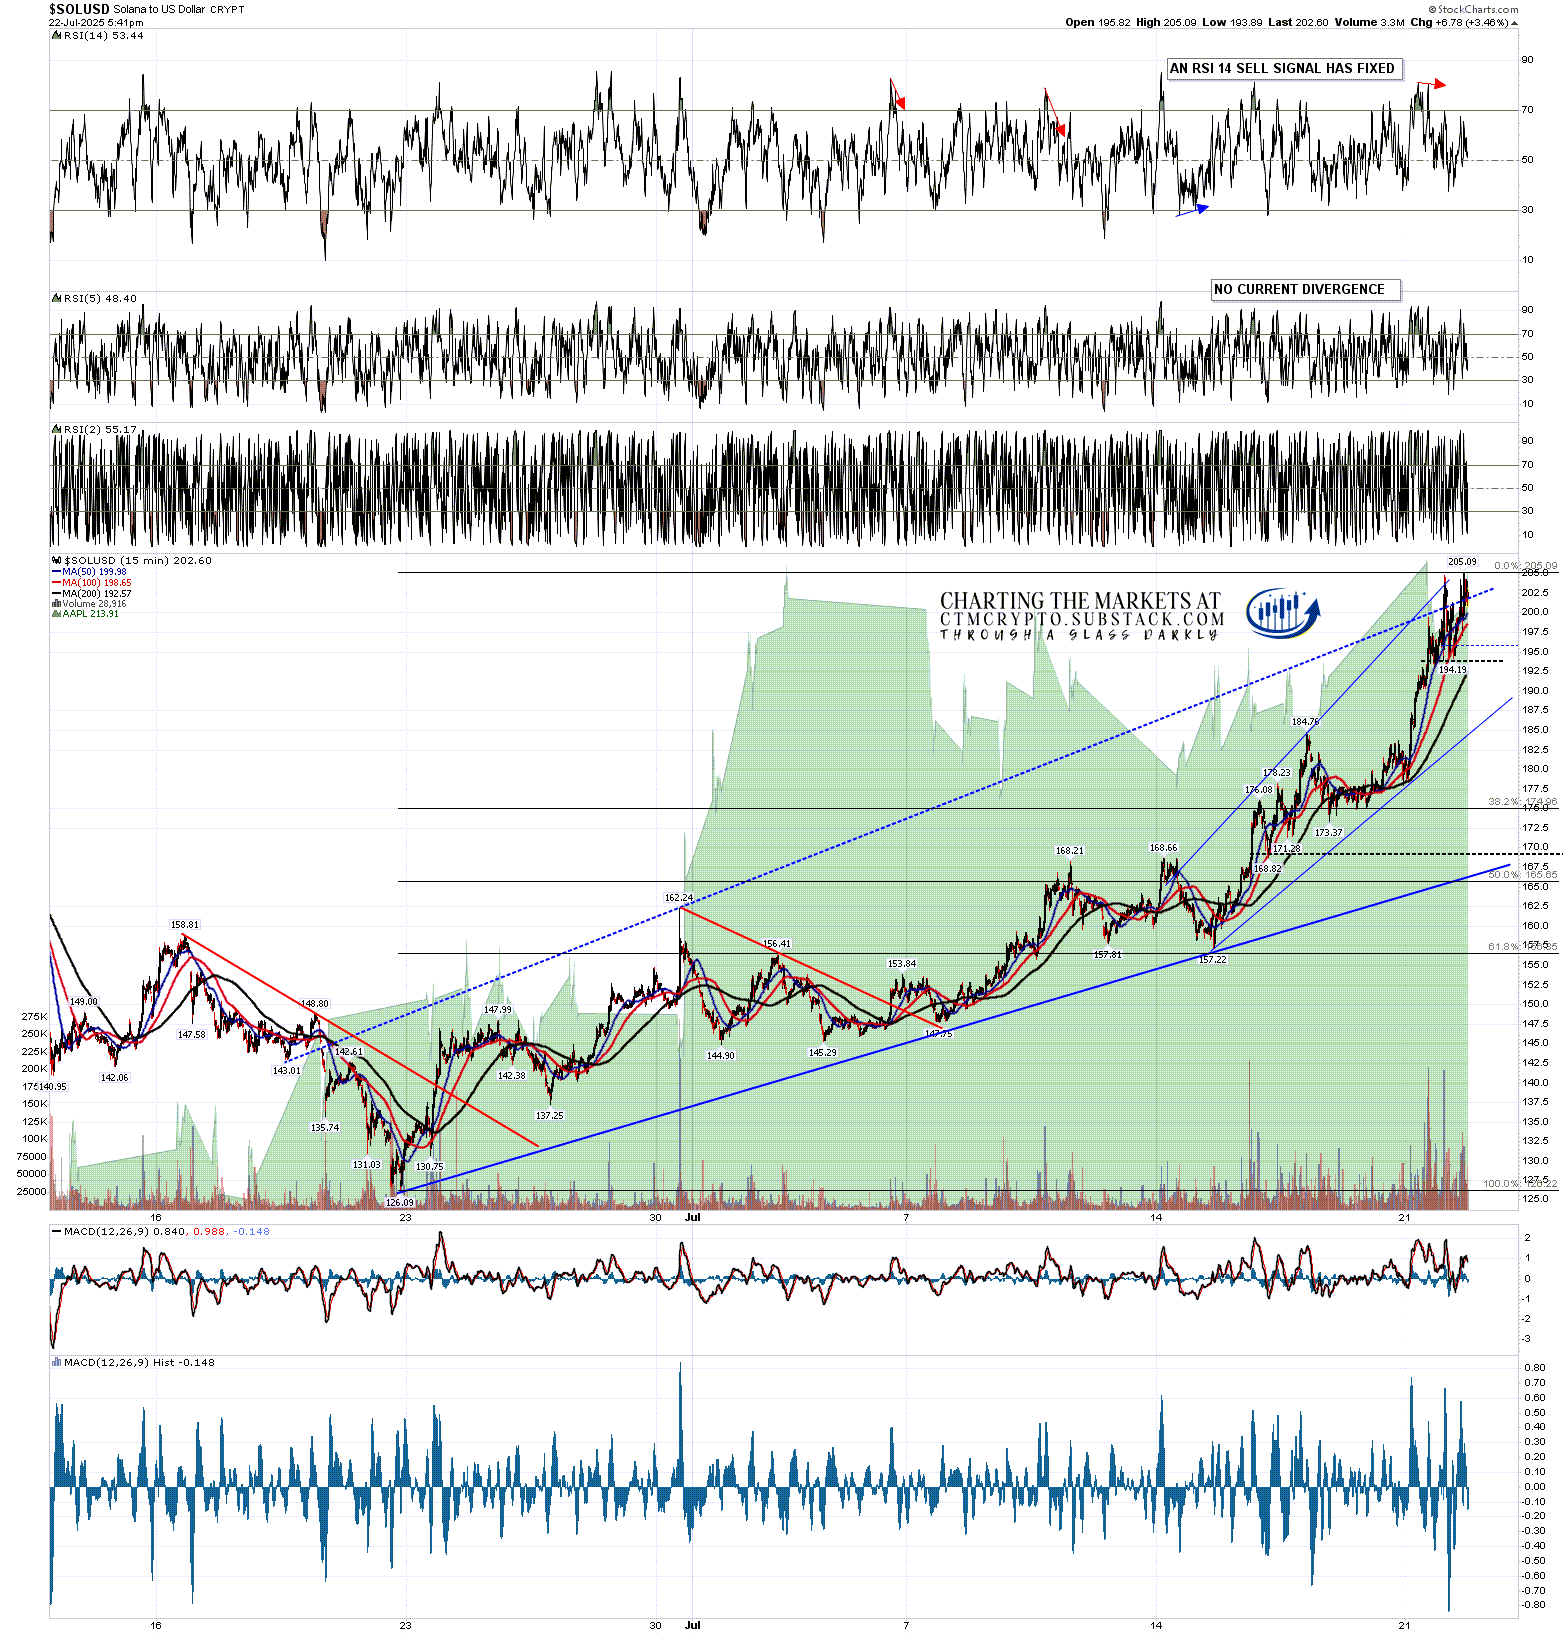
On the Solana 15min chart a possible rising megaphone has formed since the June IHS right shoulder low at 126.09. The megaphone resistance trendline has been slightly overthrown at the current high and a possible small double top has set up which on a sustained break below double top support at 194.19 would have a target in the 183.29 area. Depending on where those days closed that could deliver the first move down in the sequence. I’m watching this with interest.
SOLUSD 15min chart:
I posted the following note at the end of my post on 13th Jan:
My preferred scenario here is that we see a bullish consolidation either now or soon on Crypto that takes a few months and sets up the next big leg up on Crypto into a possible bull market high in late 2025.
I wrote a comment on that in my last post:
We saw the consolidation and the new bull market highs on Bitcoin so far but my concern is that we have seen very little evidence that Crypto can deliver a bullish move while equities are going down, and I am increasingly leaning towards equities topping out here and then very possibly being in a downtrend for the rest of the year. The IHS target on Ethereum here looks doable while equity indices are topping out, but I’m becoming skeptical about seeing the same on Solana. We’ll see.
There is one thing I would add to this though. If Trump imposes heavy tariffs on big trading partners in coming weeks then equities are likely topping out here. On the other hand Trump might TACO again in the face of a negative market reaction, and there is also a key court hearing at the end of July that may rule that all the tariffs Trump has so far imposed or is proposing to impose may be illegal. Nothing is yet fixed and if the uptrend on equities can continue then the next obvious big high on Crypto would be in December.
Since I started doing daily videos on Crypto early last year I’ve got Crypto direction right most of the time and more so than any other analyst anywhere that I’m aware of. I’m a very good analyst and all three of these instruments are very classical chartist friendly. I’m not much of a marketer though, and the free Crypto substack I set up last August still has less than 200 readers. I’d like to increase that readership and invite any suggestions on how I could do that.
If you’d like to see more of these posts and the other Crypto videos and information I post, please subscribe for free to my Crypto substack. I also do a premarket video every day on Crypto at 9.05am EST. If you’d like to see those I post the links every morning on my twitter, and the videos are posted shortly afterwards on my Youtube channel.
I'm also to be found at Arion Partners, though as a student rather than as a teacher. I've been charting Crypto for some years now, but am learning to trade and invest in them directly, and Arion Partners are my guide around a space that might reasonably be compared to the Wild West in one of their rougher years.

No comments:
Post a Comment