
I’ve not done a post on Crypto yet this year, in significant part because I have been a bit dispirited that my previous posts haven’t generated much interest in the Crypto social media sphere, but I’ve still been covering it for subscribers every day and I still really enjoy charting Bitcoin (BTC), Ethereum and Solana. I’m going to start covering these in posts regularly again.
In the short term Bitcoin has done something very interesting, which is a break below the 200 week moving average, something that we saw earlier this year but which has only been seen a few times in the history of Bitcoin, so I’m doing a deep dive on that today.
These research posts tend to be a bit dense, so if you aren’t as interested in the detail as I am you can can move forward past the fourth chart in this post into my takeaways and projection of where a possible serious break below the 200 week moving average (200wma) might take Bitcoin in coming weeks and months.
The first Bitcoin was mined in January 2009 and the first known transaction was in May 2010, so for obvious mathematical reasons the first print of the 200 week moving average (200wma) was towards the end of 2014. Since that time the 200wma has always trended higher, speeding up and slowing down but never reversing.
You can see from the chart below that previous breaks below have been rare and short lived. The analyst who created this chart below posted it yesterday with the comment that Bitcoin has only been below the 200 wma for 8.4% of its lifetime, and that the average return on Bitcoin during these periods was +120% after one year, and +582% after three years, which I haven’t checked but looks about right based on the very limited sample of breaks available.
BTCUSD 200 wma lifetime chart (log scale):
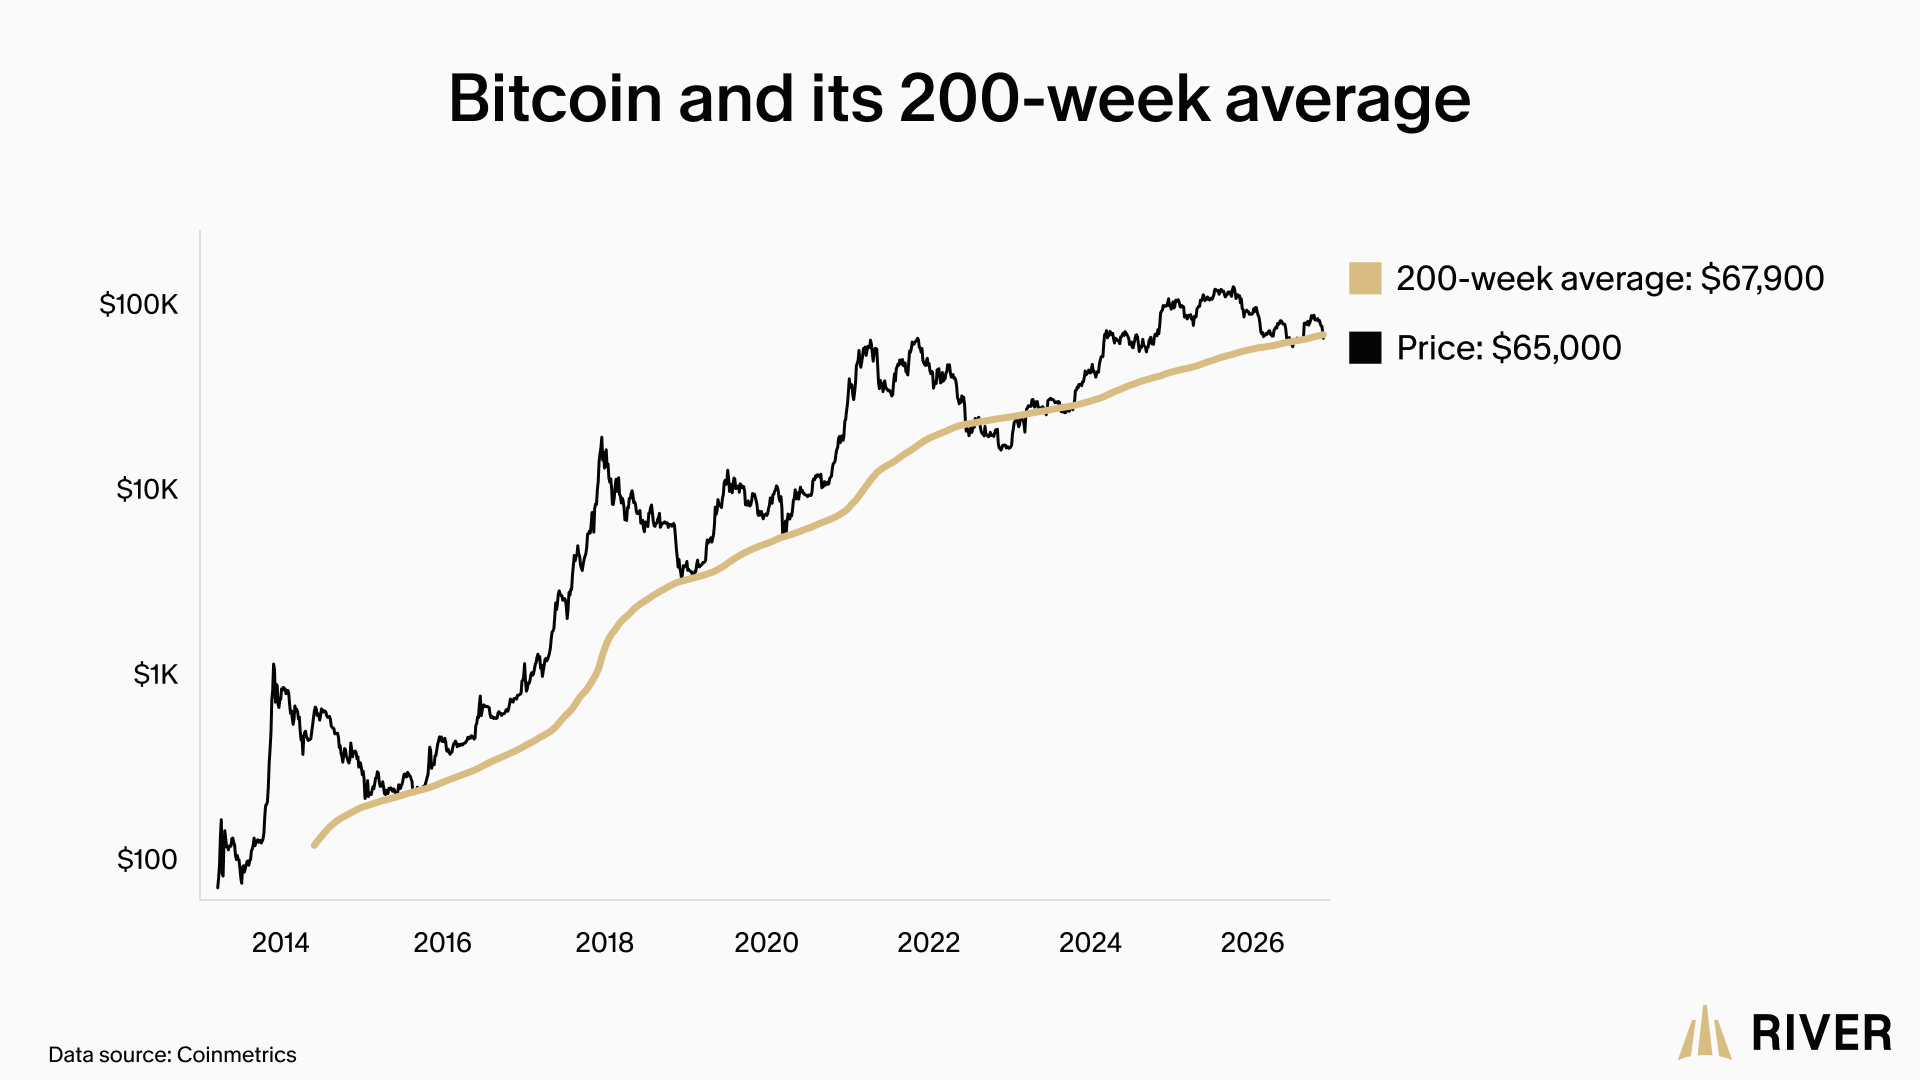
There were three weekly closing breaks below the 200 week MA in 2015. The week ending (W/E) 29th Aug closed $2 below the 200wma at $230, before recovering back over it and then in the W/E 19th Sep closed $3 below at $232, closing a second time below by $1 in the next W/E 26th Sept $1. The second and third breaks were technically a break below with a second confirming close below the following week but BTCUSD broke back above the week after that and didn’t test the 200wma again until late 2018. After from the bear market lows in 2022 this was the only time that Bitcoin has ever closed below the 200wma for two consecutive weeks.
The chart below has the 200 wma starting in 2018, as my stockcharts data only goes back to 2014, and I’ve added the NDX price level as the green background for comparison as there is a significant correlation between declines on NDX and lows on Bitcoin that I’d also like to look at today.
BTCUSD weekly chart vs NDX late 2014 - date (log scale):
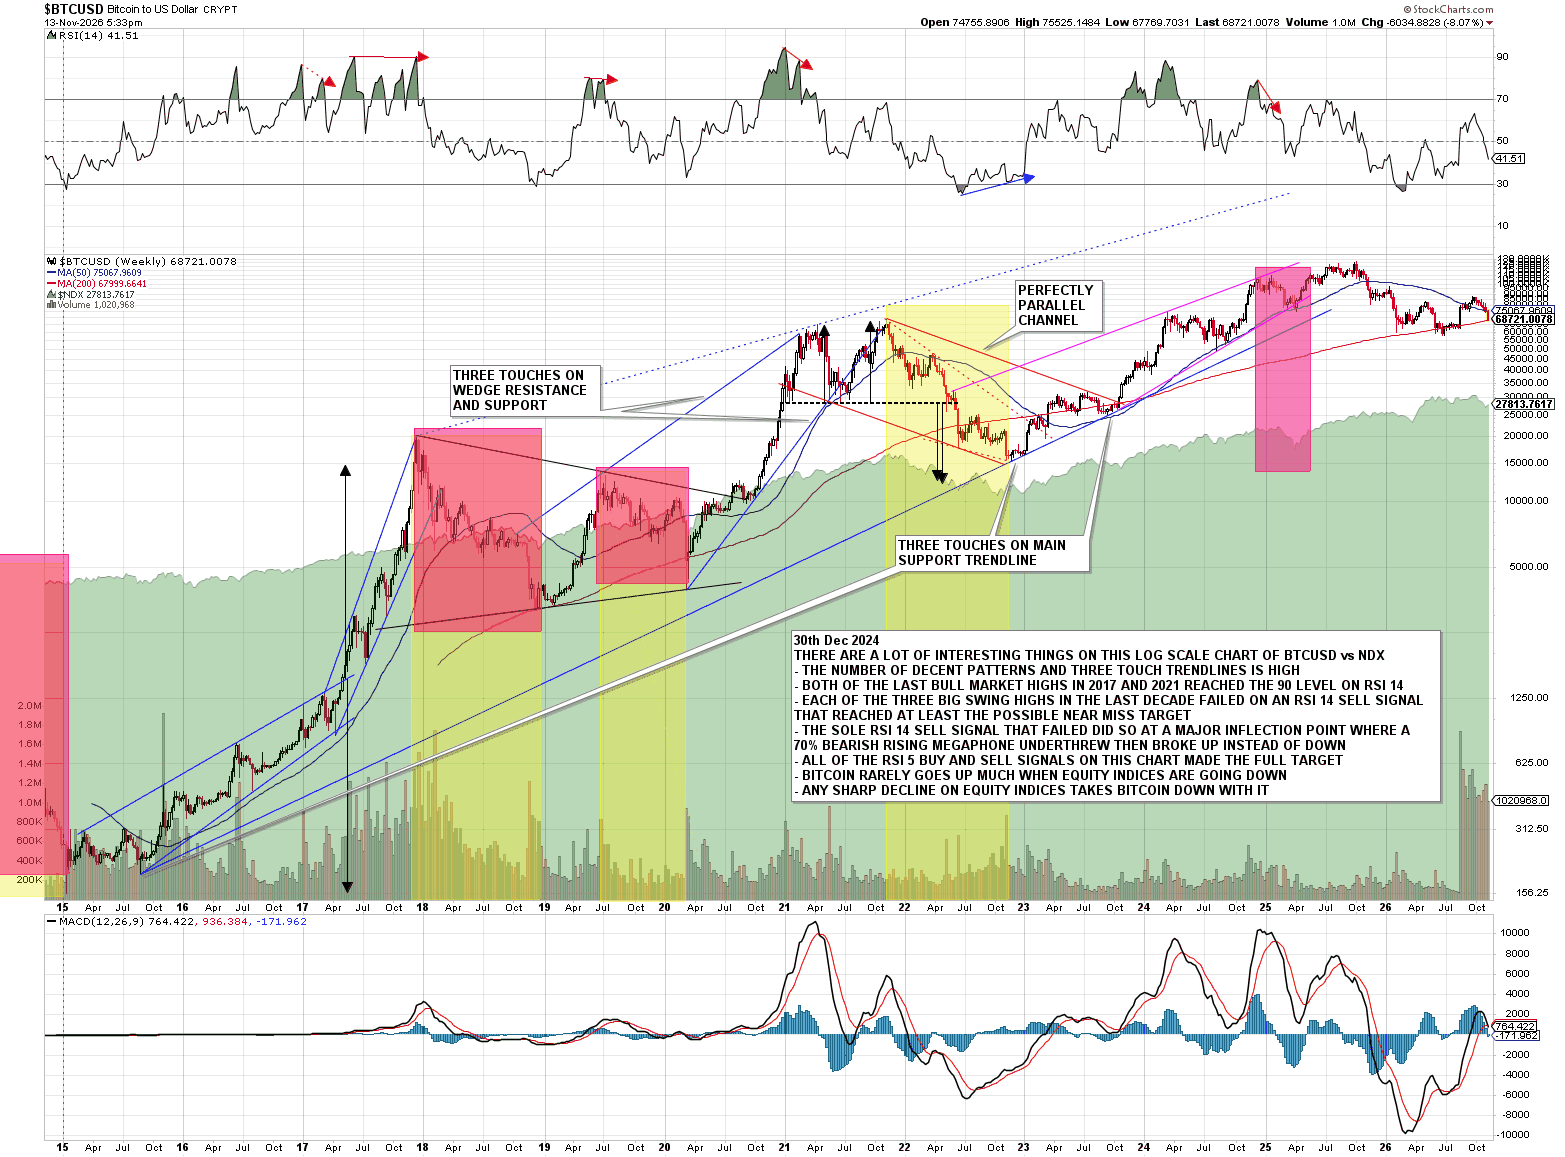
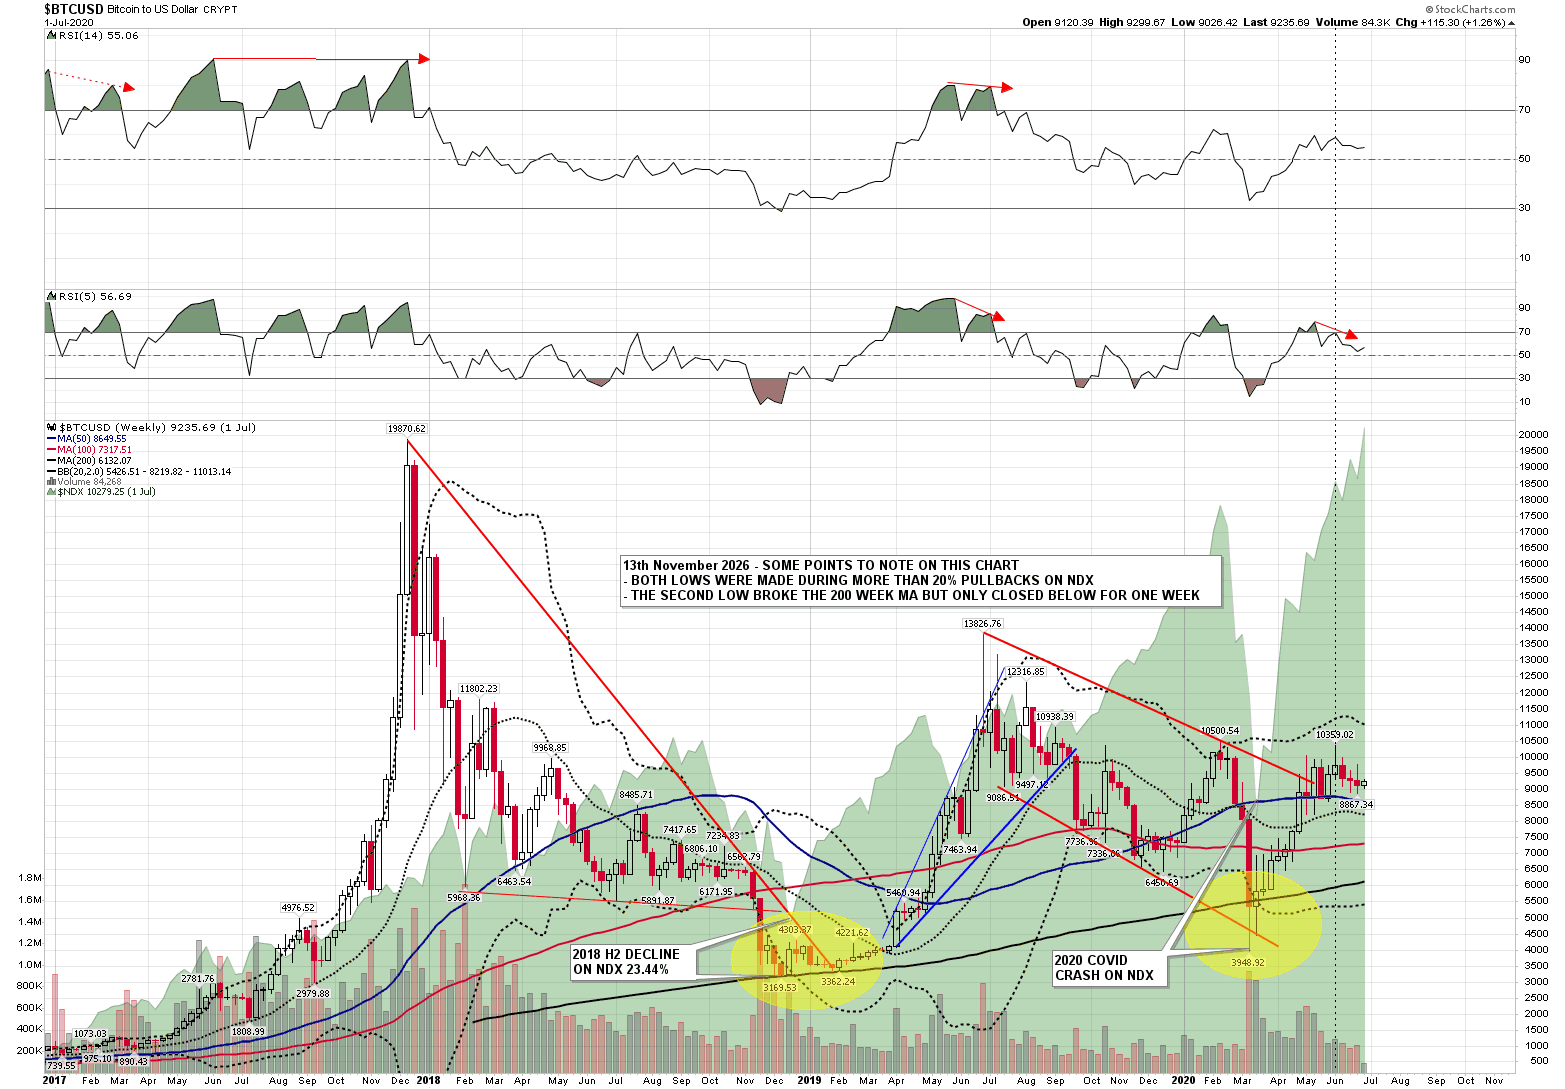
Drilling down I’m looking at the Jan 2017 through June 2020 chart first, as I’d rather look at these on standard rather than log scale.
The next test of the 200dma was in late 2018 at the bear market low, with three weeks testing the 200wma in the last few weeks of 2018 as NDX was completing a 23.44% decline. The bear market low on BTCUSD was made the week before the swing low on NDX. In early 2019 there was another two week 200wma test before the main move up began. There were no weekly closes below the 200wma in this period.
After that low Bitcoin quadrupled into June 2019 and then dropped two thirds into a low at 2020. The main part of that decline was during the 2020 COVID crash, with Bitcoin dropping over 60% into the low just before the crash low on NDX. The BTCUSD 200wma was broken slightly (weekly closing basis) for one week at the low with a recovery back above the following week.
BTCUSD weekly chart vs NDX 2017 through June 2020 (standard scale):
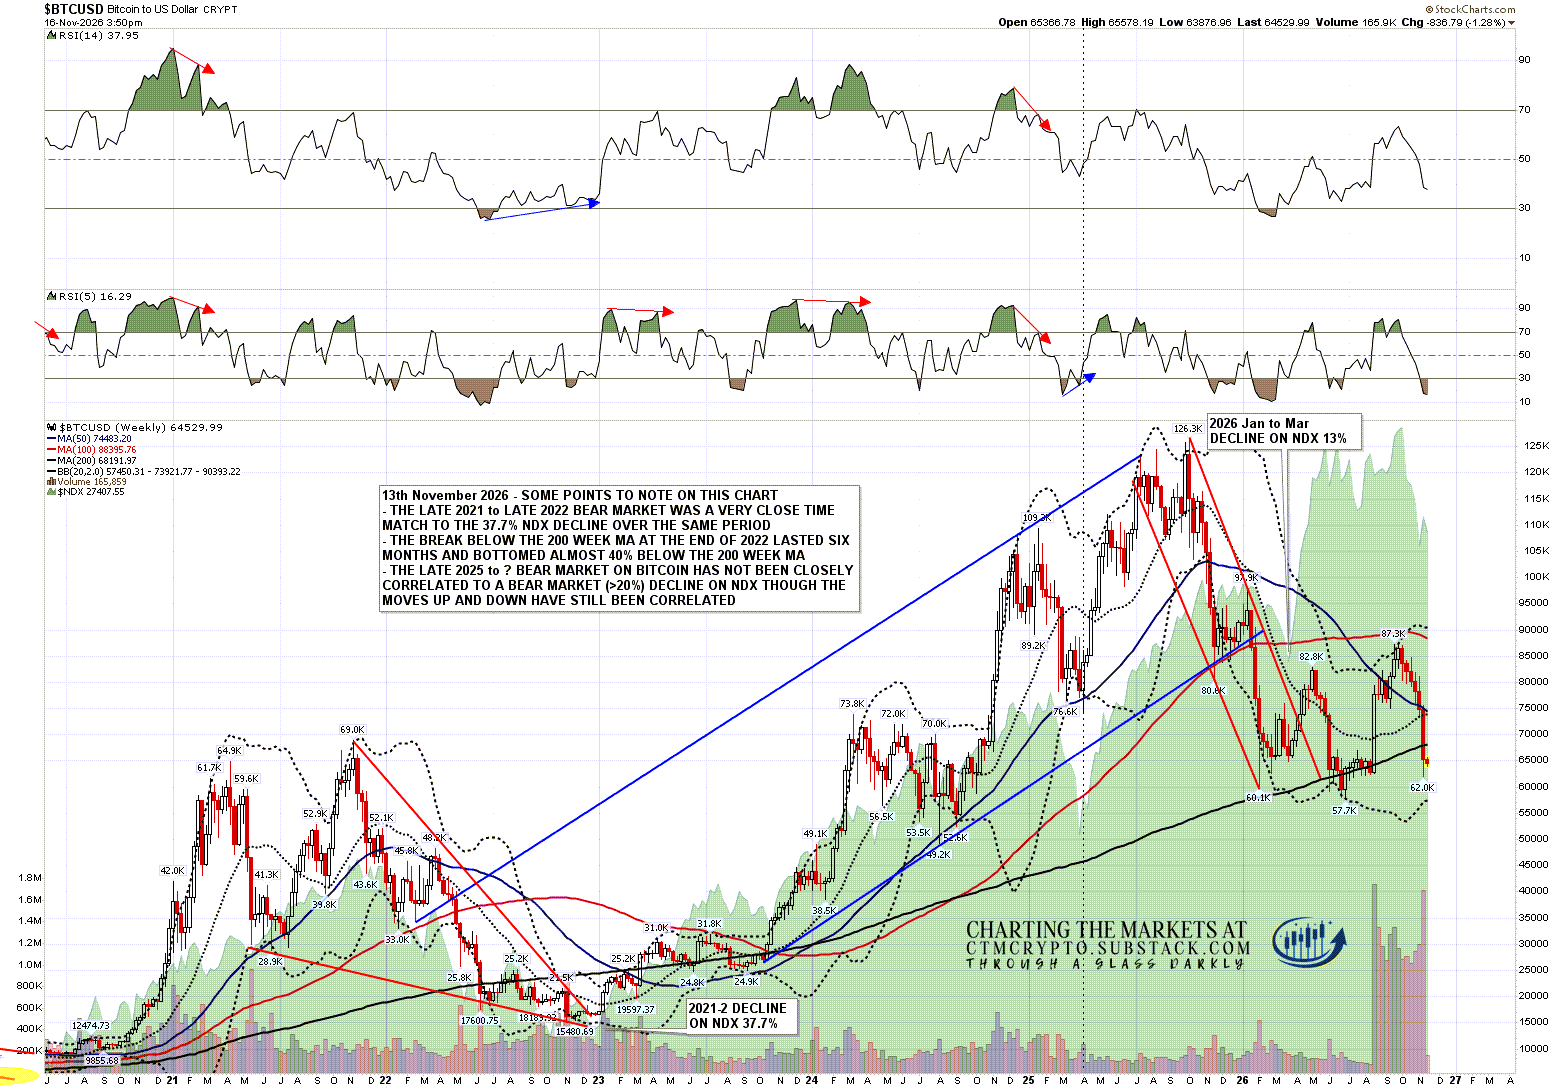
The BTCUSD bull market topped out in 2021 and the bear market into late 2022 was very strongly correlated with the next technical bear market (more than 20% decline) on NDX, both starting in late 2021 and ending in late 2022. NDX fell 37.7% while Bitcoin fell over 75%.
Into that low the only serious break below the 200wma in Bitcoin’s history was made, with a break below that lasted six weeks from June 2022, then an attempt to break back above it for four weeks over Jul/Aug as NDX was rallying, and then a break back below that lasted twenty three weeks until the end of Feb 2023 when there was a strong break above. The bear market low on Bitcoin in 2022, as both Bitcoin and NDX were bottoming out on their respective bear markets, was about 45.5% below the 200wma. The 200wma was then briefly backtested again as support in Sept 2023 before the main move up in the last bull market on Bitcoin that peaked at 126.3k in late 2025. That move was again strongly correlated with NDX.
Bitcoin and NDX both made highs in October 2025. NDX then declined a relatively modest 12.3% into March 2026 as Bitcoin fell over 50%. NDX made a swing low there as Bitcoin started a strong rally into 82.8k in May, and then bottomed at 57.7k in late June as NDX finished a short 8.3% decline, with Bitcoin testing the 200wma for twelve weeks with two separated closes for just one week below at that low and then eight weeks later just before a strong rally began.
Bitcoin then made the rally high in late September with NDX making a new all time high in October, since when they have both fallen sharply. At this low Bitcoin closed well below the 200wma last week and NDX made a new retracement low this morning.
BTCUSD weekly chart vs NDX July 2020 to date (standard scale):
OK, that was a lot of data so where am I going with this? Well there are several important points I would make here:
The 200wma on Bitcoin is very strong support and has only ever been broken once in history for more than two consecutive weeks, apart from the extended break below at the Bitcoin & NDX bear market lows in late 2022.
When Bitcoin was broken for more than two weeks in 2022, it broke down hard for more than six months into a bear market low 45.5% below the 200wma.
Bitcoin has been increasingly strongly correlated with strong downside moves in NDX over the last decade, and since 2018 all major lows on Bitcoin have been made during a significant decline on NDX.
NDX is currently down, as of the low this morning, over 15% from the October high, and I have a high quality double top there that has already broken down and is looking for a retest of the late March 2026 low. If that target is reached, then that would be a decline of about 27.5% from the October high. If seen, that decline on NDX might not stop there, particularly as there is a possible much larger H&S neckline in that target area.
If NDX heads much lower directly from here, as currently seems very possible, then Bitcoin will likely go with it and, if so, we would be starting here a second (ever) multi-month break below the Bitcoin 200wma.
As I write the Bitcoin 200wma is at 68188, and if we were to assume that was in the 69k area at the bear market low, and if that low was at the same 45.5% below the 200wma, that would give a target in the 37.6k area.
Are there any targets in that area? Well as it happens ….
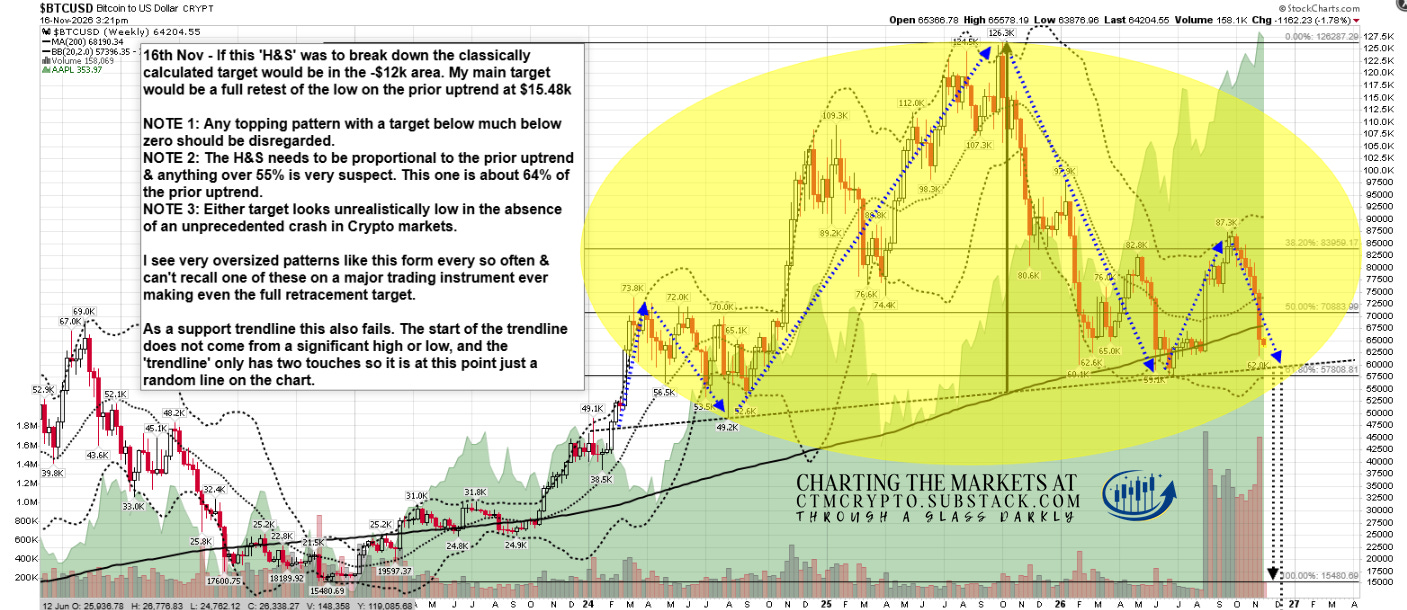
I was looking at a possible big H&S setup that someone posted yesterday and drew and posted in reply a chart to illustrate why it wasn’t a valid pattern. There were several good reasons for that, all listed on the chart below:
BTCUSD weekly chart (H&S version invalid):
Have I changed my mind about the above H&S? No, but there is a valid alternative in the chart below that is a serious contender.
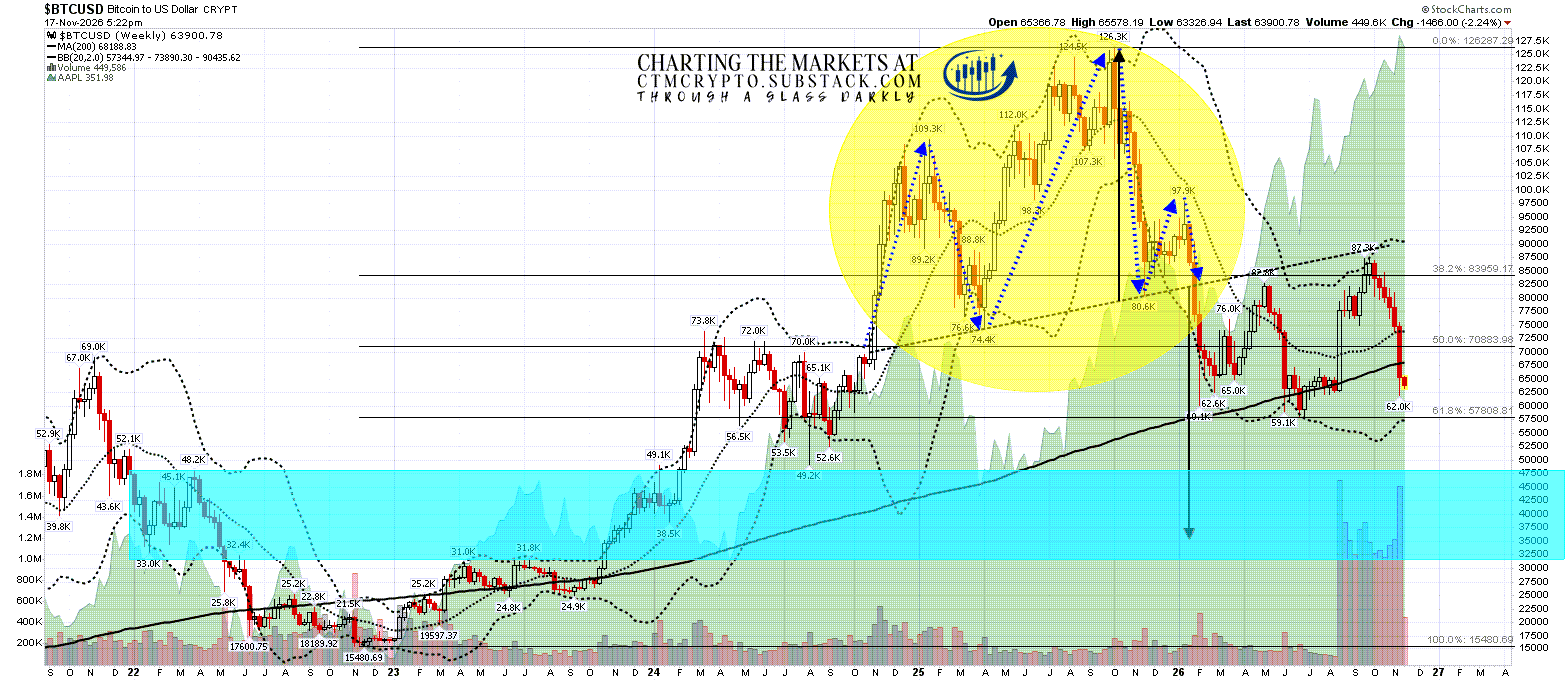
This H&S looks a little odd but is perfectly valid. The neckline is sloping up, the left and right shoulders are acceptably balanced, and it broke down in early 2026 with a target in the 35k area. Relative to the 200wma that would be a little lower than the 2022 low but not unduly so, and I’d be looking for the bear market low in that area.
How would this look relative to previous bear markets on Bitcoin?
2017-8 Bear Market - 84% decline
2019-20 Bear Market - 71% decline
2021-2 Bear Market - 77.5% decline
If this bear market was to bottom out in the 35k area then this decline would be in the 72.2% area, which would be a strong match.
A low in the 35k area would also be in a decent support zone in the 31k to 48k range that I have highlighted in blue on the chart below.
BTCUSD weekly chart (H&S version valid):
This scenario only really works if NDX & Tech generally continue to at minimum struggle over the next few weeks, with periodic sharp declines, and works best if we start seeing strong declines on NDX directly from here. There is a strong setup for NDX to go a lot lower here and it isn’t currently showing any real signs of strength so we may well see that.
If we do see that big decline on NDX that could mean that the likely bubble on AI/Tech has topped out, and we might then see a decline on NDX that lasts a couple of years, but I’d still be looking for that low on Bitcoin in the 35k area as a break much below would be unprecedented on Bitcoin historically. I would note though of course that unprecedented things are only unprecedented until they happen.
If you like this post please retweet and/or share it if you can as I’m trying to improve my visibility in the Crypto social media sphere.
If you’d like to see more of these posts please subscribe for free to my Crypto substack. I also do a premarket video every day (except tomorrow at 8.00am) on Crypto at 8.30am EST with morning charts for paying subscribers. All the videos I record are posted shortly after a delay of three days on my Youtube channel, and every post I publish is linked on my twitter.


No comments:
Post a Comment