- WE'RE JUST RANDOM SPECKS OF DUST IN A TORNADO TO THE MARKETS .......
- CHARTISTS MUST PUT ALL BIAS ASIDE AND LET THE CHARTS DO THE TALKING OR WE'LL SEE ONLY WHAT WE WANT TO SEE
- This blog has a copy of all header posts that I publish anywhere, so that those interested in seeing what my thoughts are on the markets can find them easily.
- I will be answering questions and responding to comments, so feel free to respond to any posts and I will see your comment even if it is not on the most recent post.
- If you're interested in seeing any intraday charts I post, I do that on twitter, and my twitter handle is @shjackcharts.
- The charts in the posts are as large as I can practically make them. if you would like to look at one more closely, click on it, and the link will take you to a larger version at screencast. If you click on that again, you will get a full page version, and can use the resizing function on your browser to enlarge parts of interest further.

Monday, 31 March 2025

Downside Targets Update

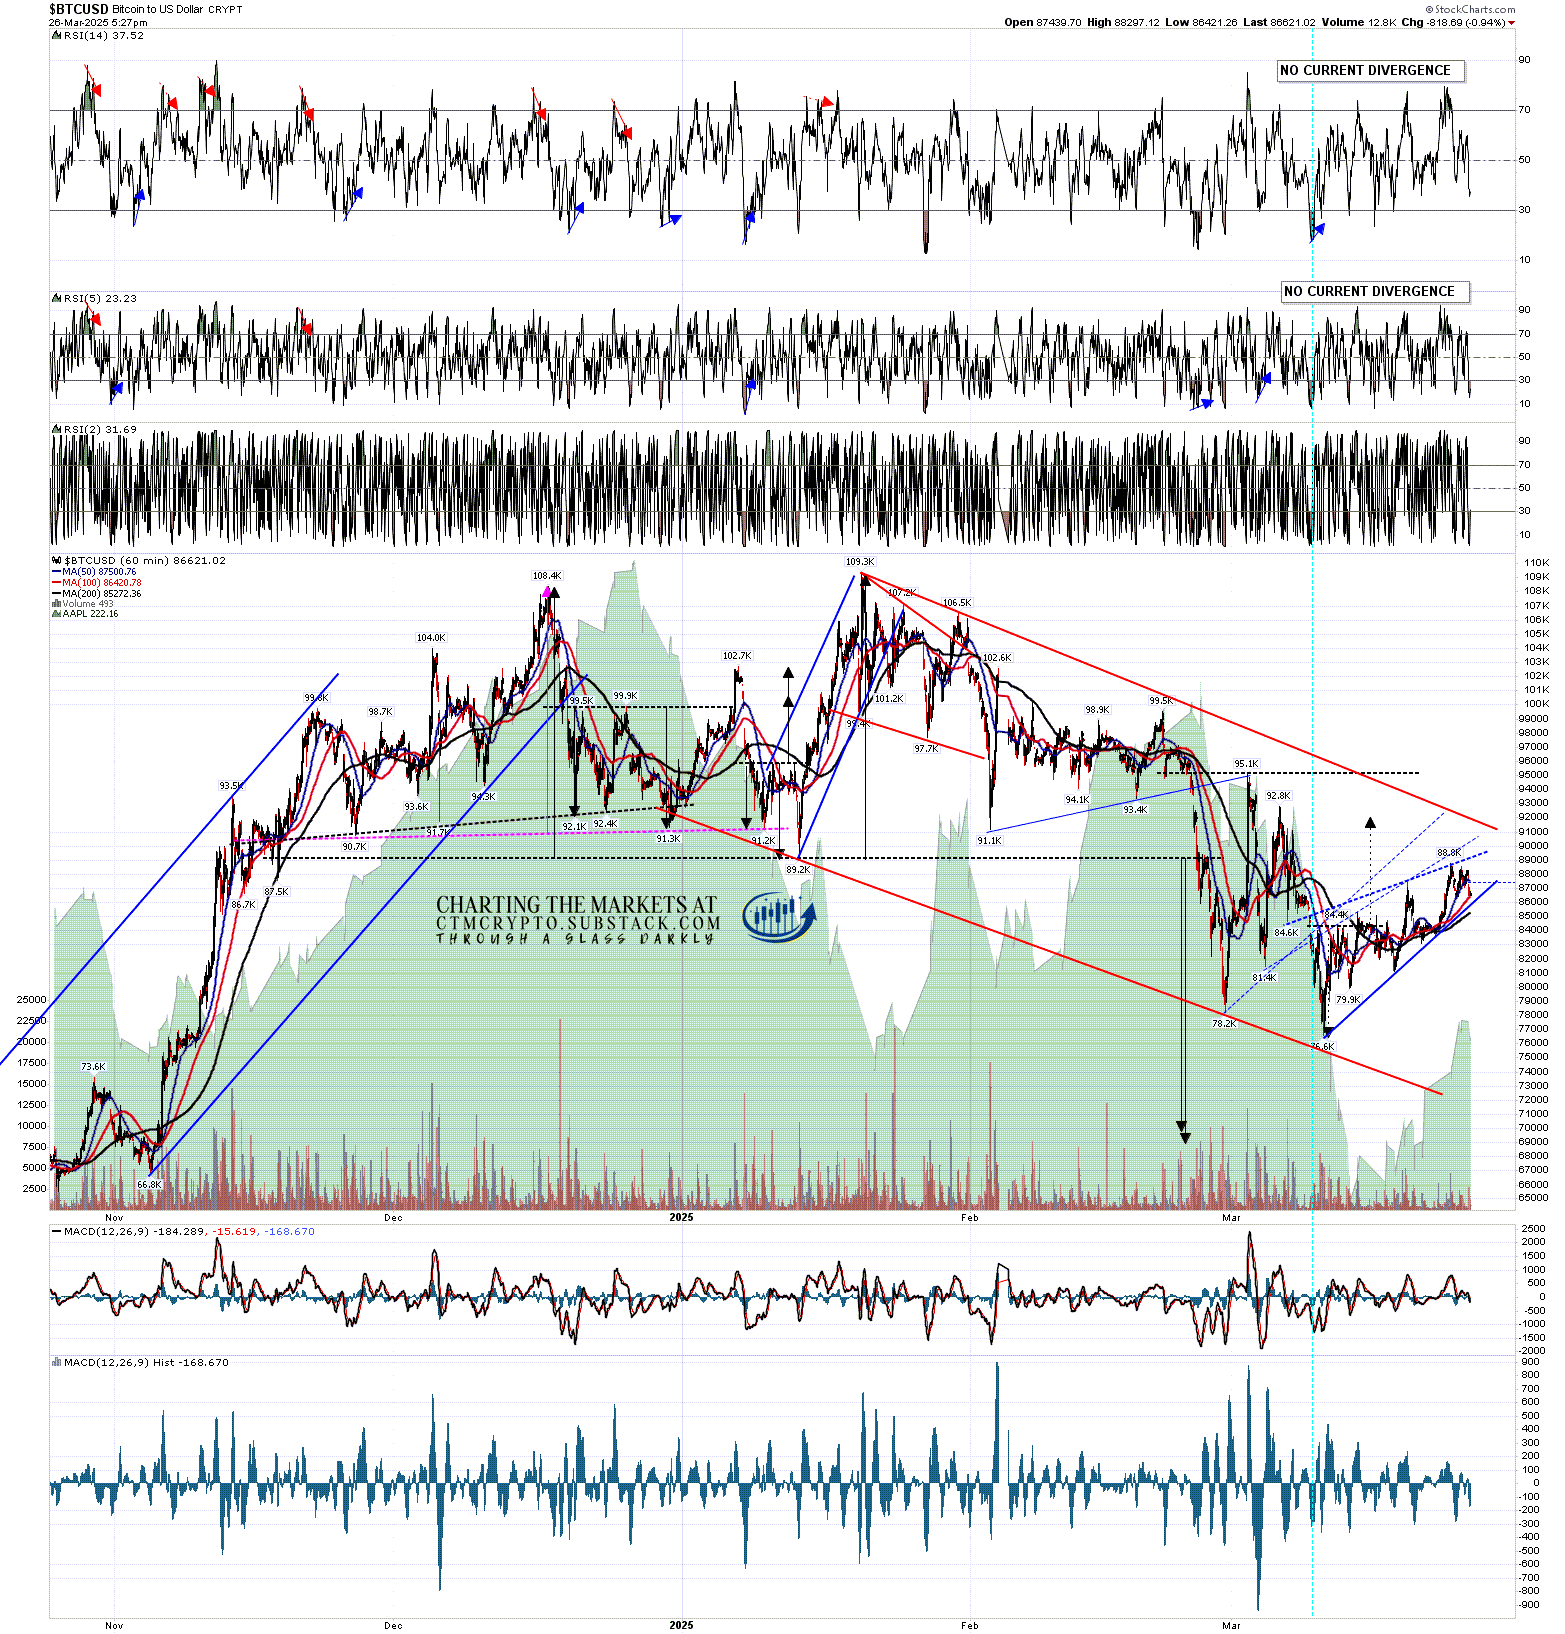
Two weeks ago today I wrote a post looking at the case for a rally on US equity indices in the 12 trading day window into April 2nd, the planned day for US tariffs to be extended to most US trade partners. That rally delivered but wasn’t quite as strong as I hoped then, and I wrote another post a week ago in which I was looking at the bear flags forming on the US indices and talking about those moves topping out on Tuesday or Wednesday last week. On Wednesday morning I wrote a third post calling a likely high within those bear flag patterns and sketching out in arrows my preferred path from there.

That path was looking good but my hoped for high retest failed on the bad inflation numbers on Friday and this morning the bear flag targets at the retests of the 2025 lows on SPX, QQQ and IWM were hit. The bear flag target at the retest of the 2025 low on DIA is still outstanding but likely gets hit after the current oversold rally on the US indices ends.

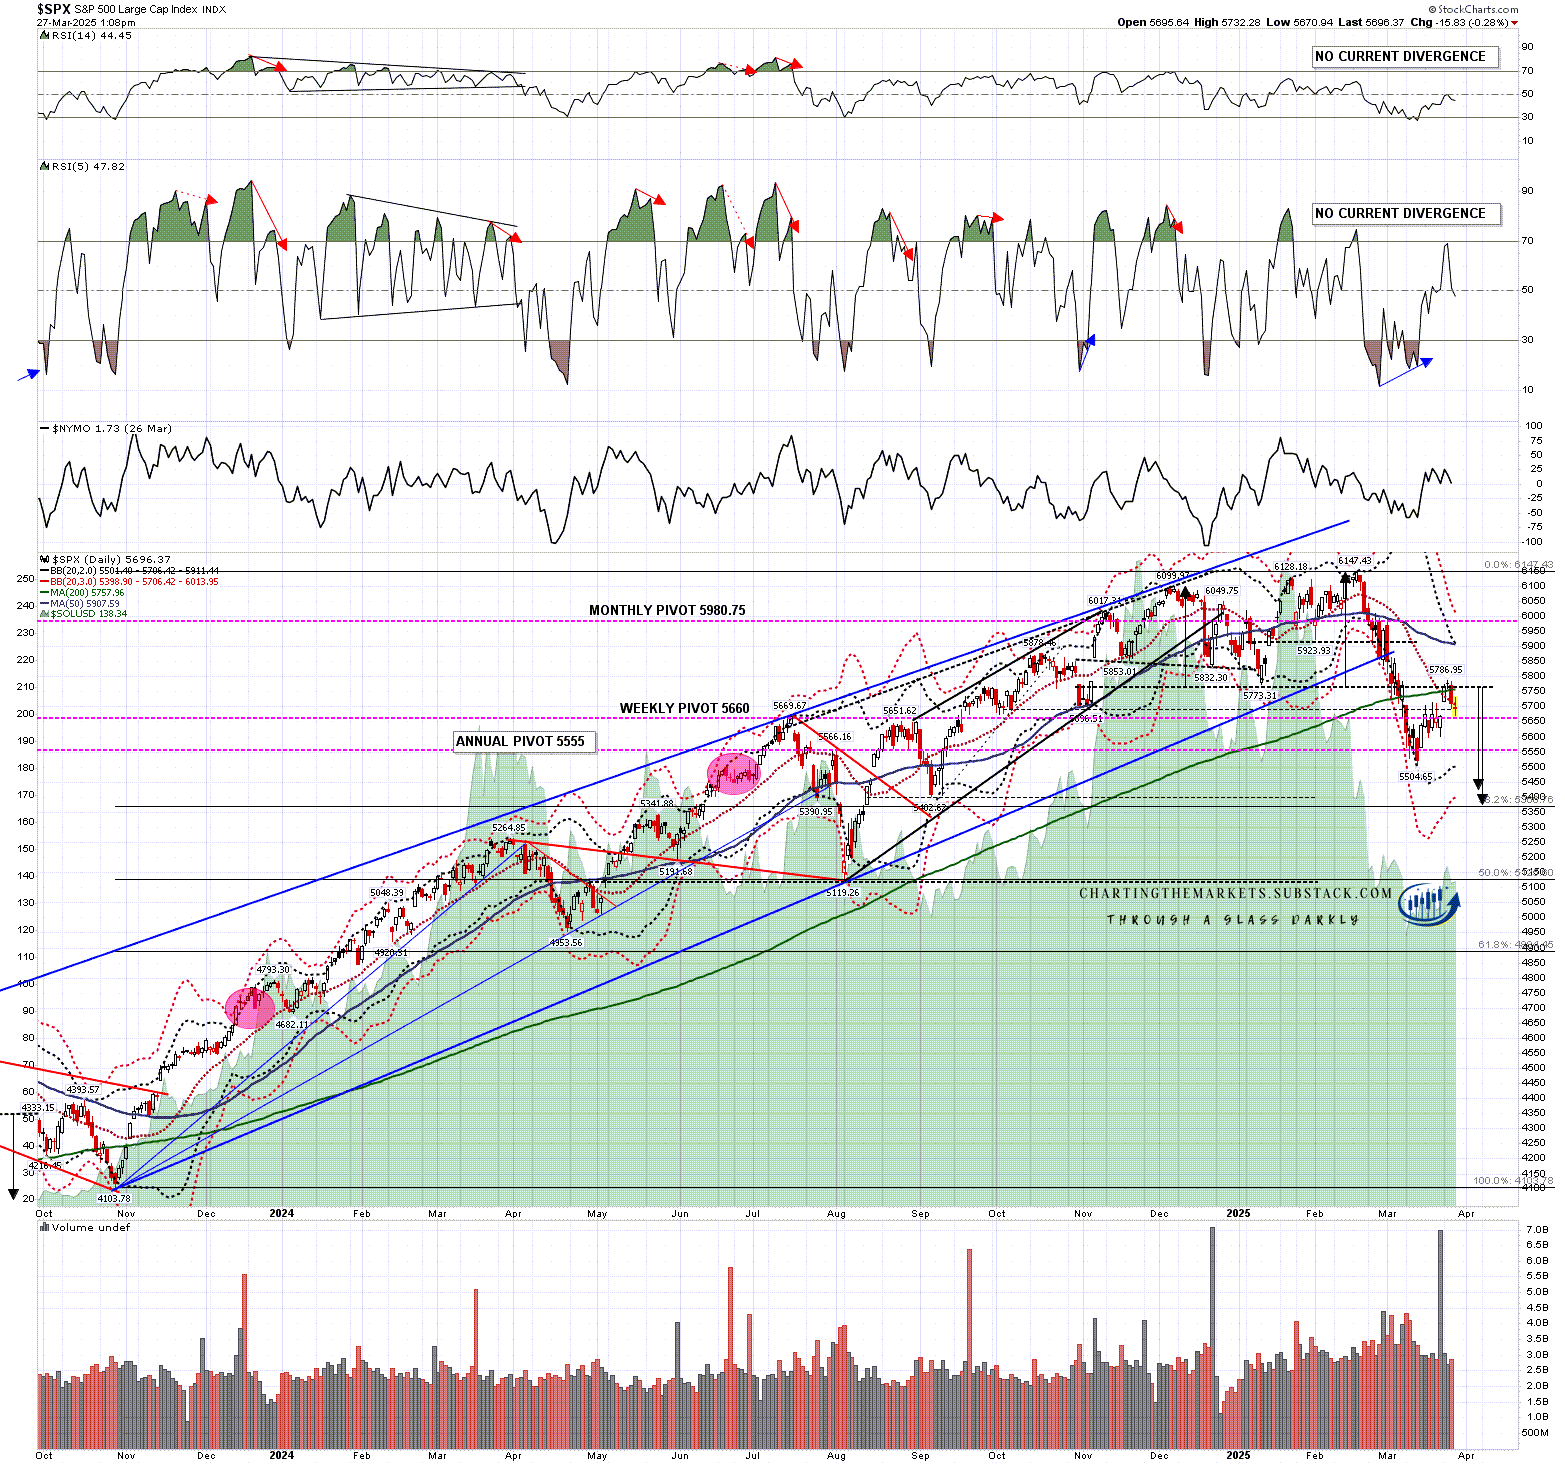
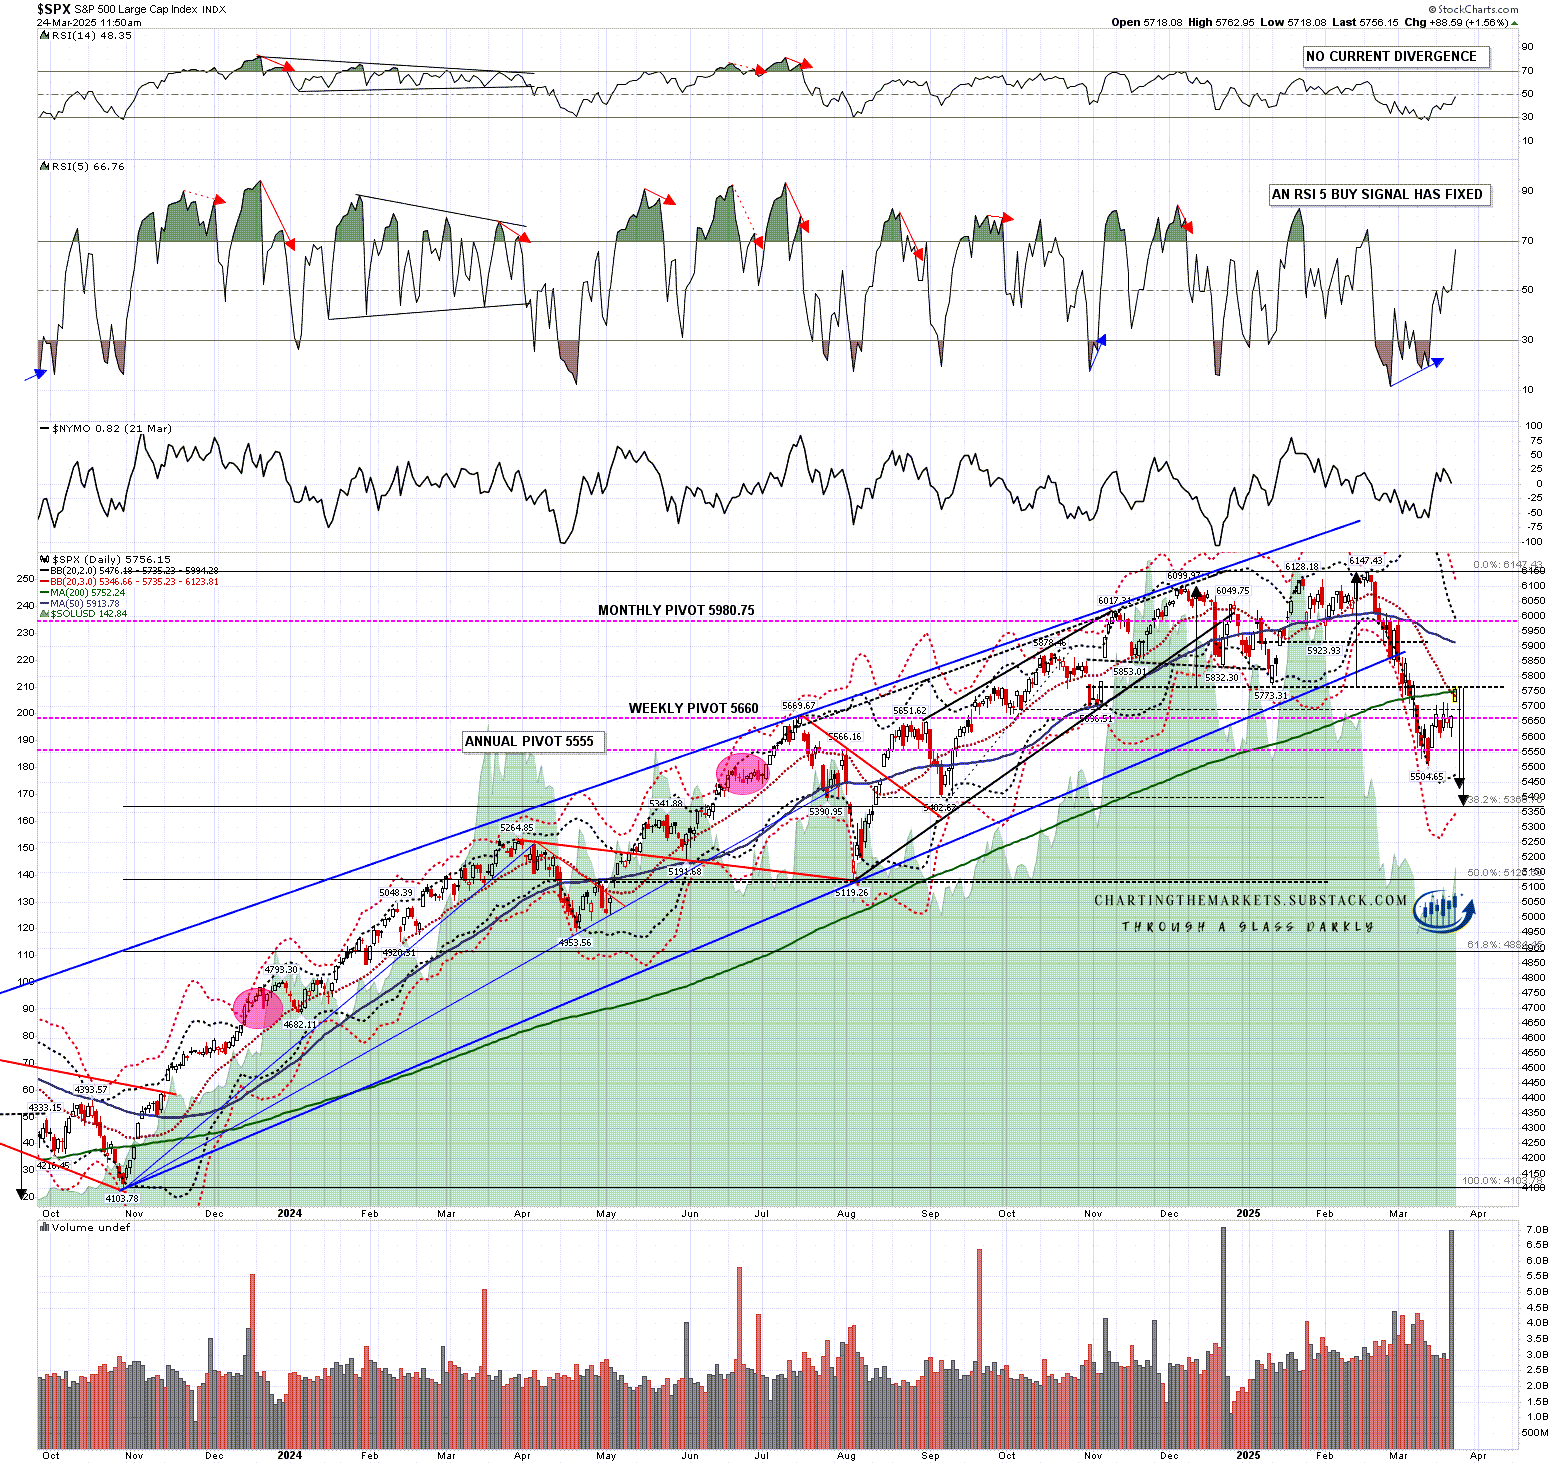
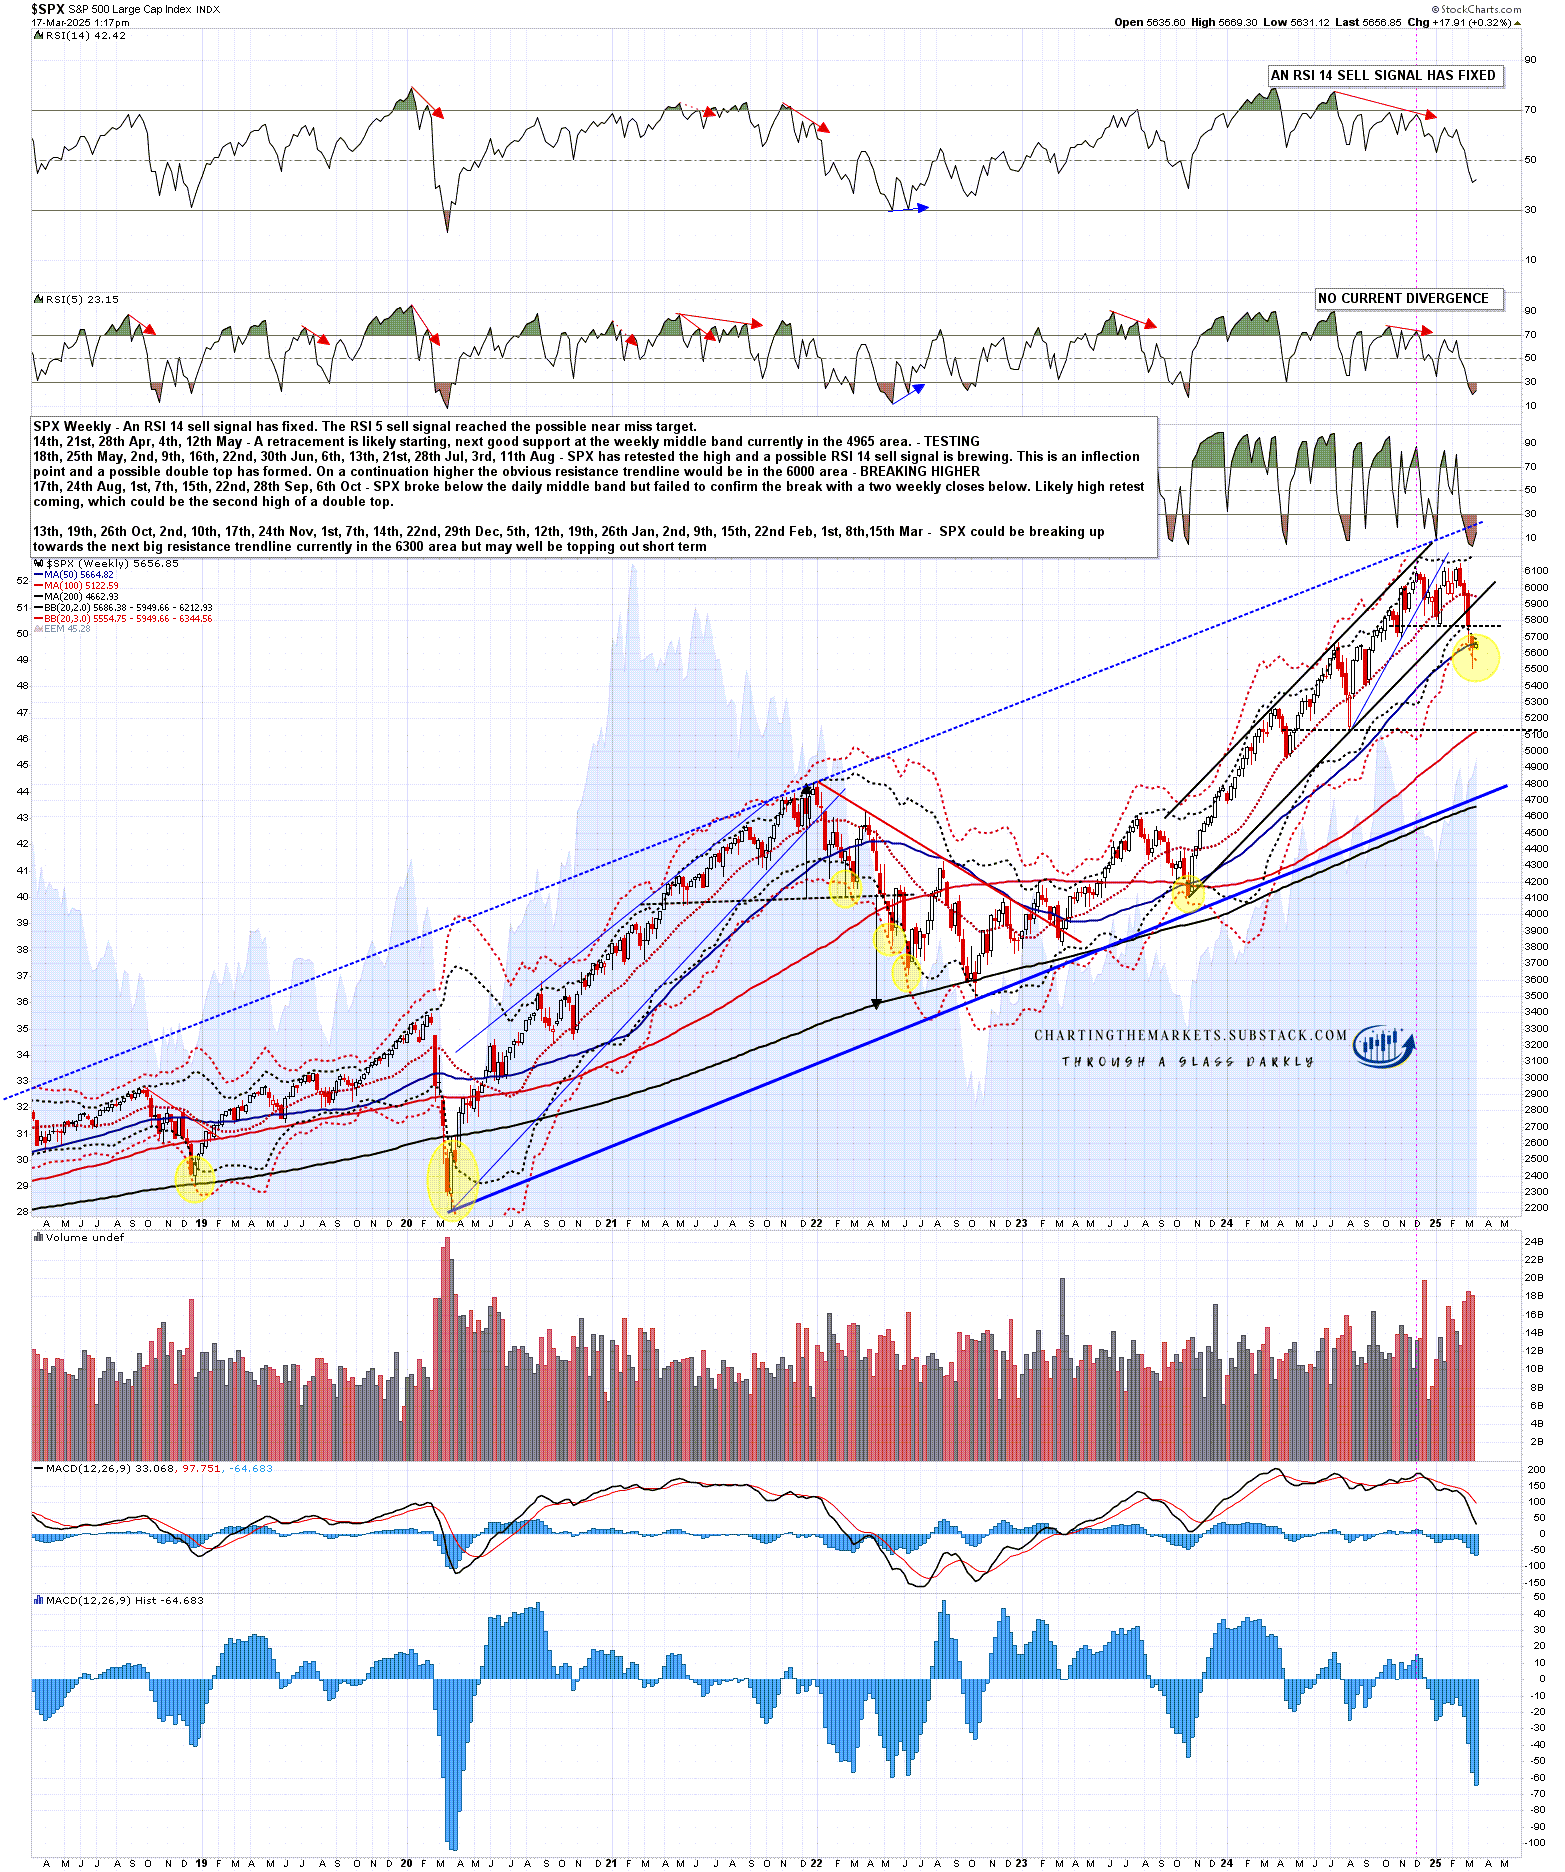
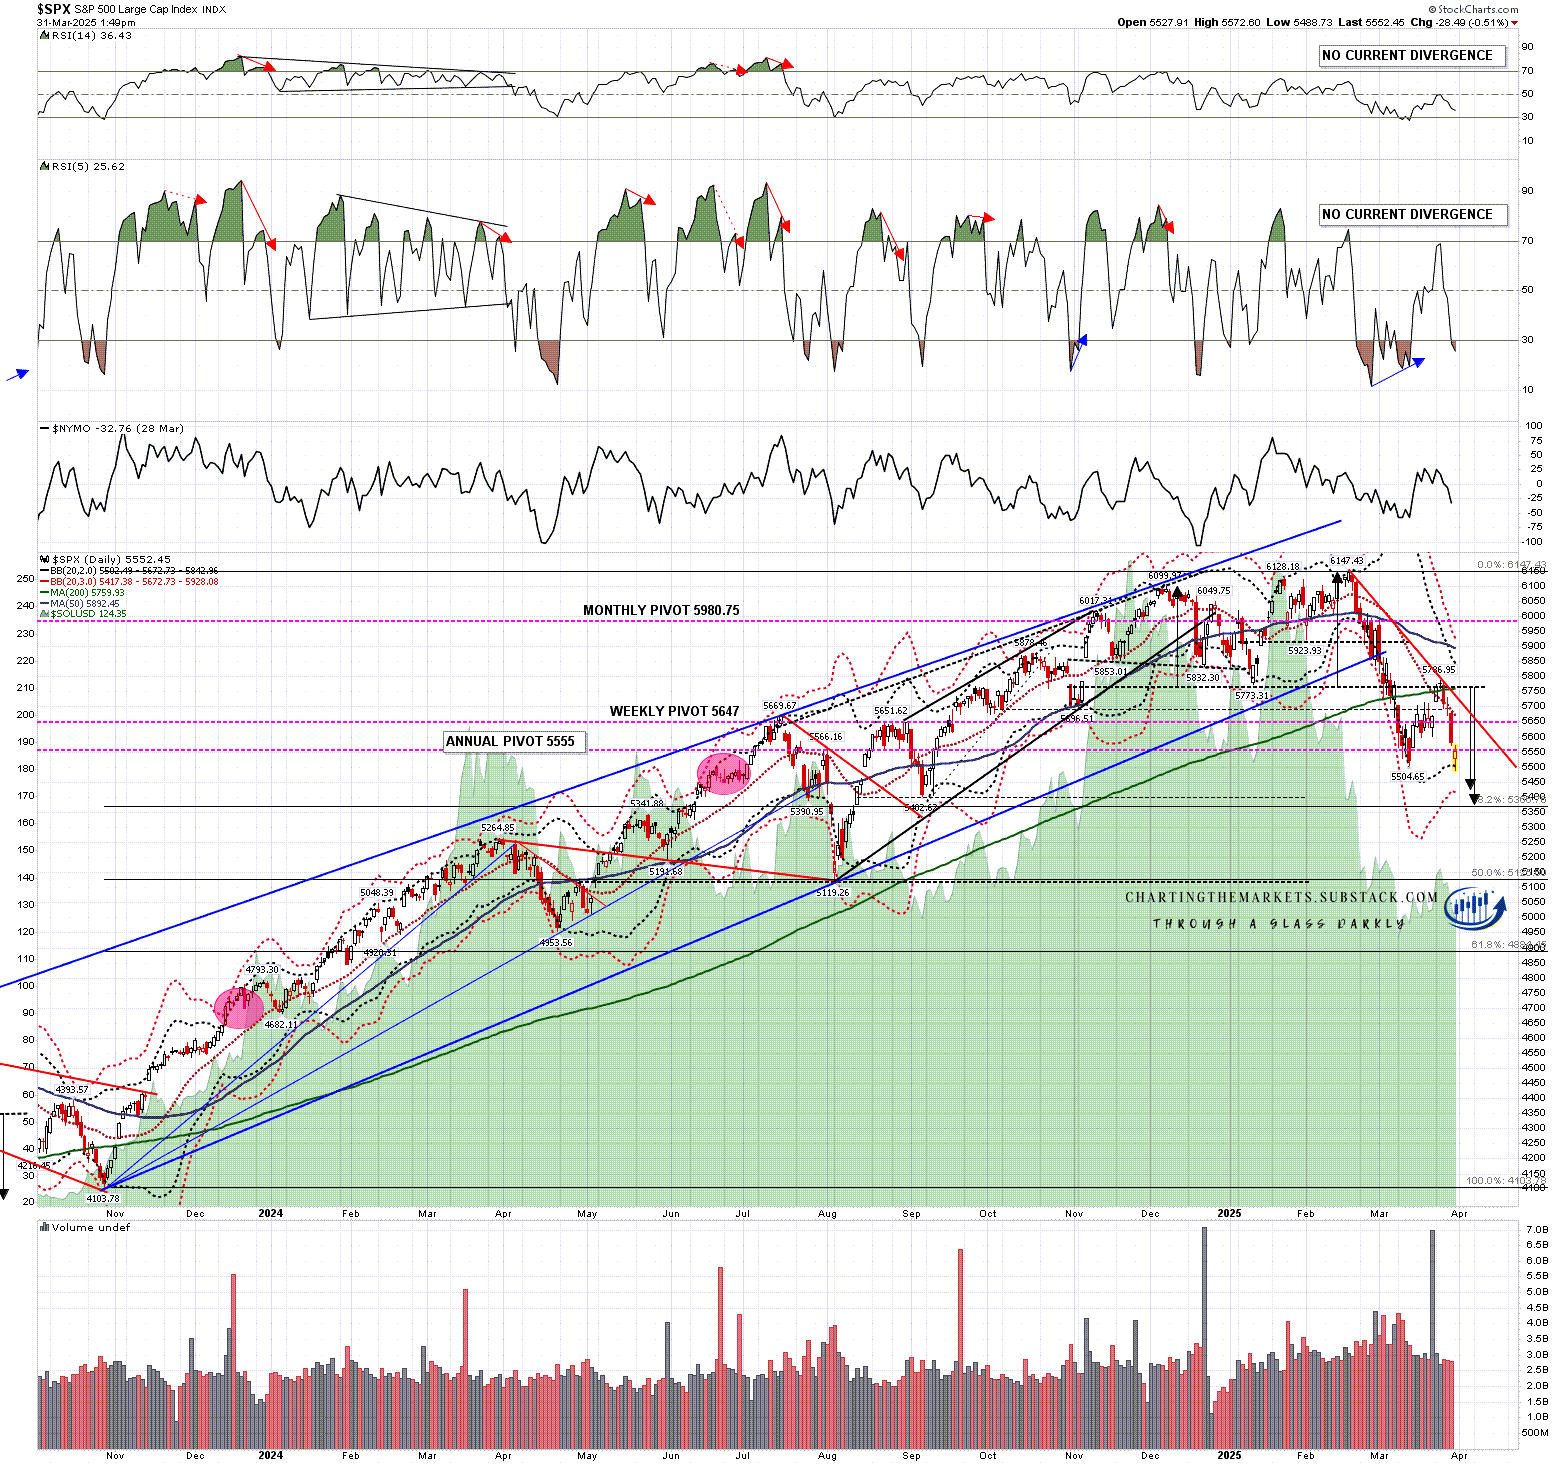
First the daily chart where the support at the daily middle bands on all of SPX, QQQ, IWM and DIA were broken very hard on Friday. I would note that the daily middle bands have been compressing over the last two weeks and that this setup where there has been a strong thrust down, followed by a bear flag that has broken down, has two main options.

The first option is the start of another leg down, and it is my working assumption that will happen next. If that leg was to be as long as the first leg then the target would be in the 5143 area. That is a very important area and may well be the next big target. I have the 50% retracement of the rising wedge from October 2023 in the 5125 area and a possible large H&S neckline at 5119.26.

The second option is to make a short term low here, and these low retests have set up possible double bottoms that I’ll be looking at. They may deliver if there is good news in the next couple of days and are worth considering as a possibility here.
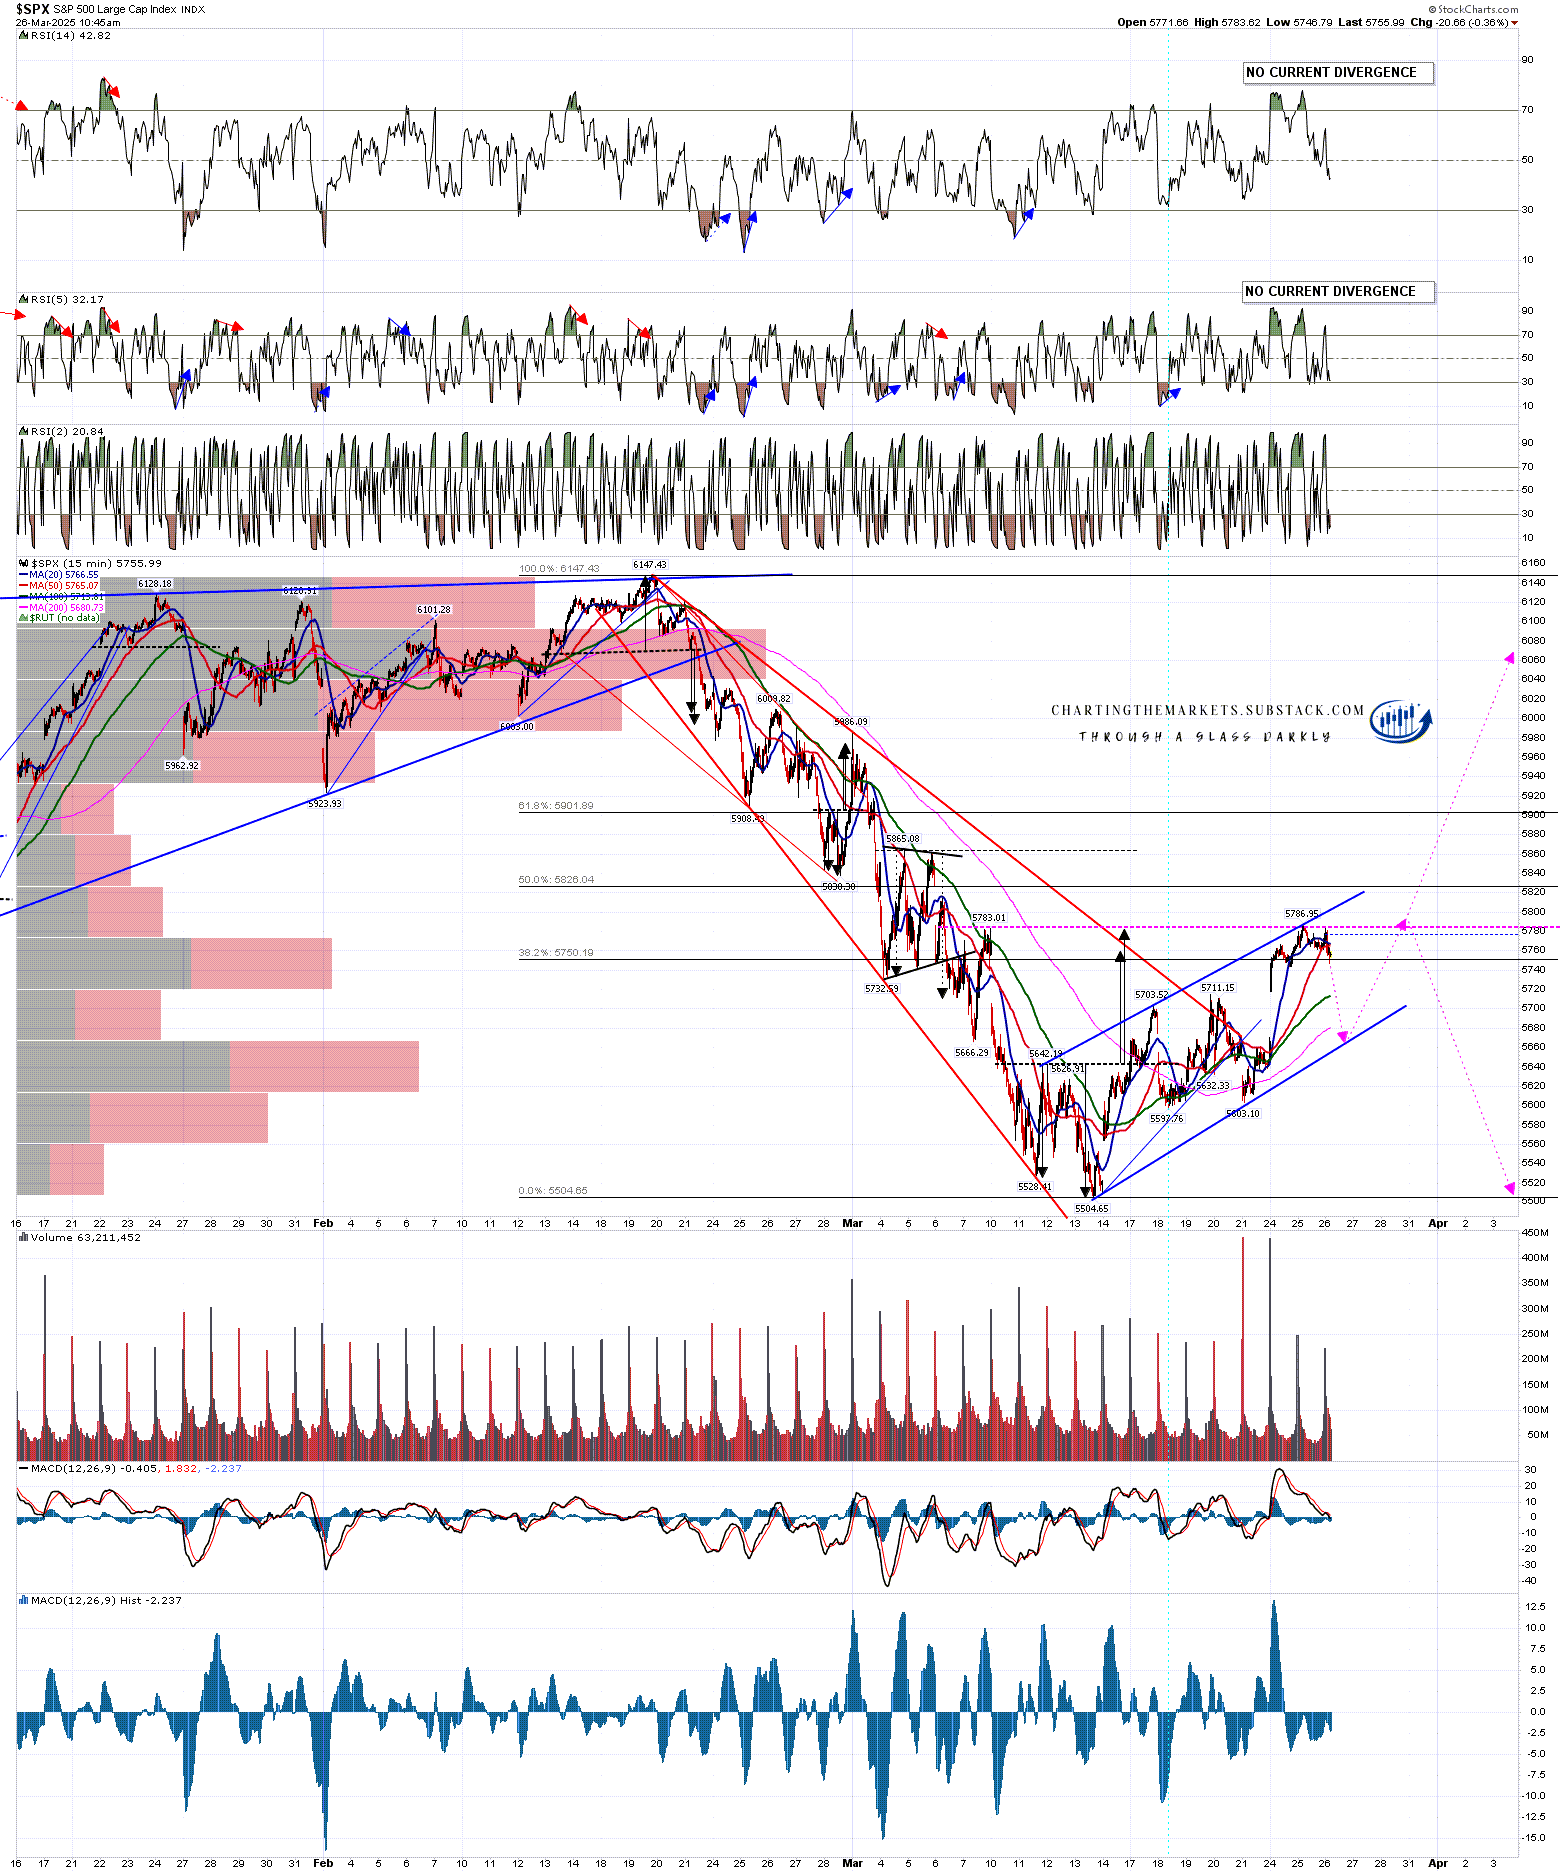
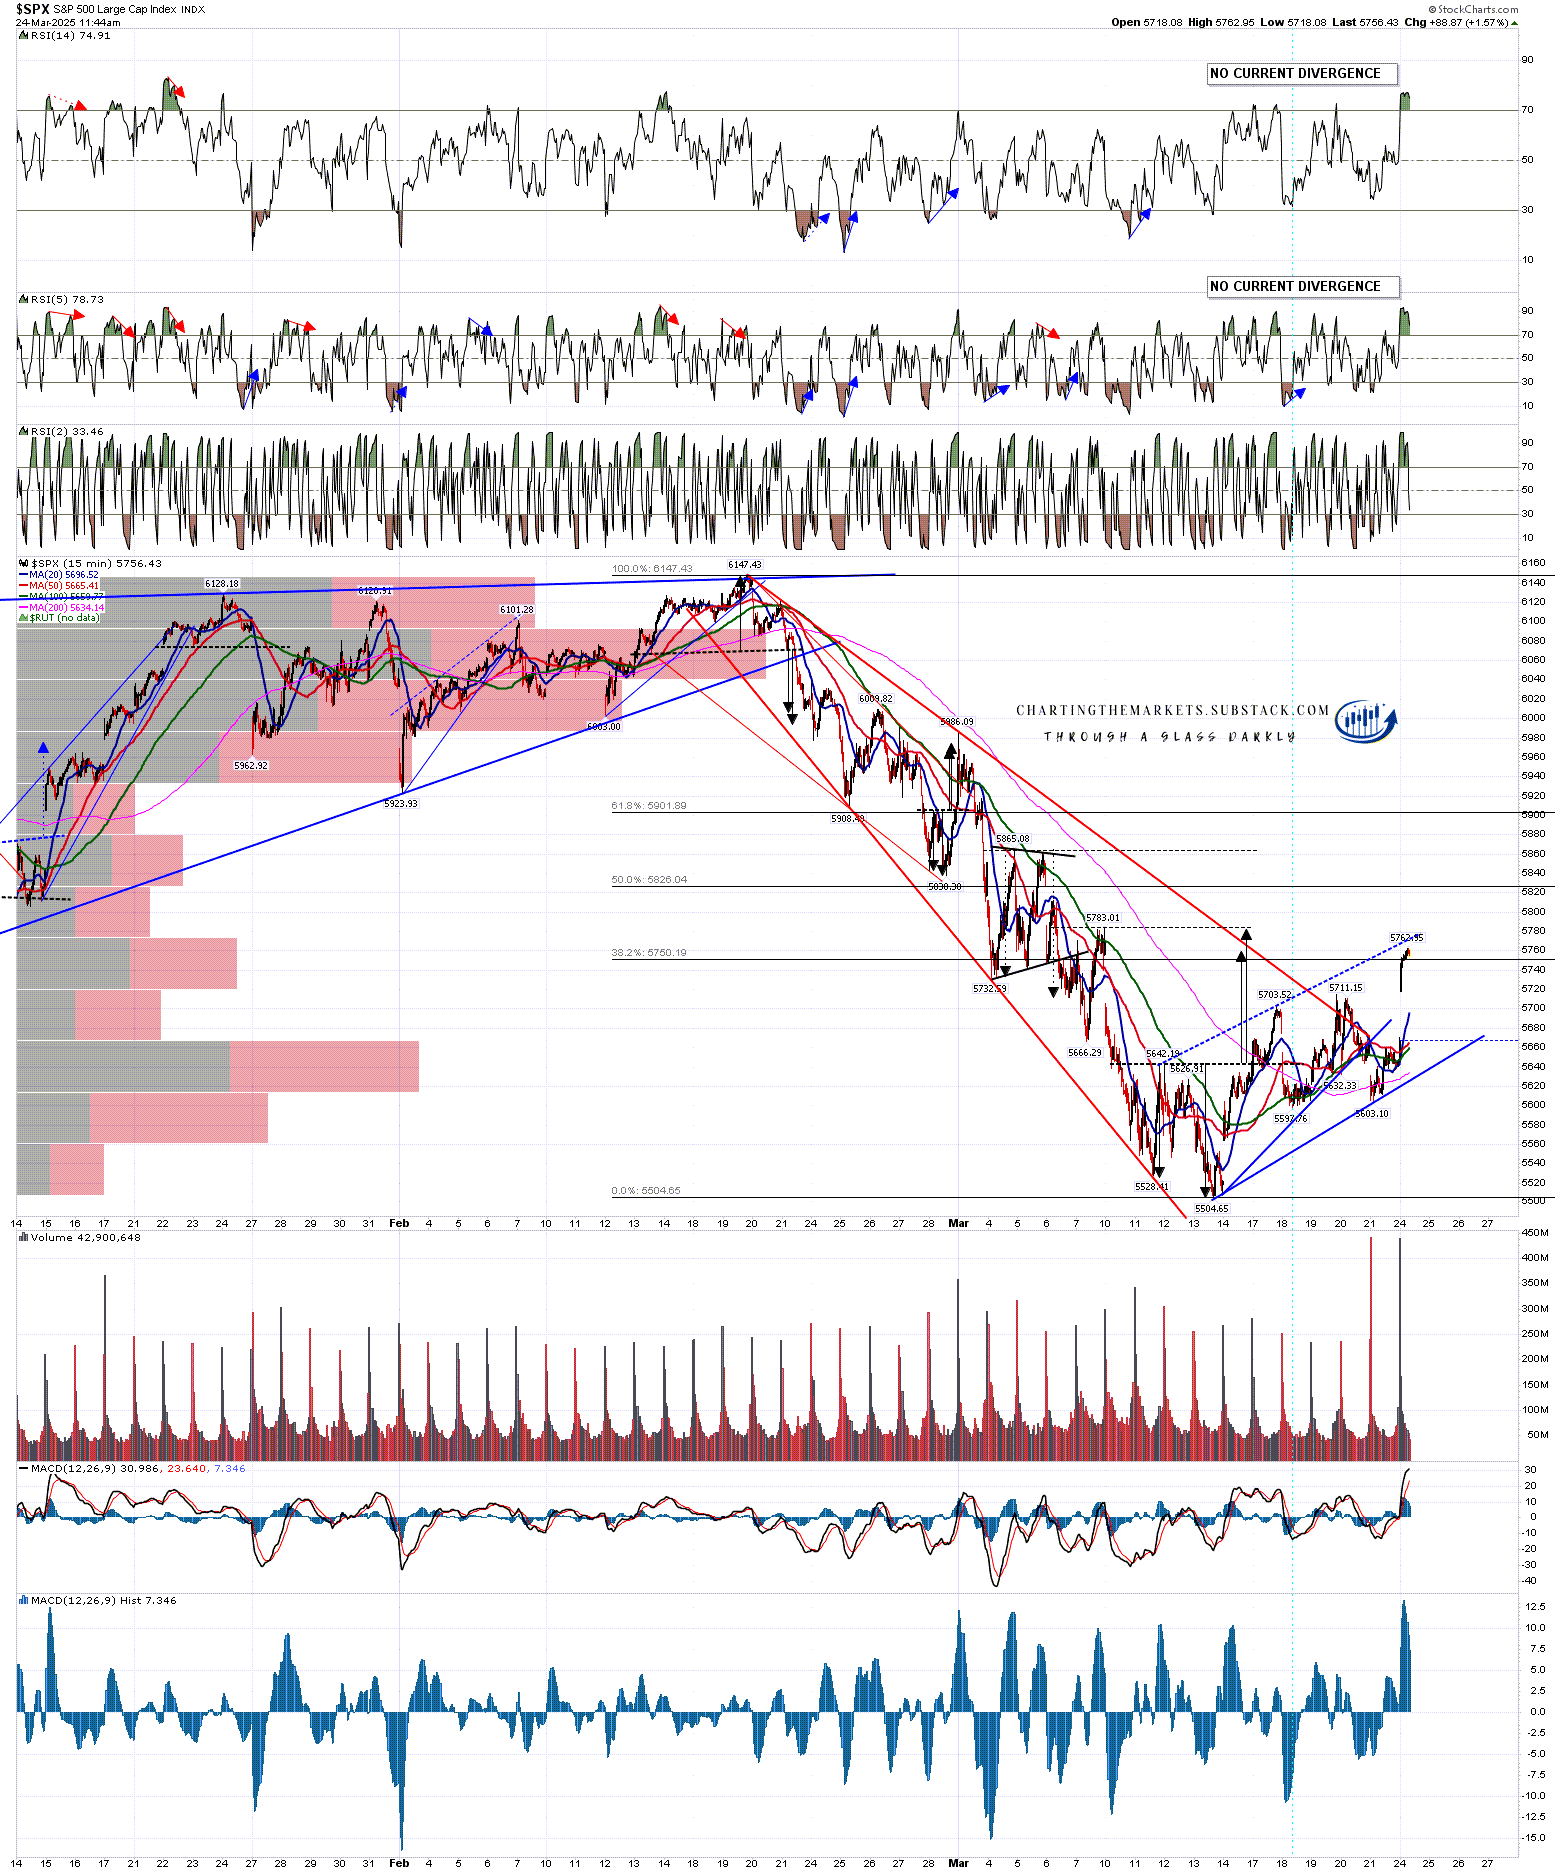
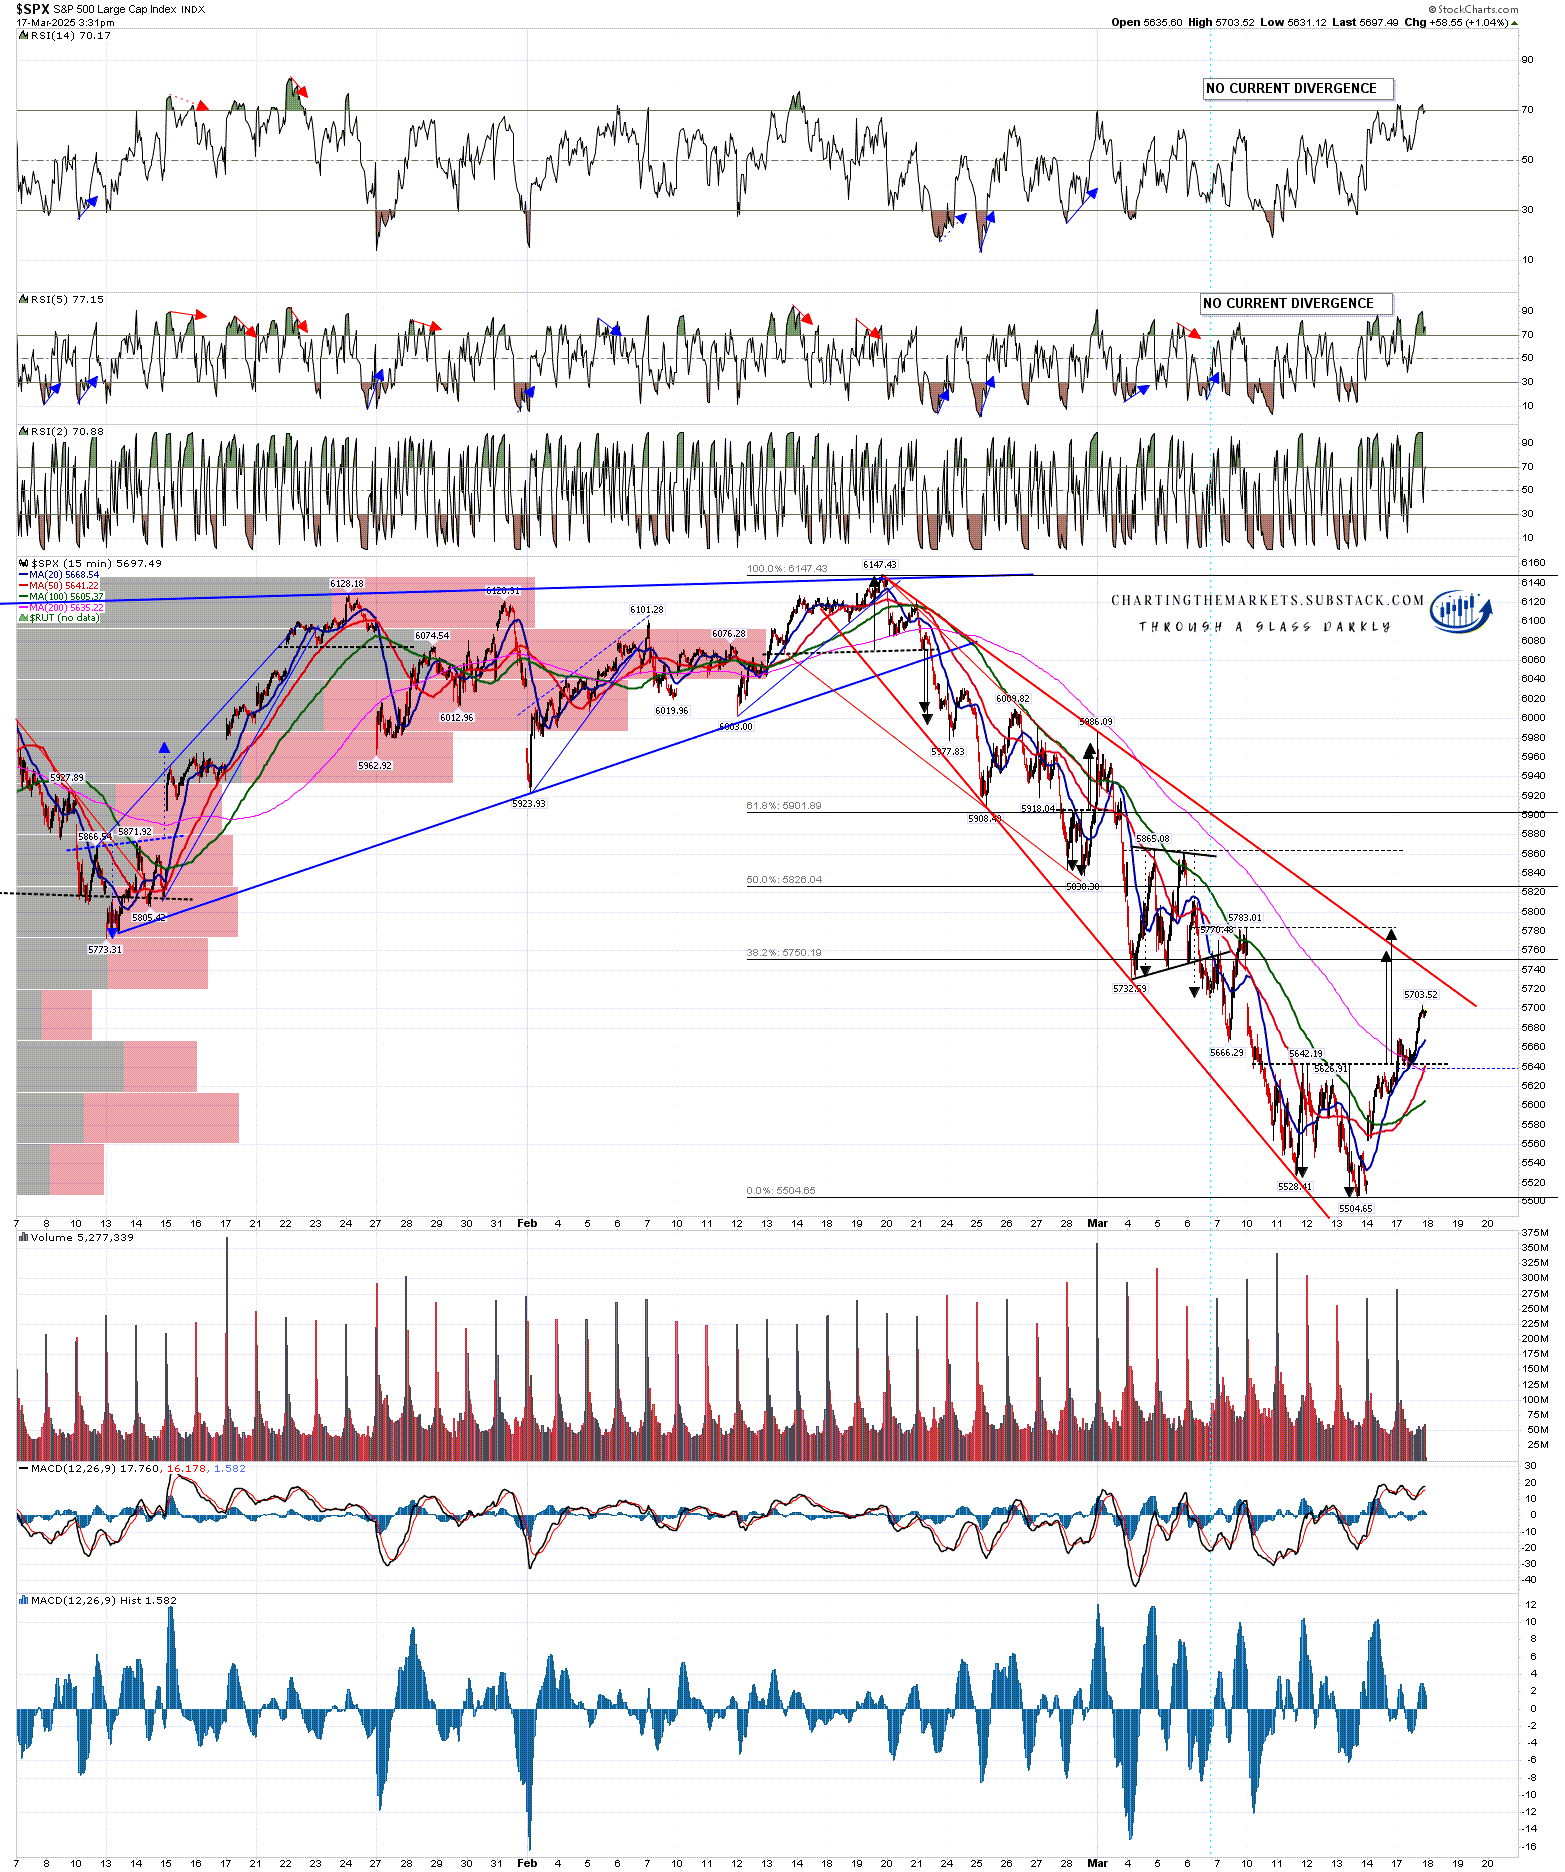
SPX daily chart:

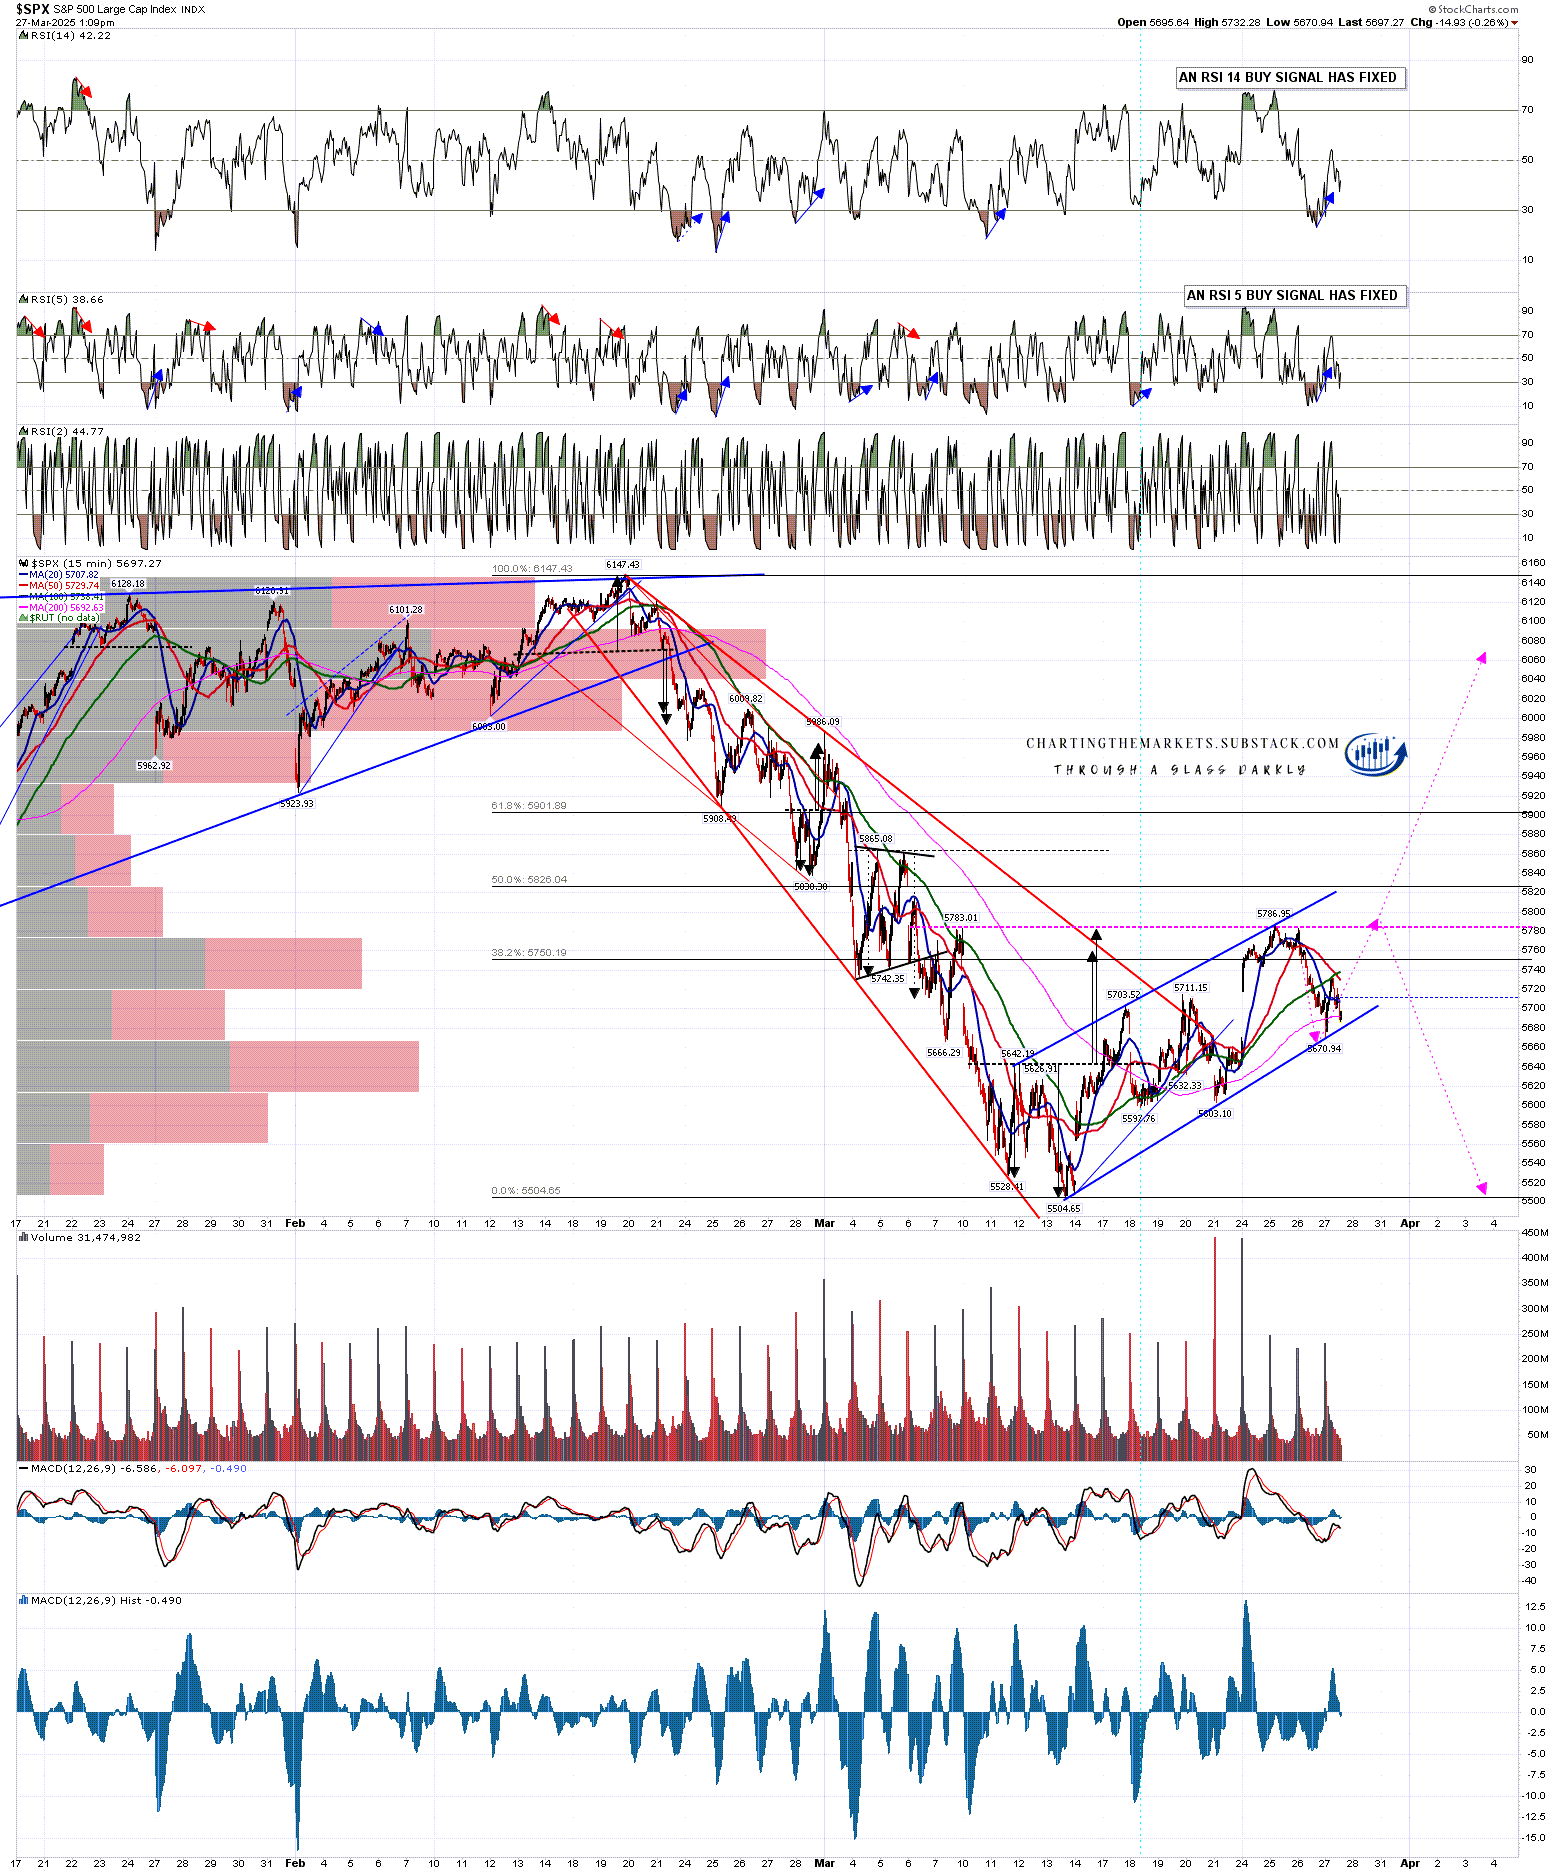
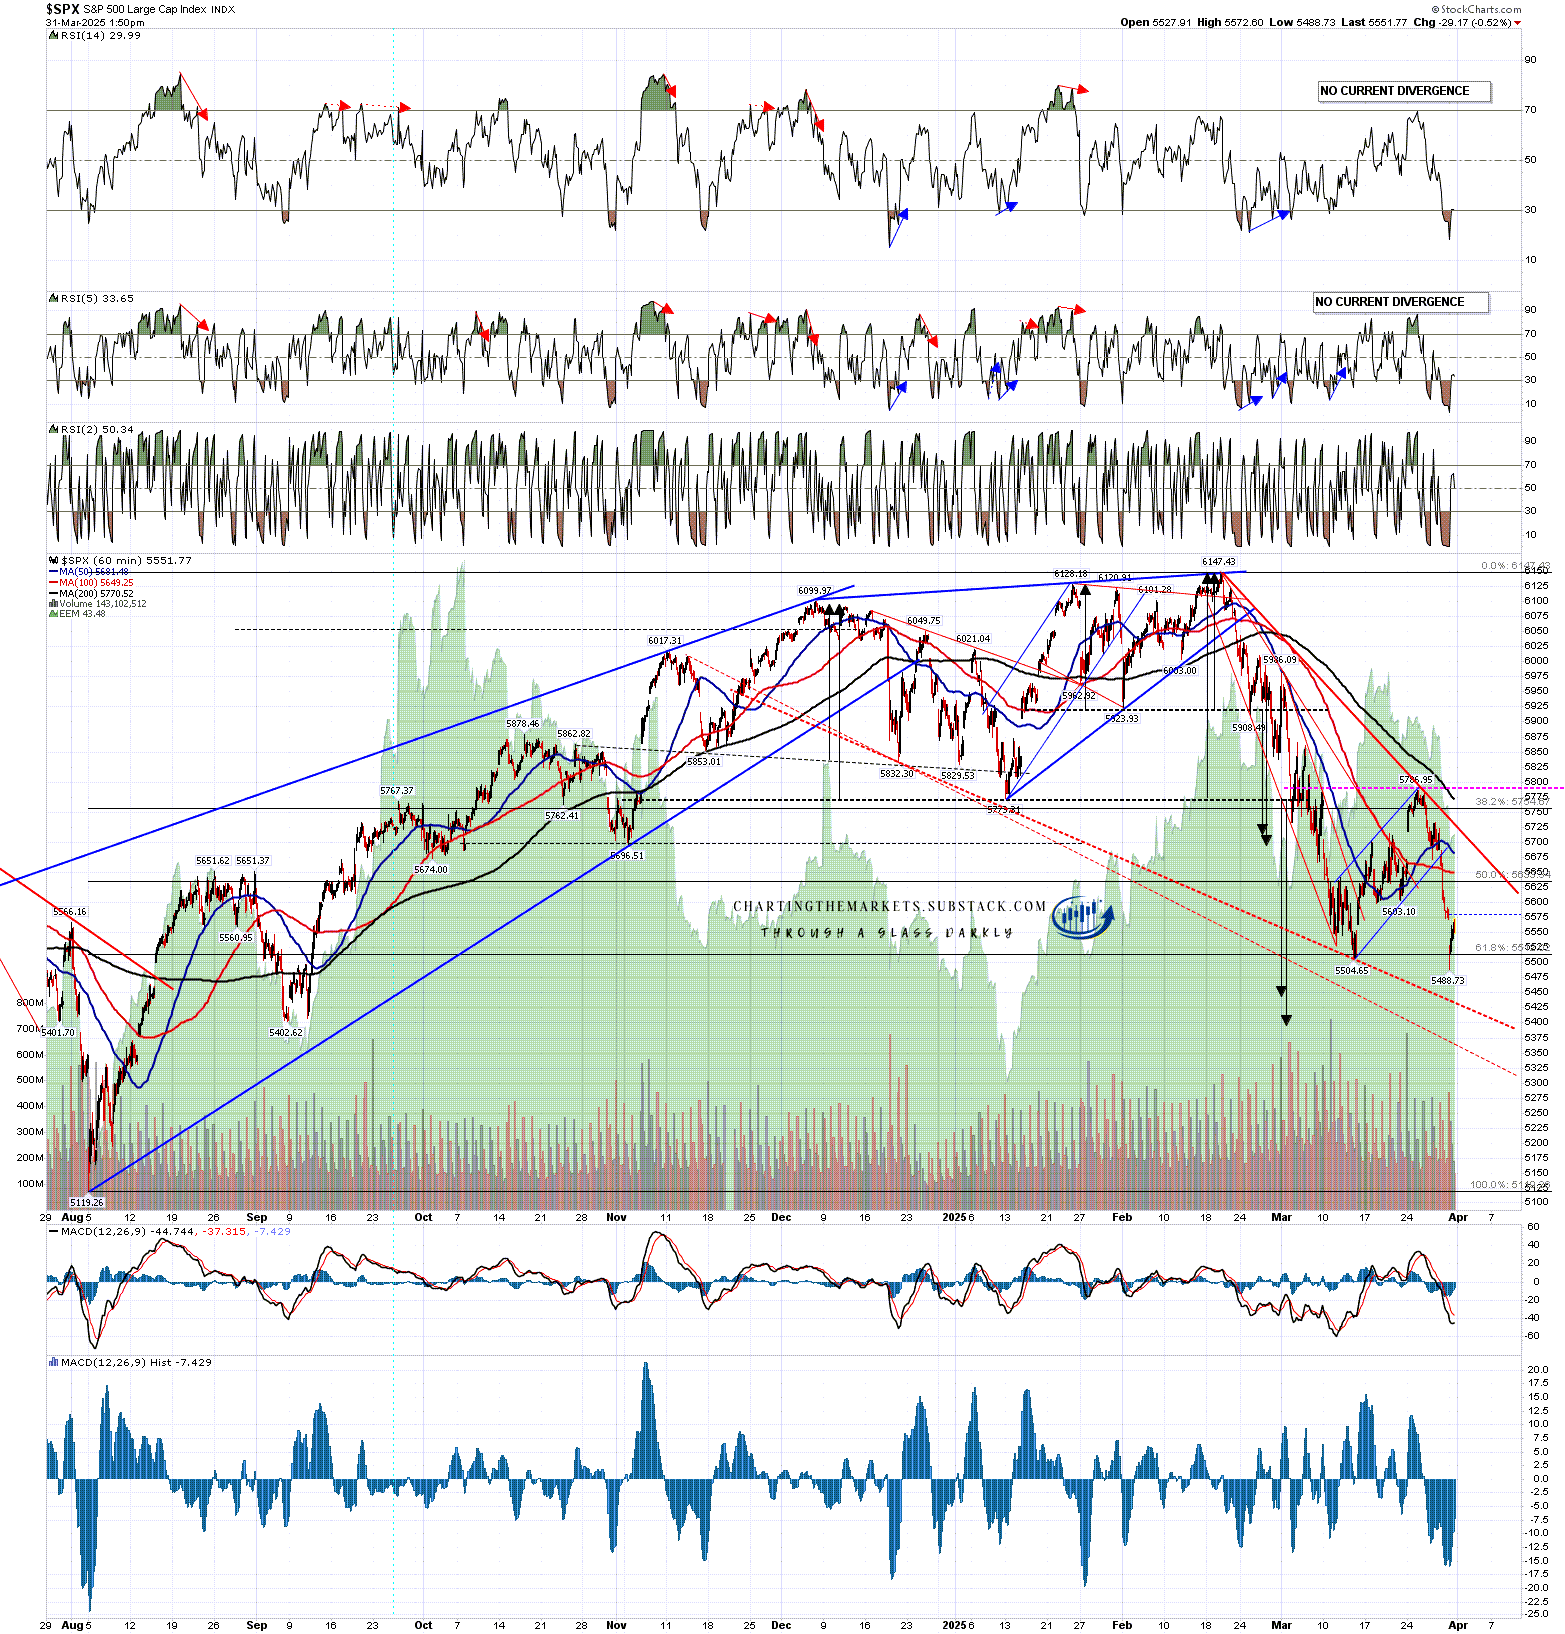
SPX has retested the 2025 low and has set up a high quality double bottom that on a sustained break back over double bottom resistance at 5786.95 would look for a target close to a retest of the all time high at 6147.43.

The open double top target is not far below in the 5440 to 5390 range, and I am watching two decent quality support trendlines that are potential support and that I have marked on the chart below. These are currently in the 5430 and 5360 areas and declining of course.

SPX 60min chart:

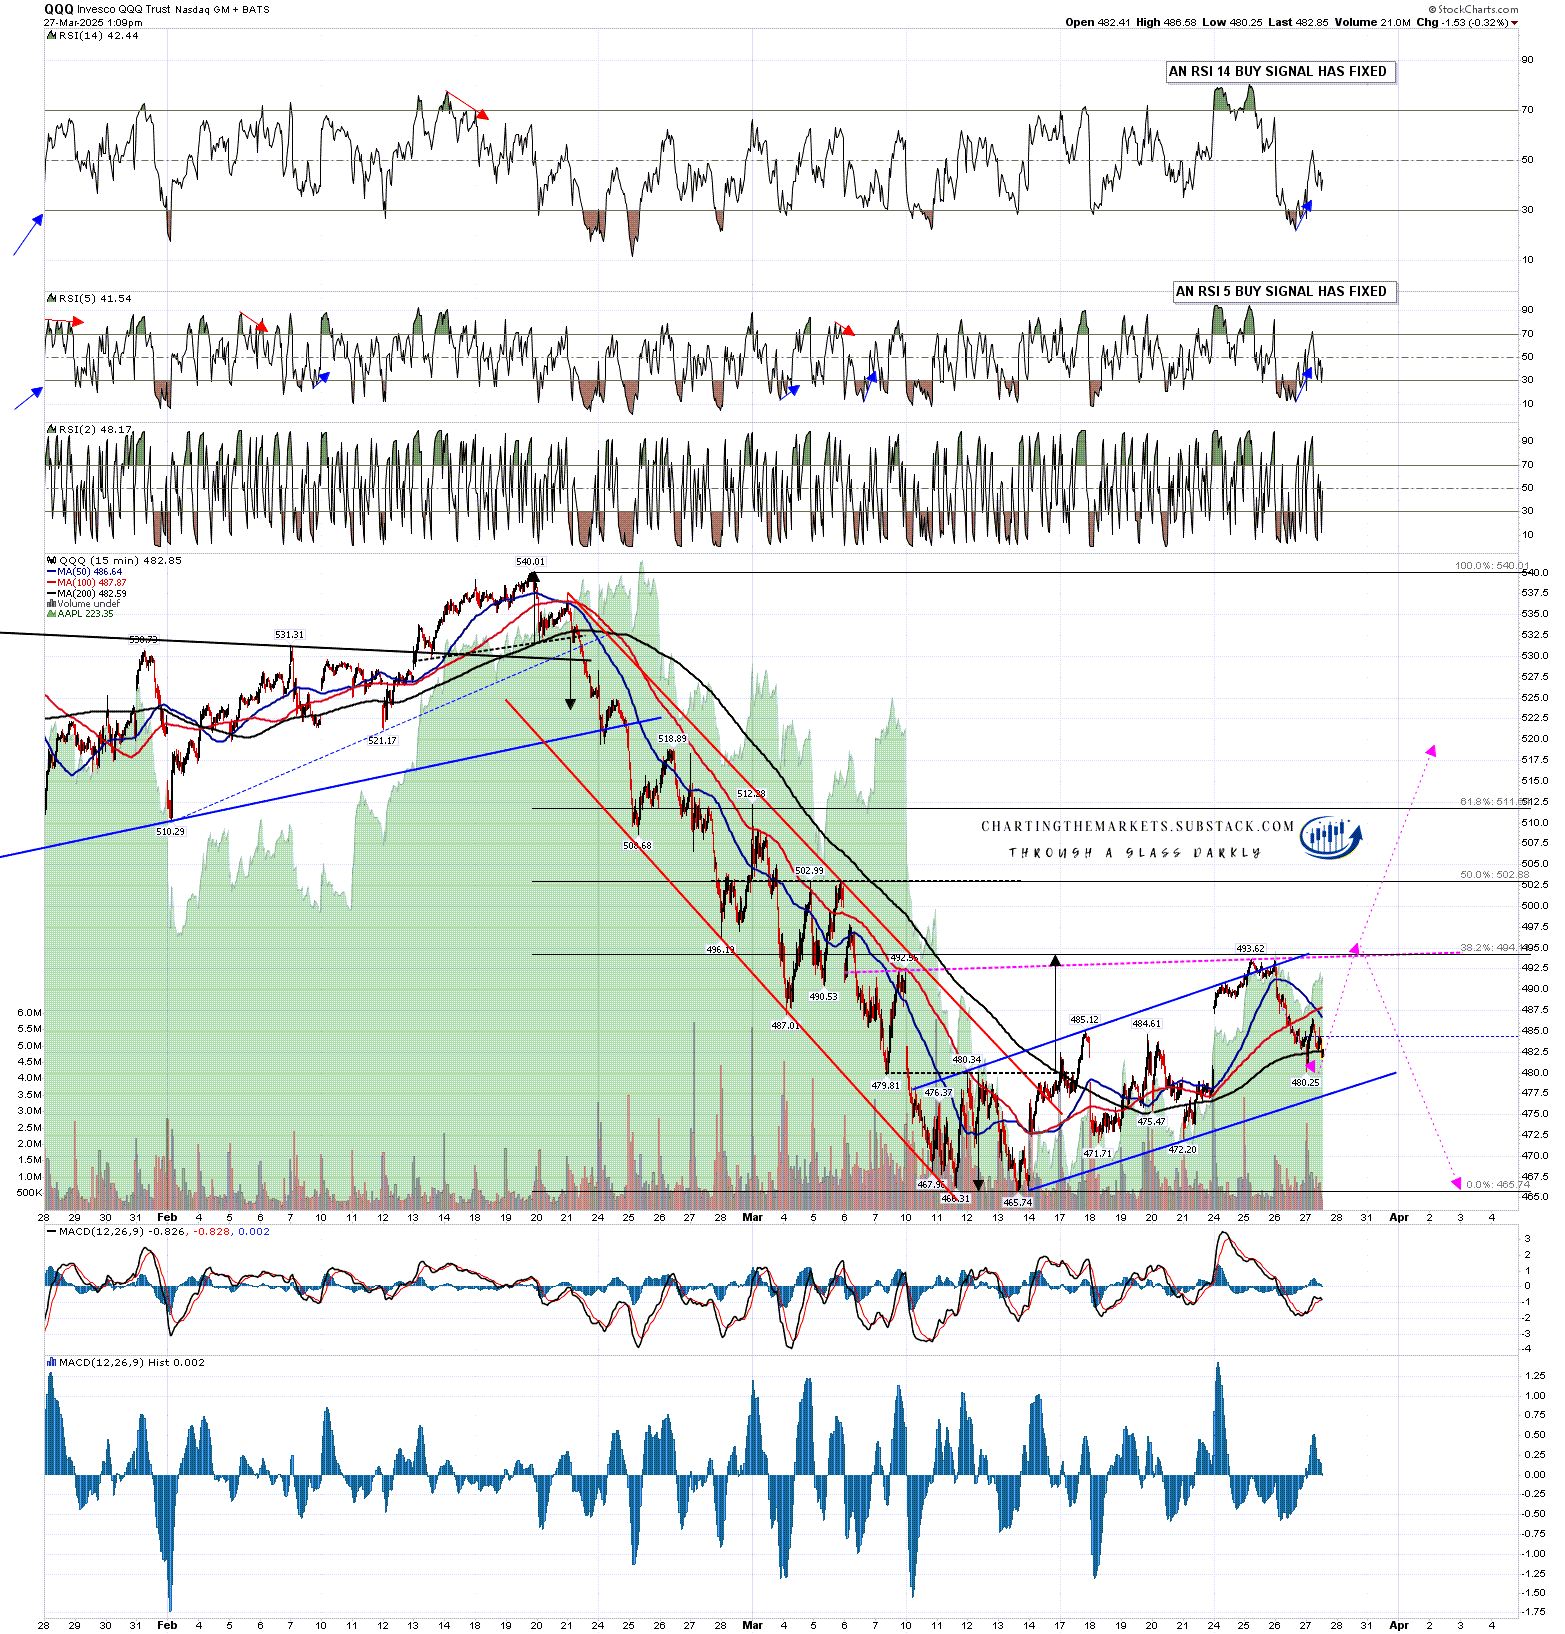
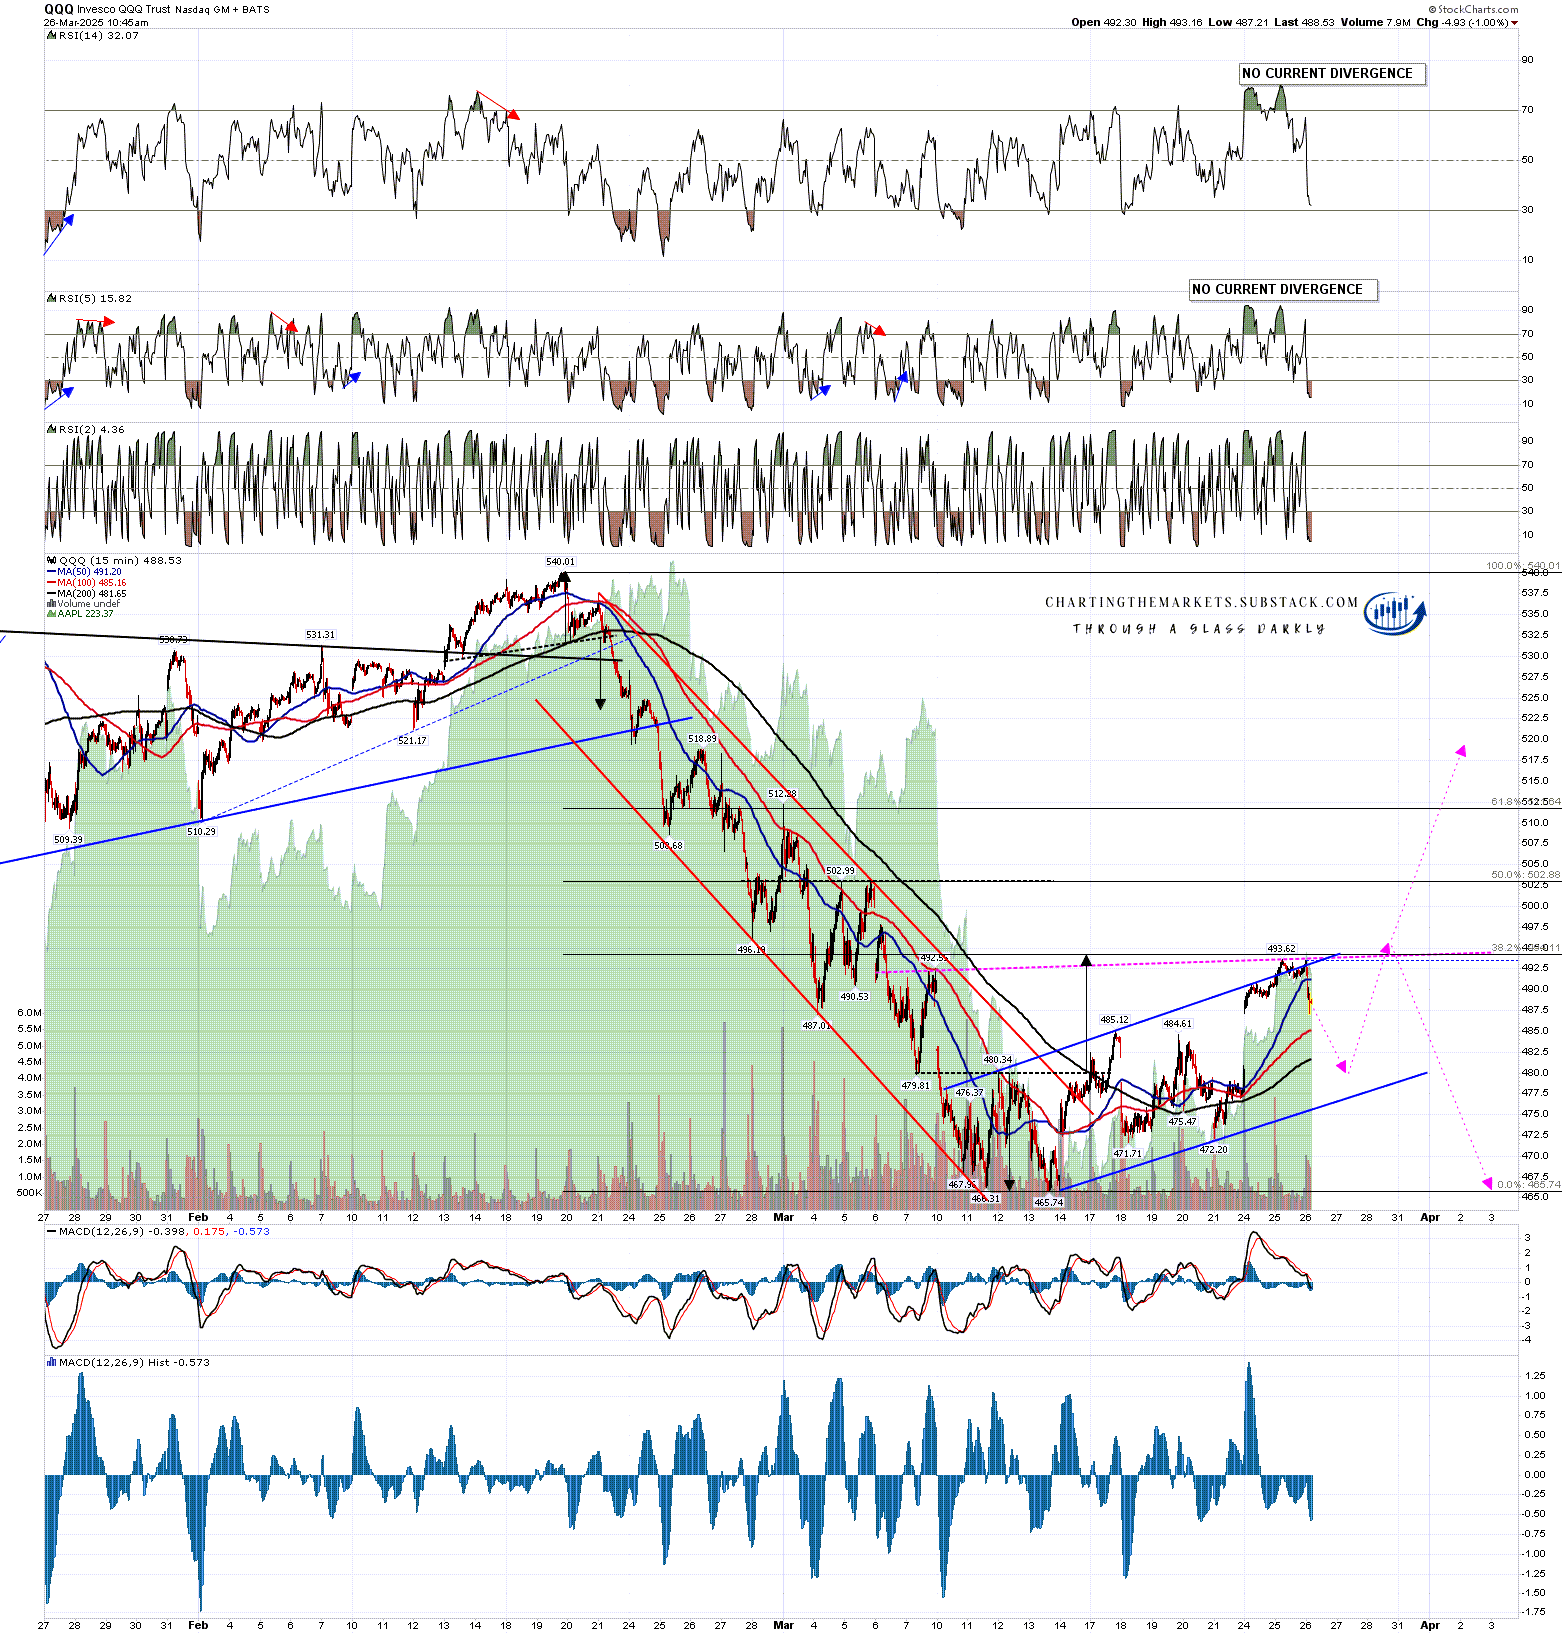
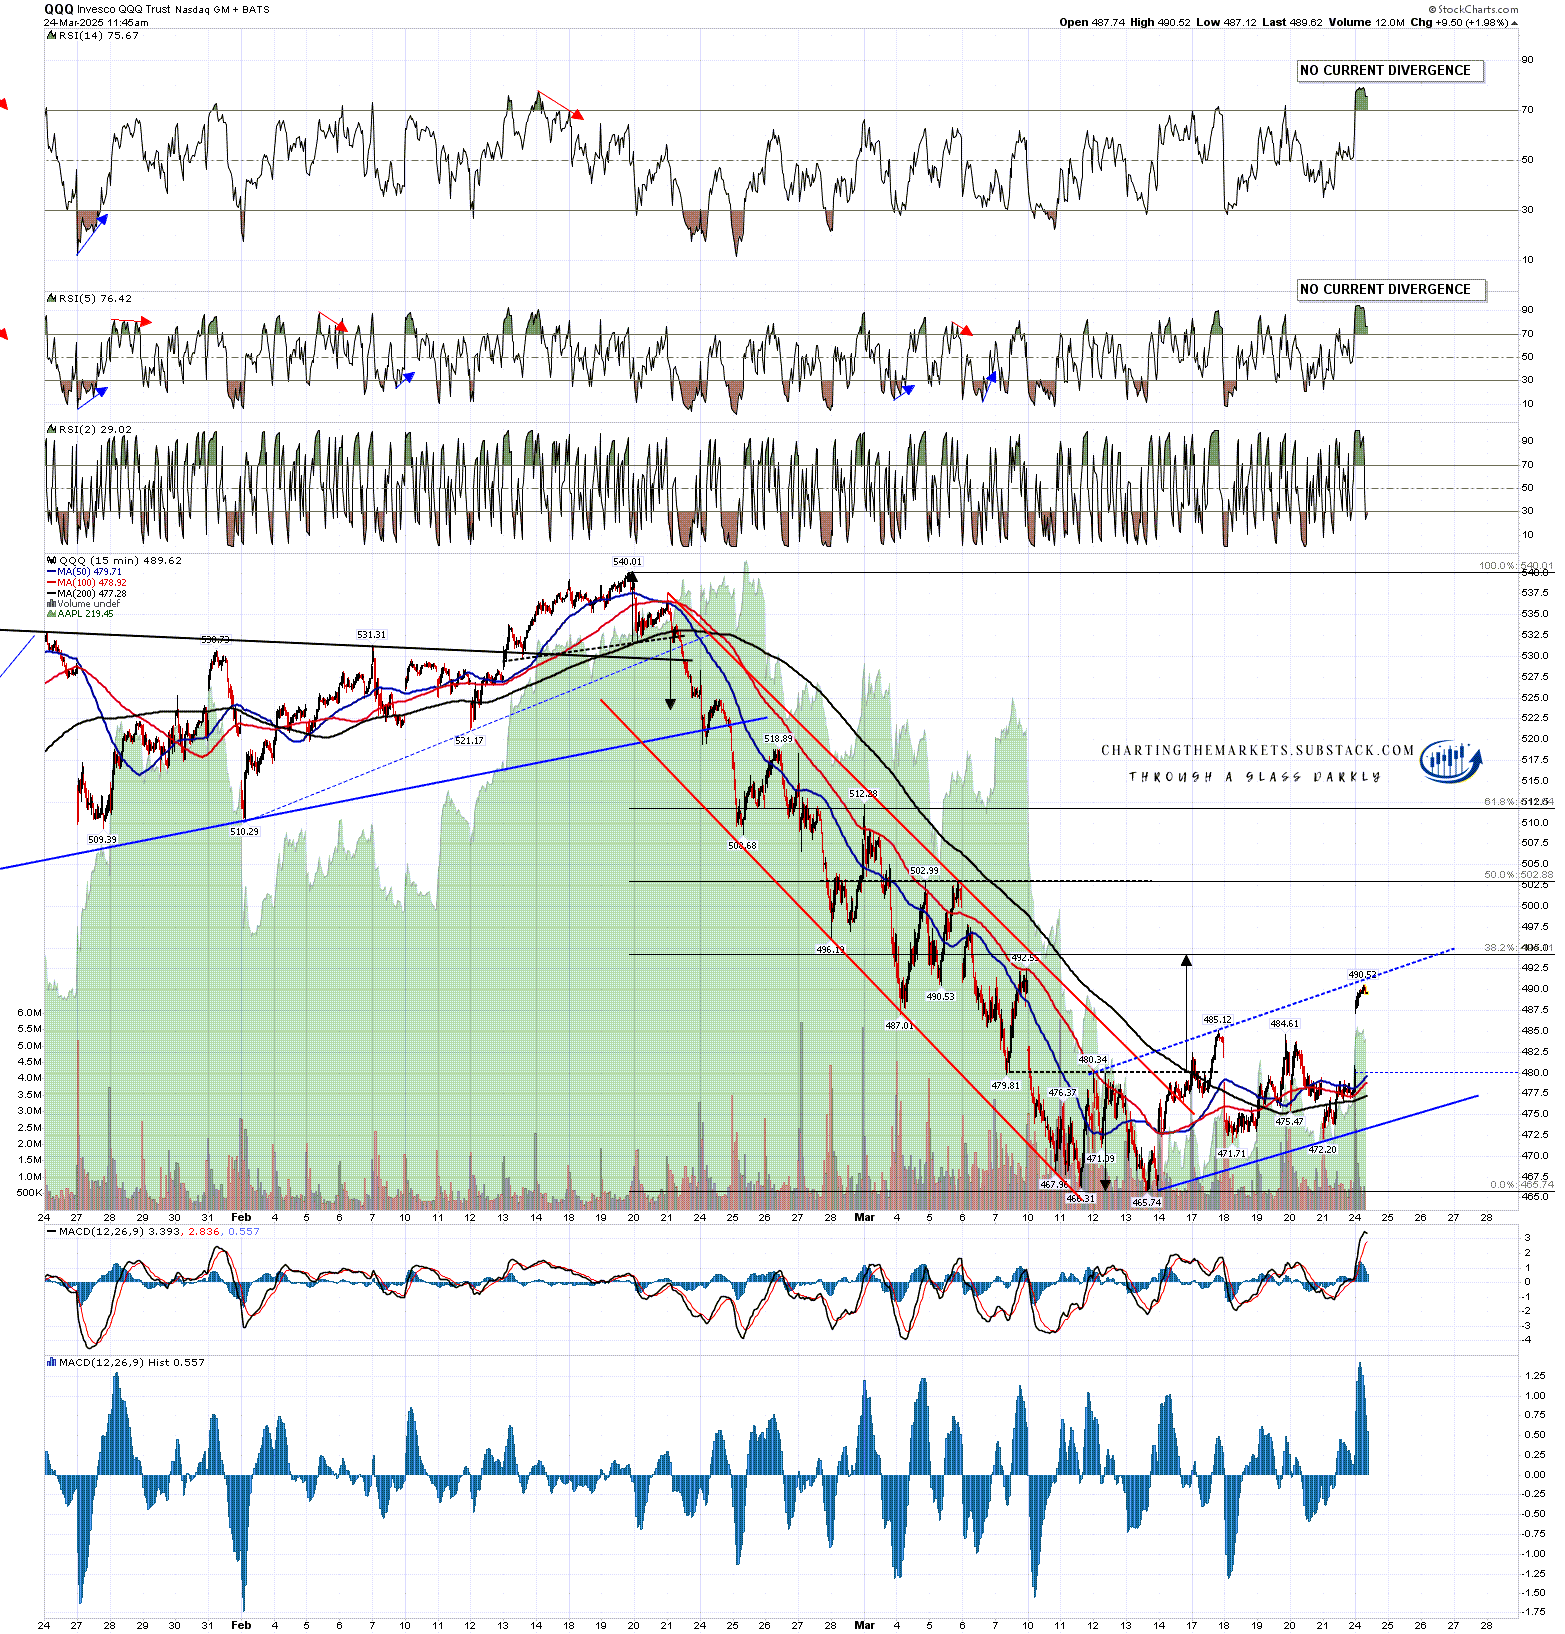
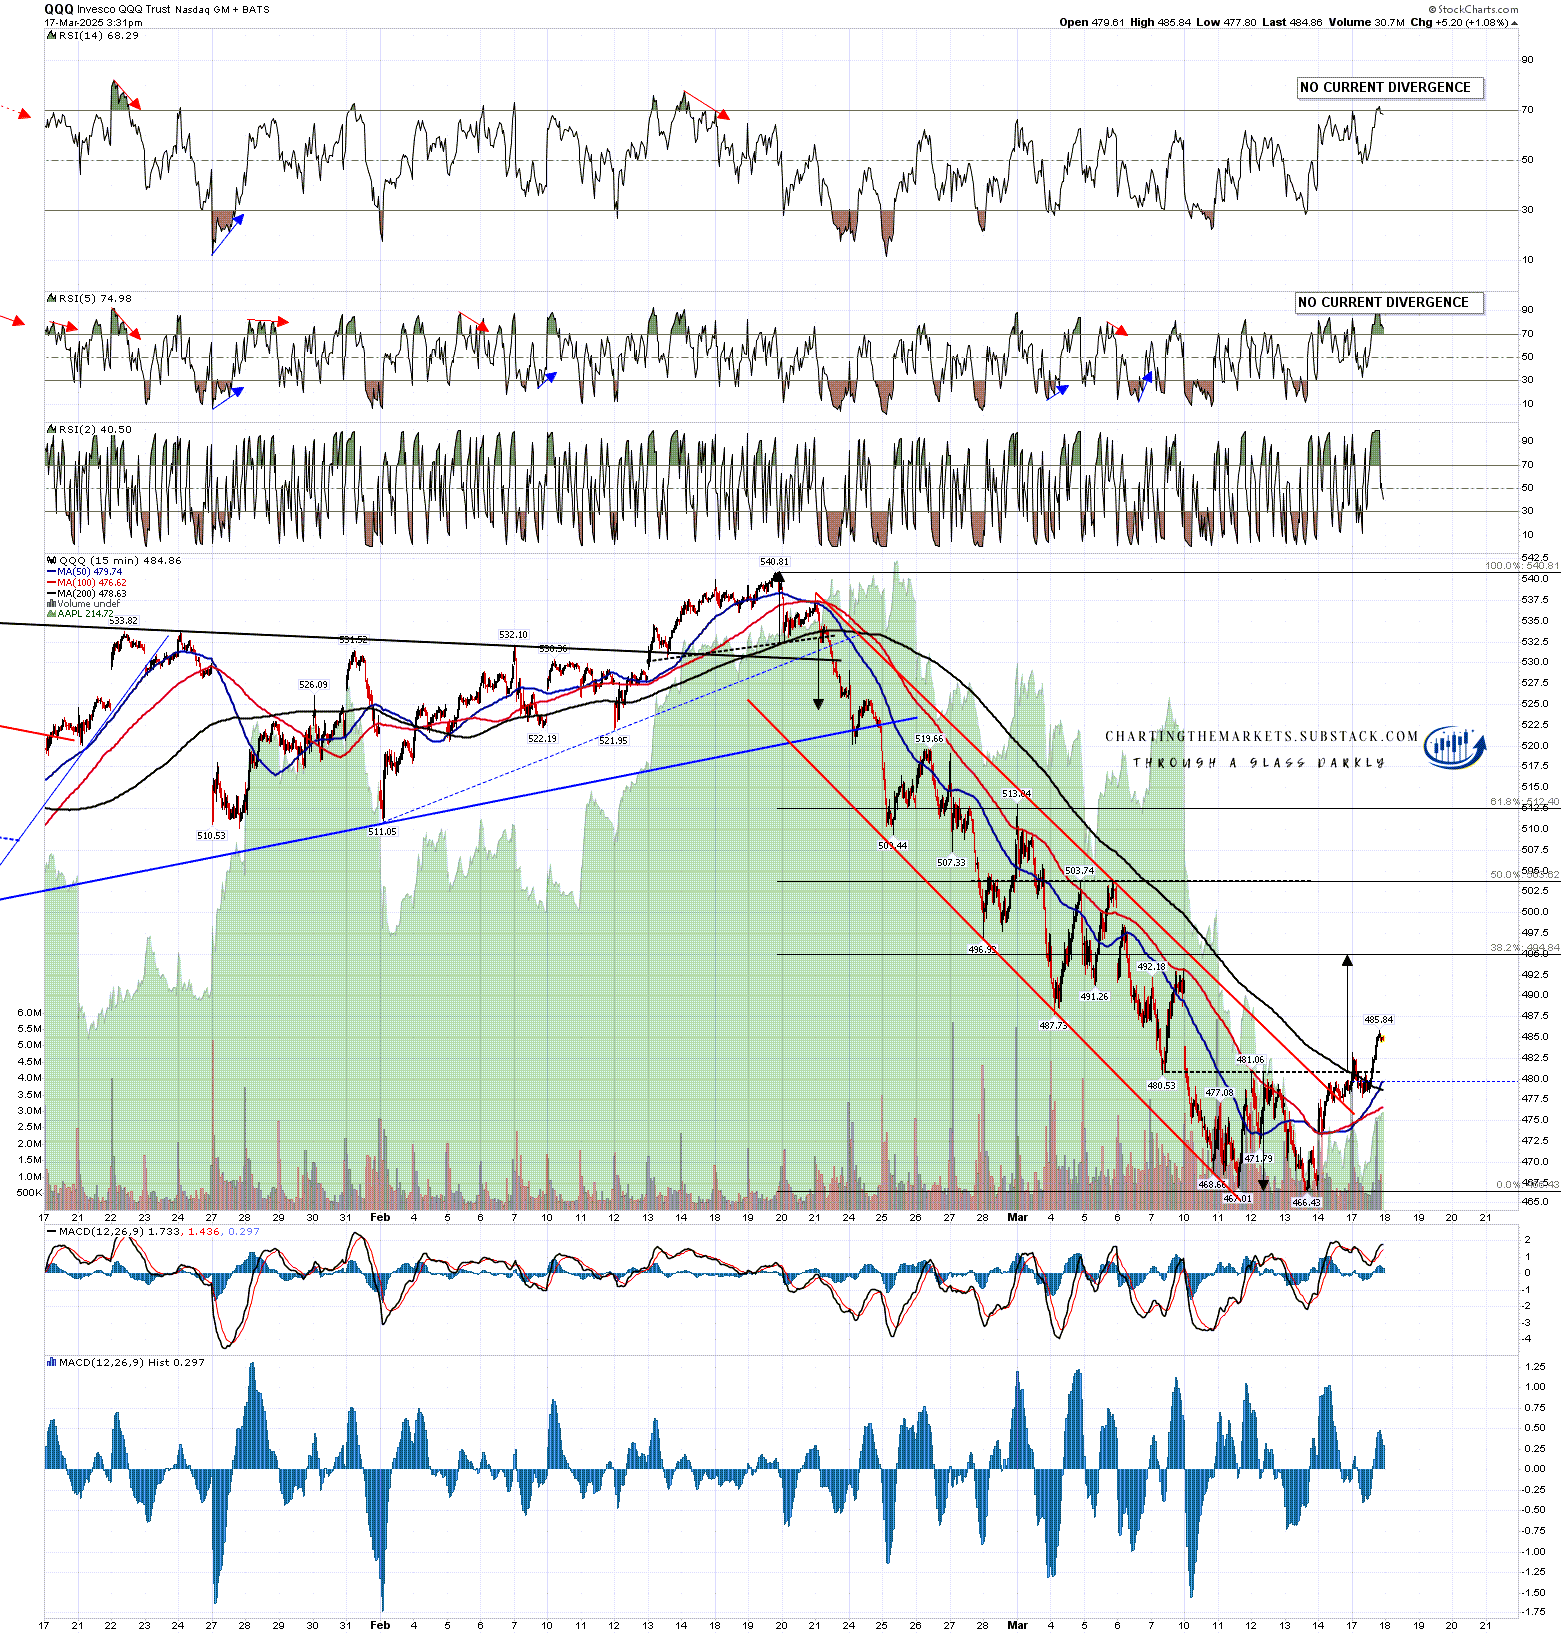
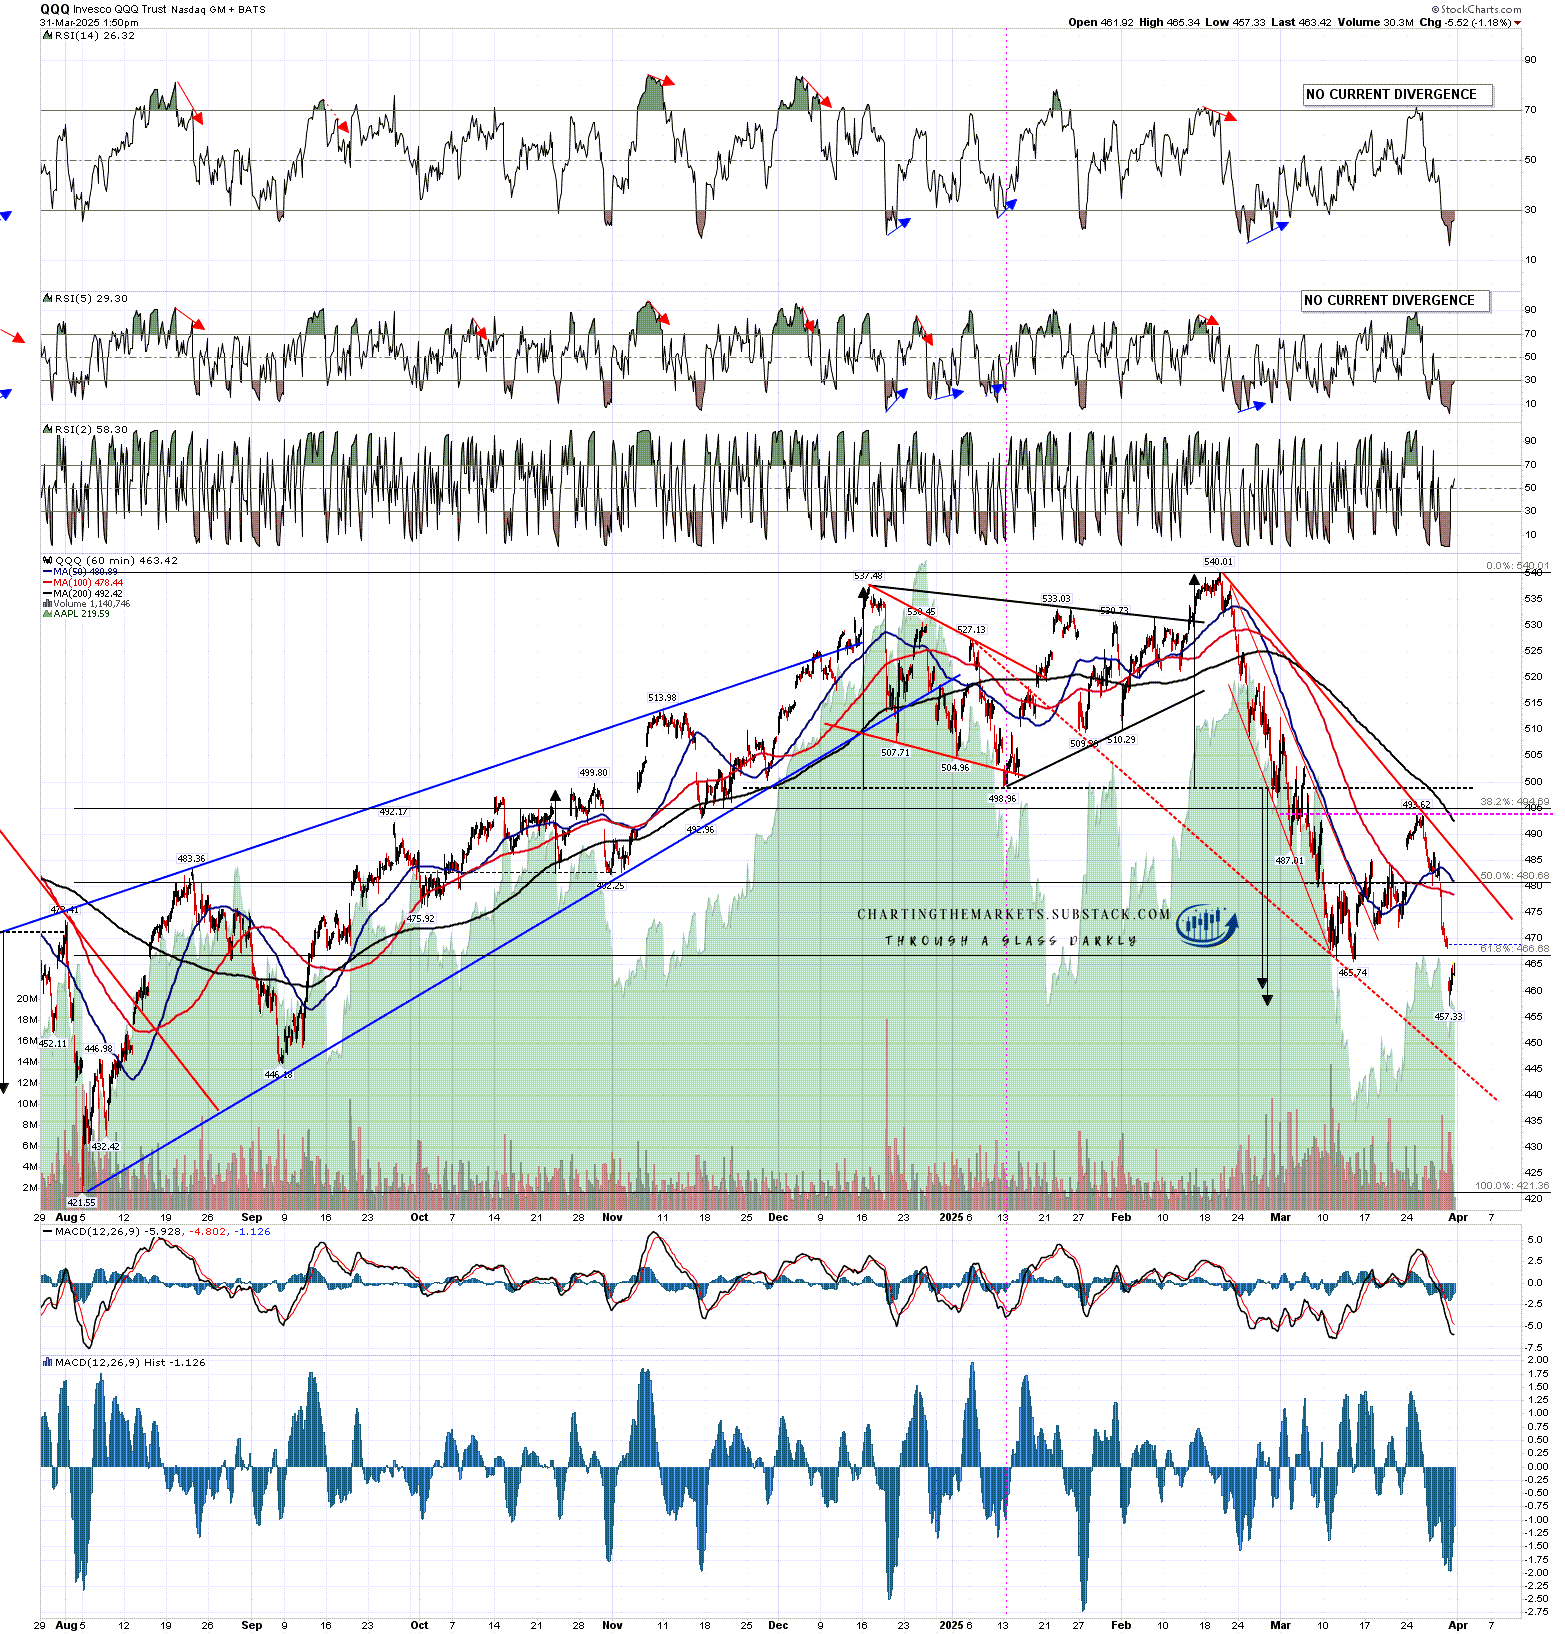
QQQ has retested the 2025 low and has set up a high quality double bottom that on a sustained break back over double bottom resistance at 493.62 would look for a target in the 521 to 529 area, within striking range of the all time high at 540.01.

The open double top target is not far below in the 461 to 457 range, and I am watching a high quality support trendline that is potential support and that I have marked on the chart below. That is currently in the 445 area and declining of course.

QQQ 60min chart:

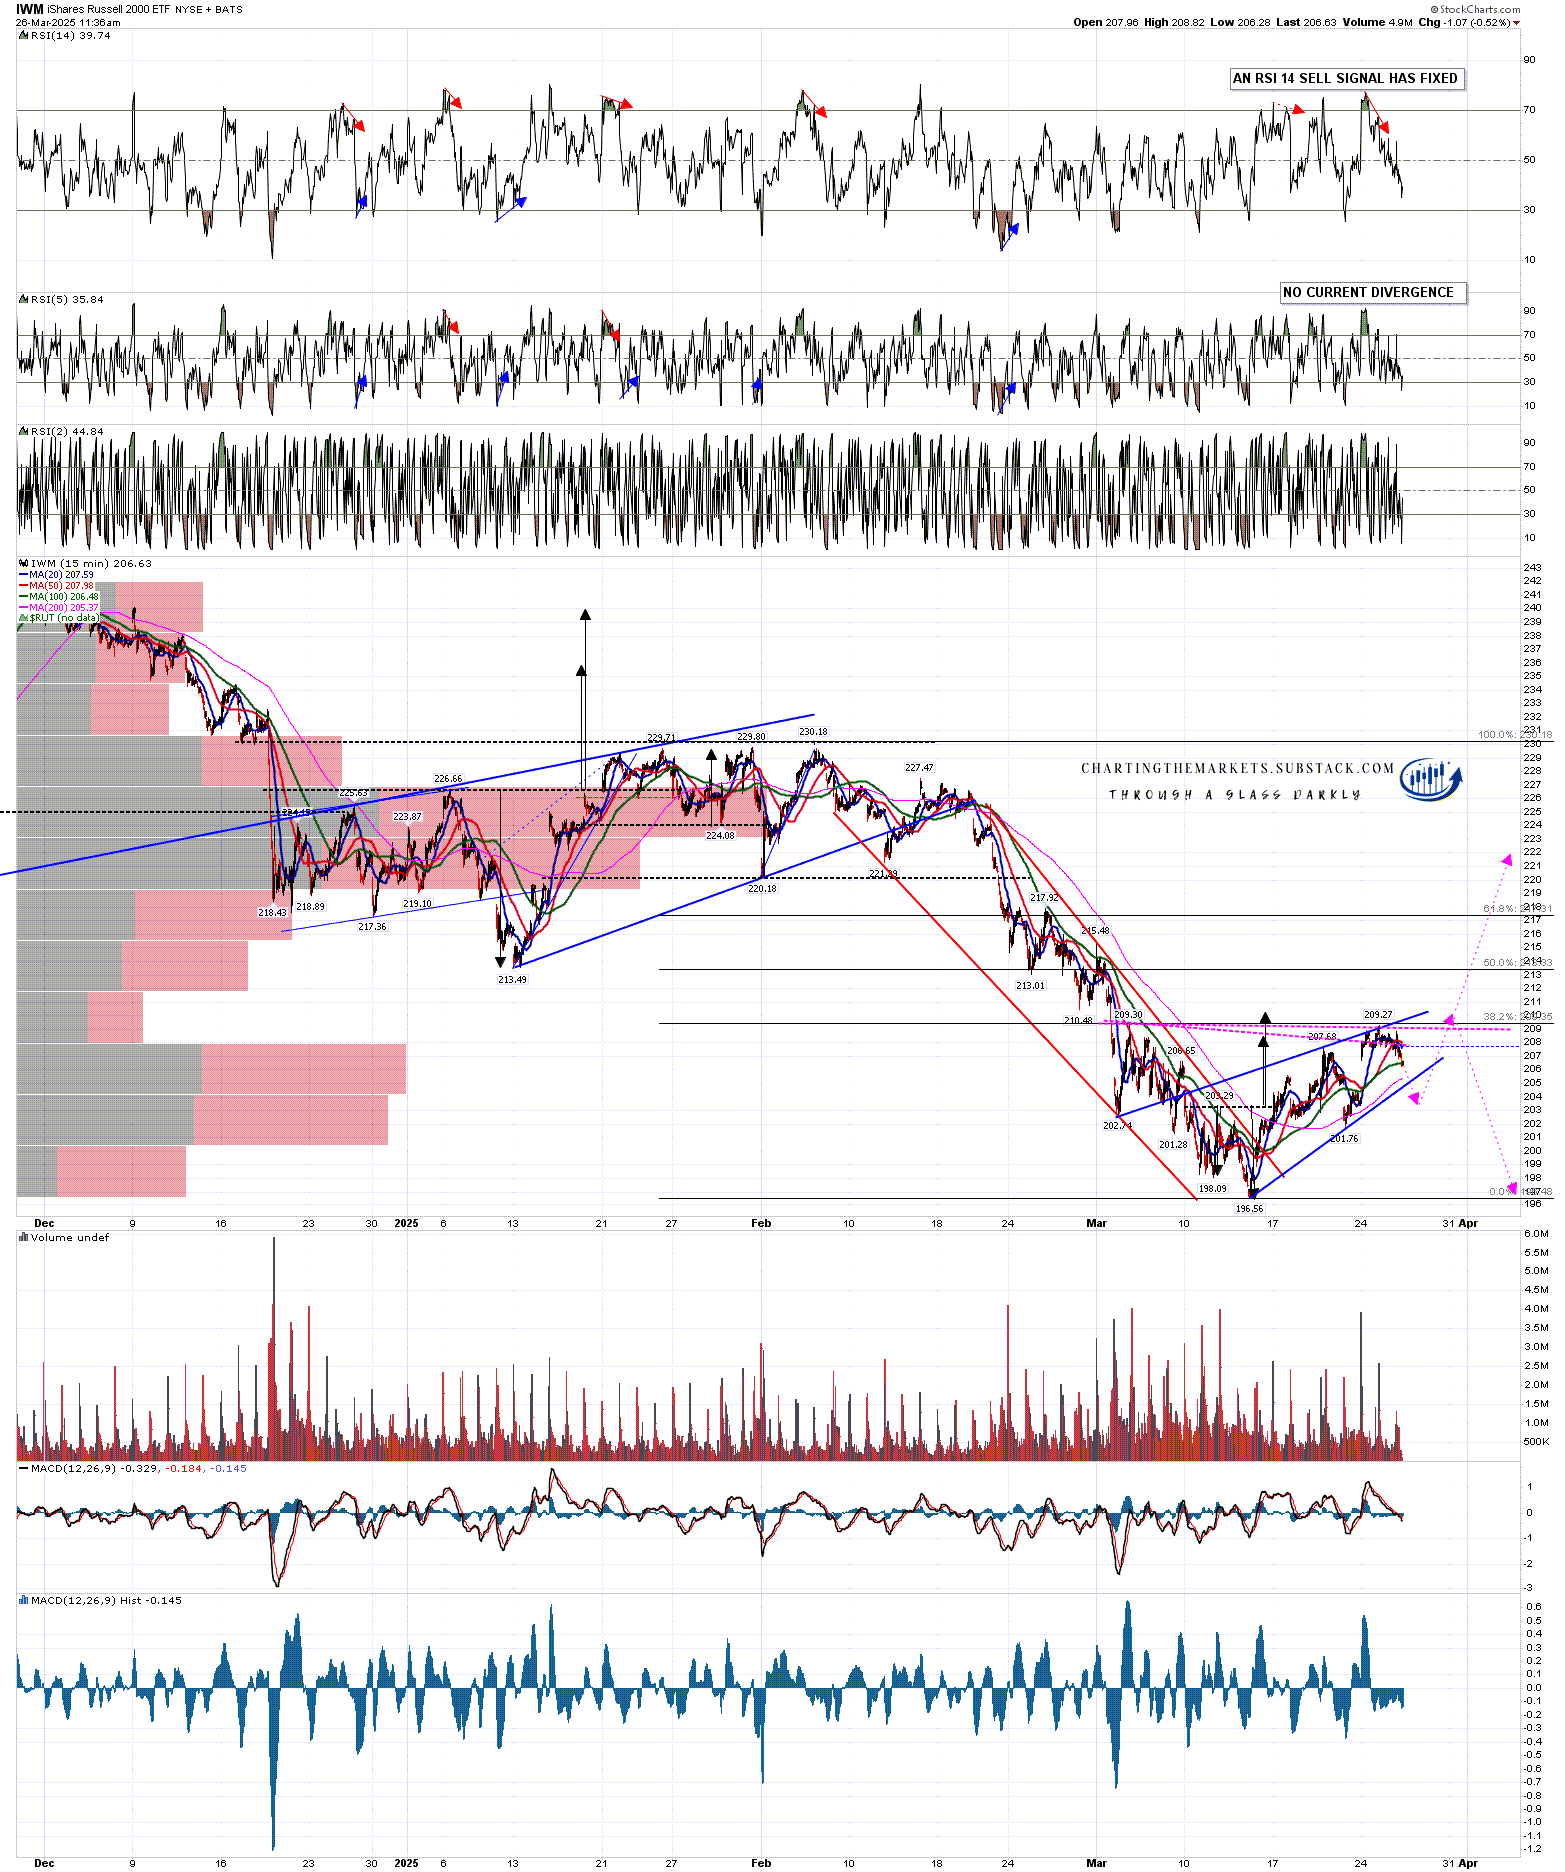
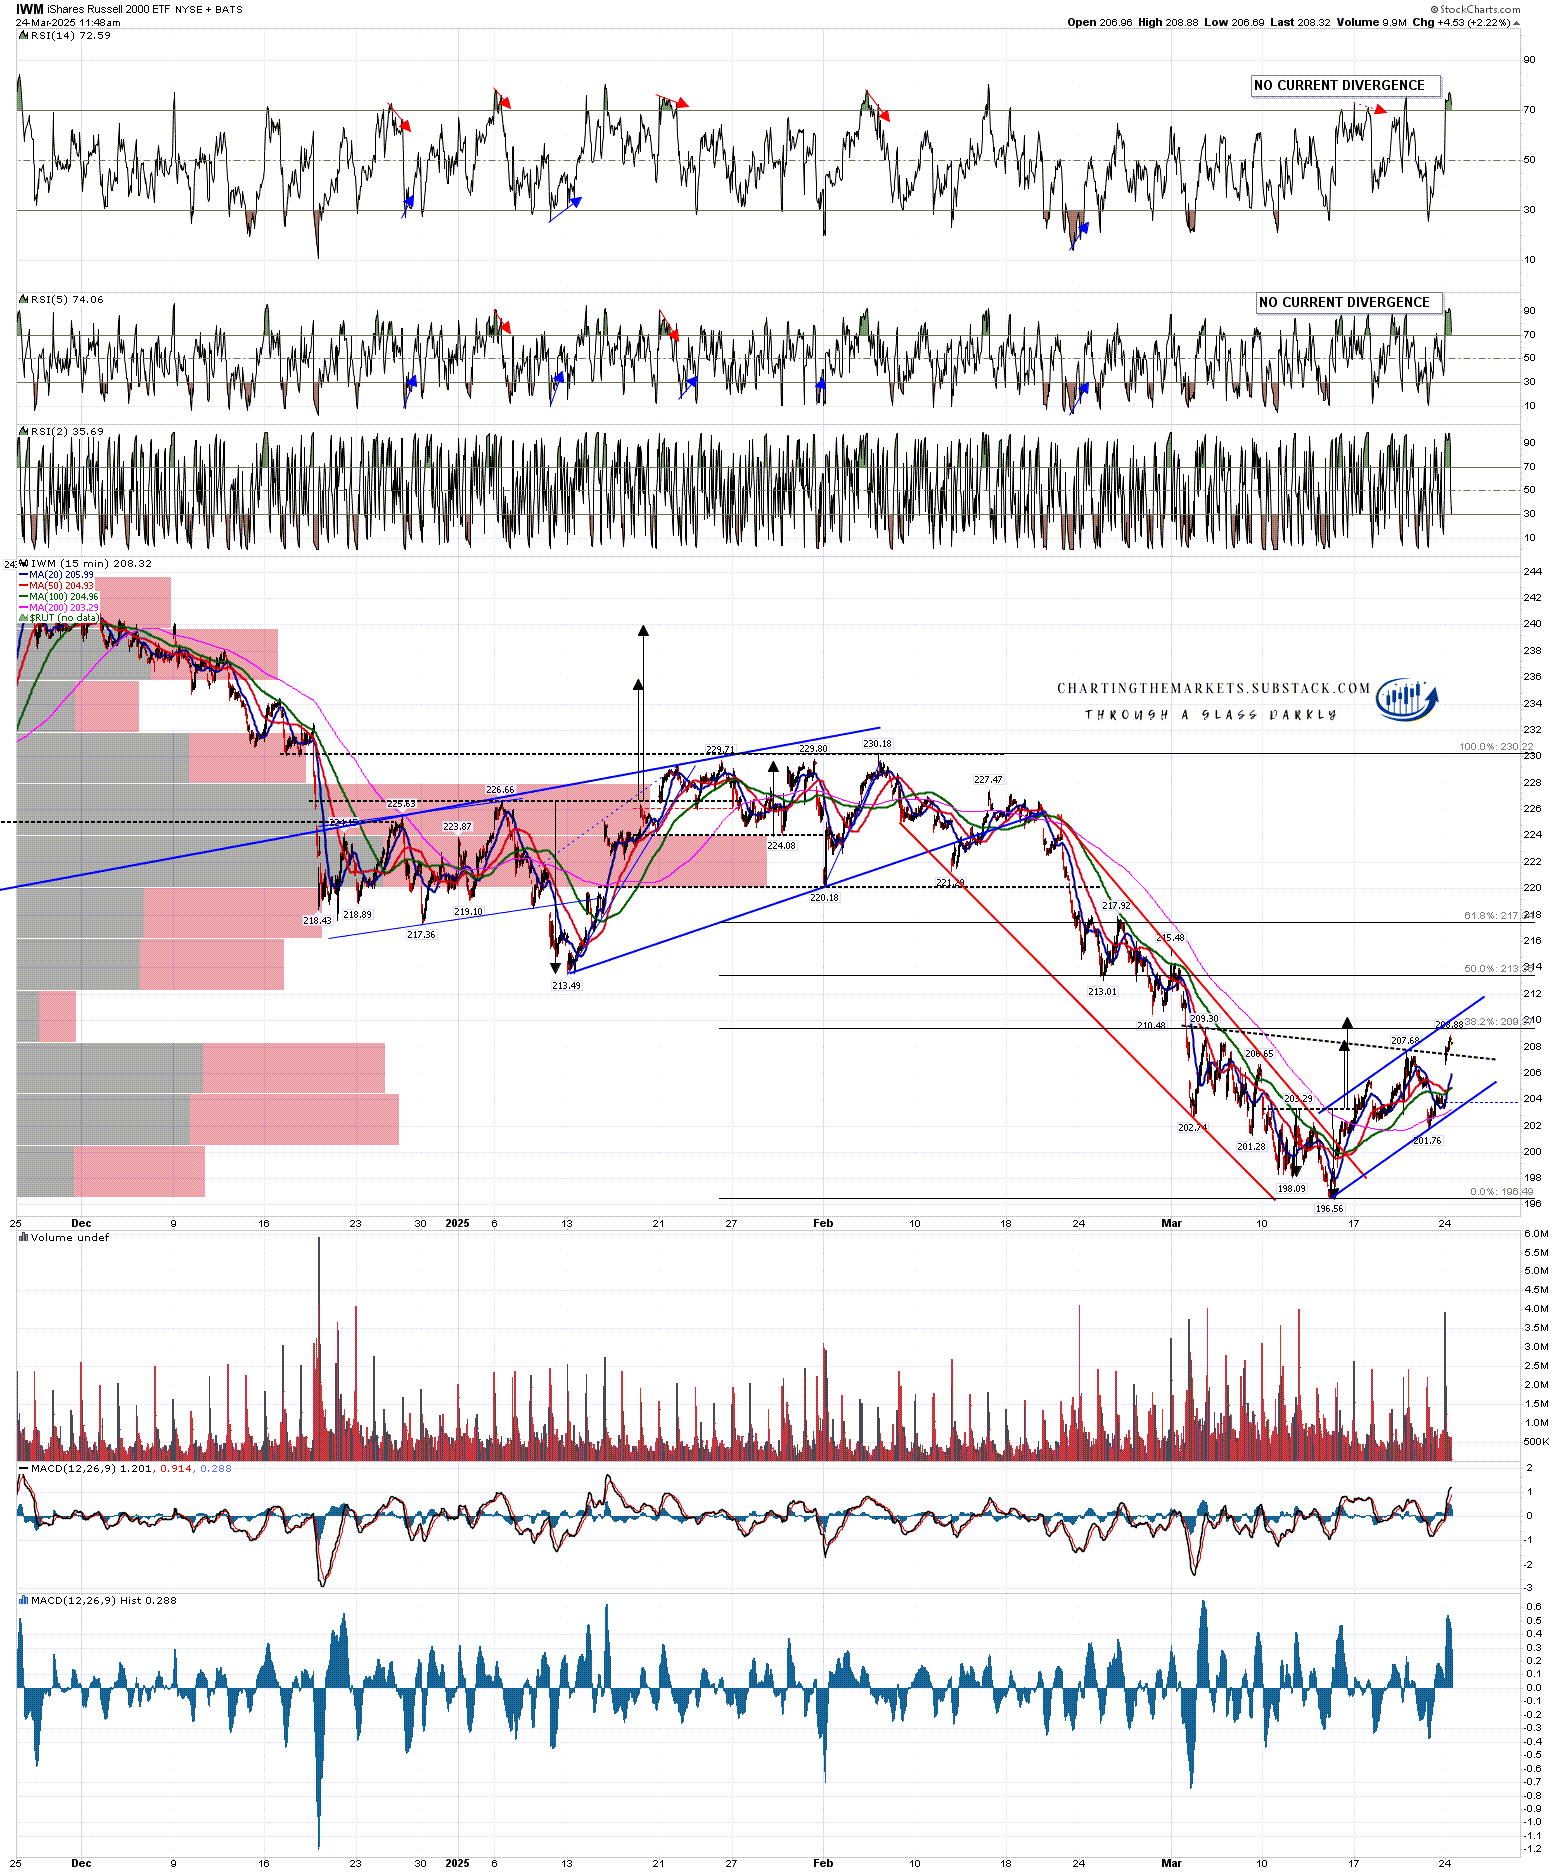
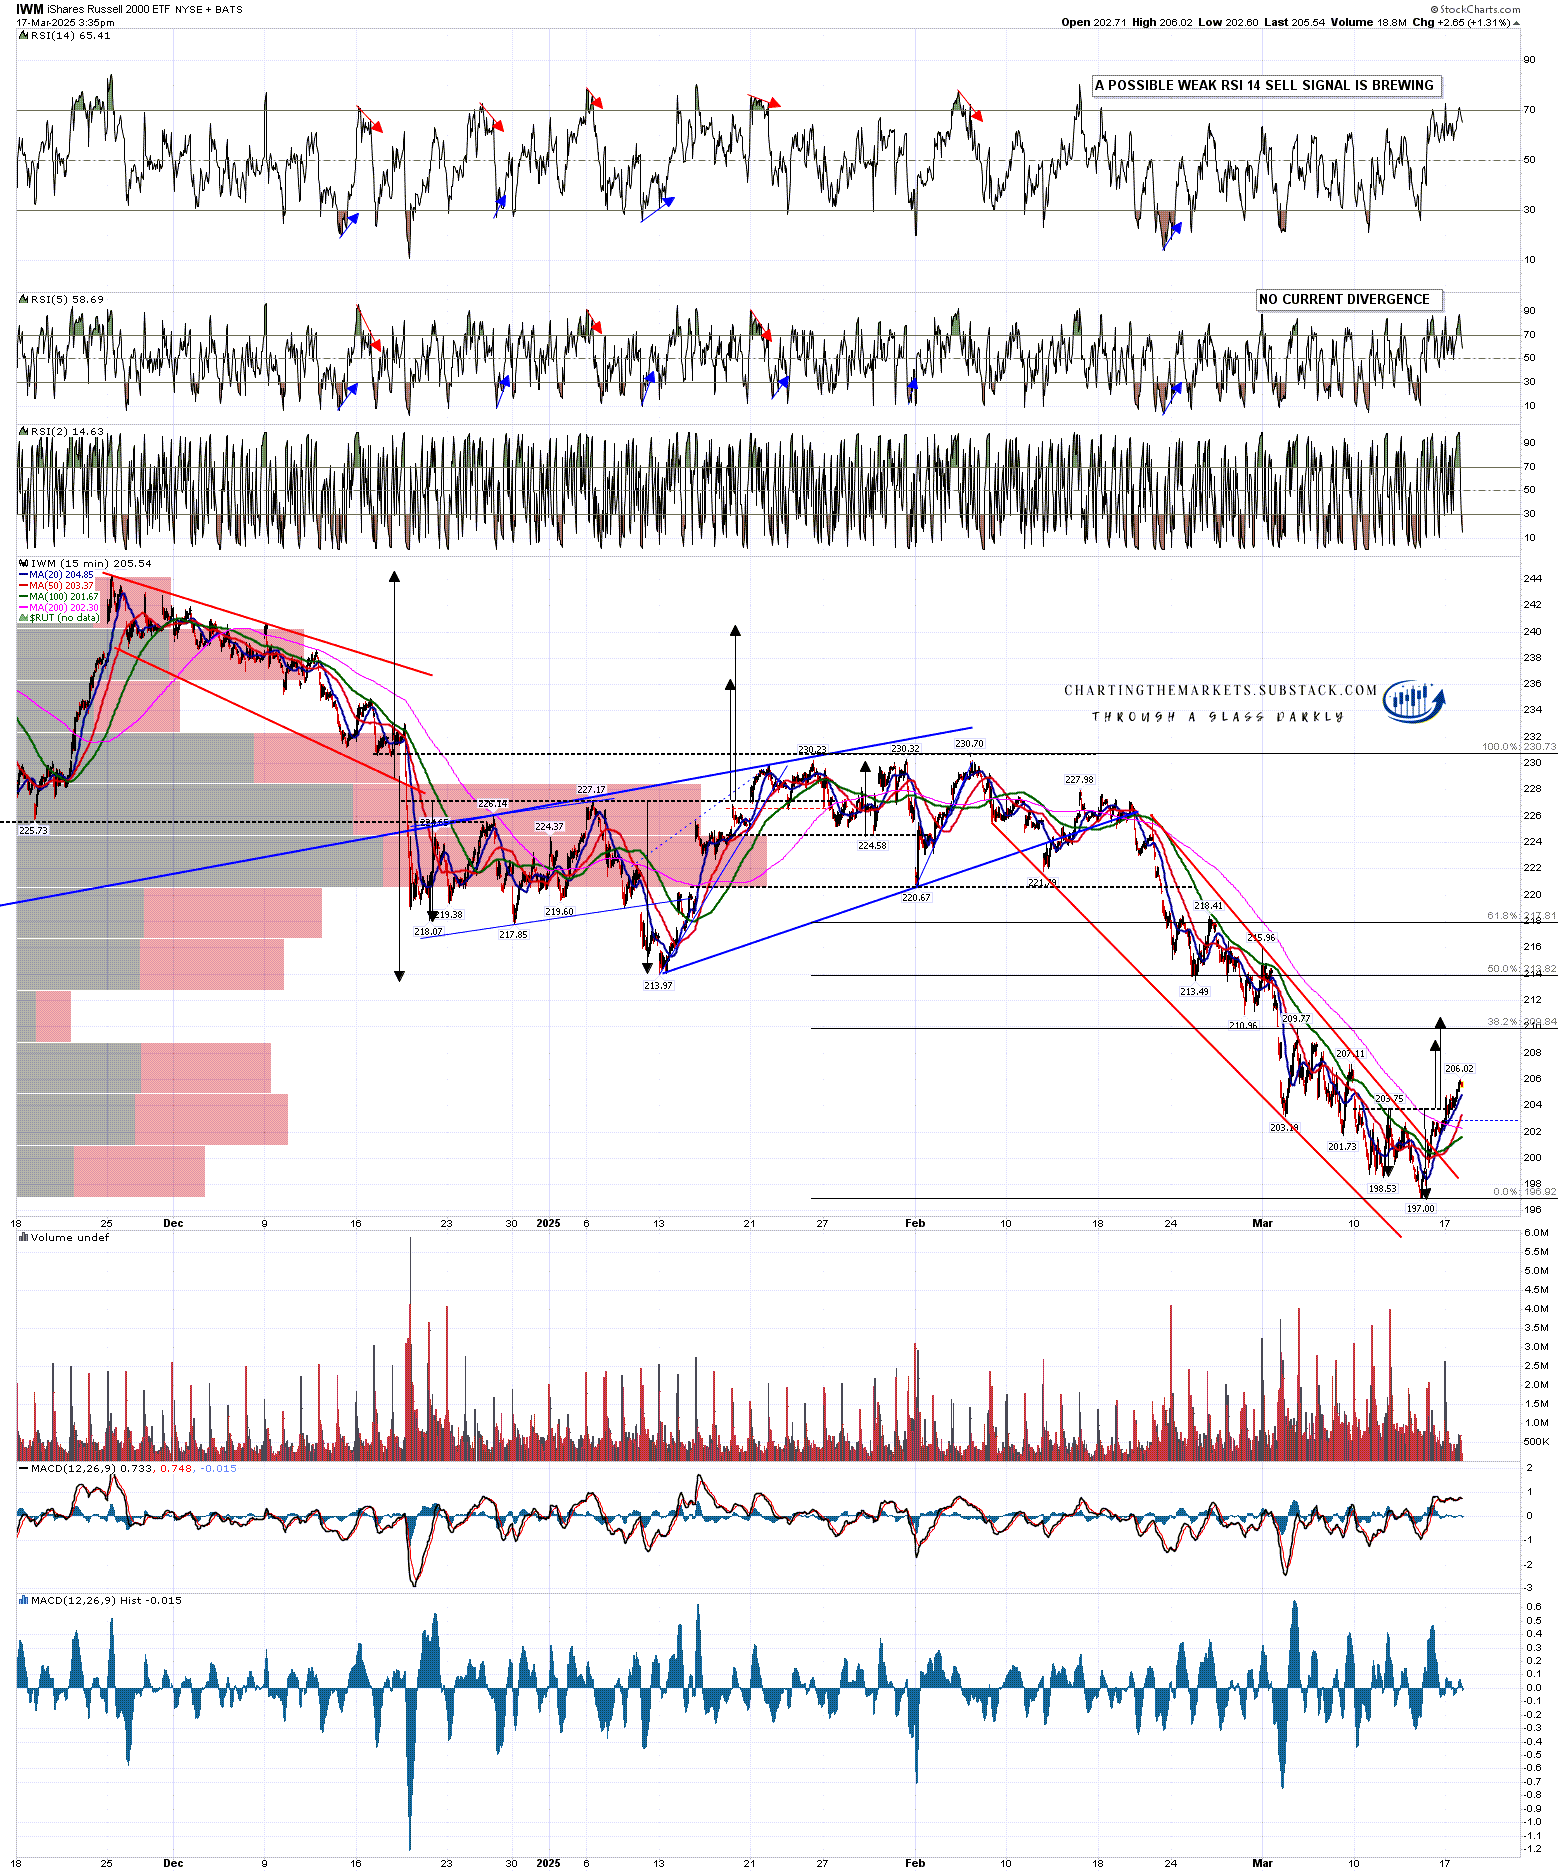
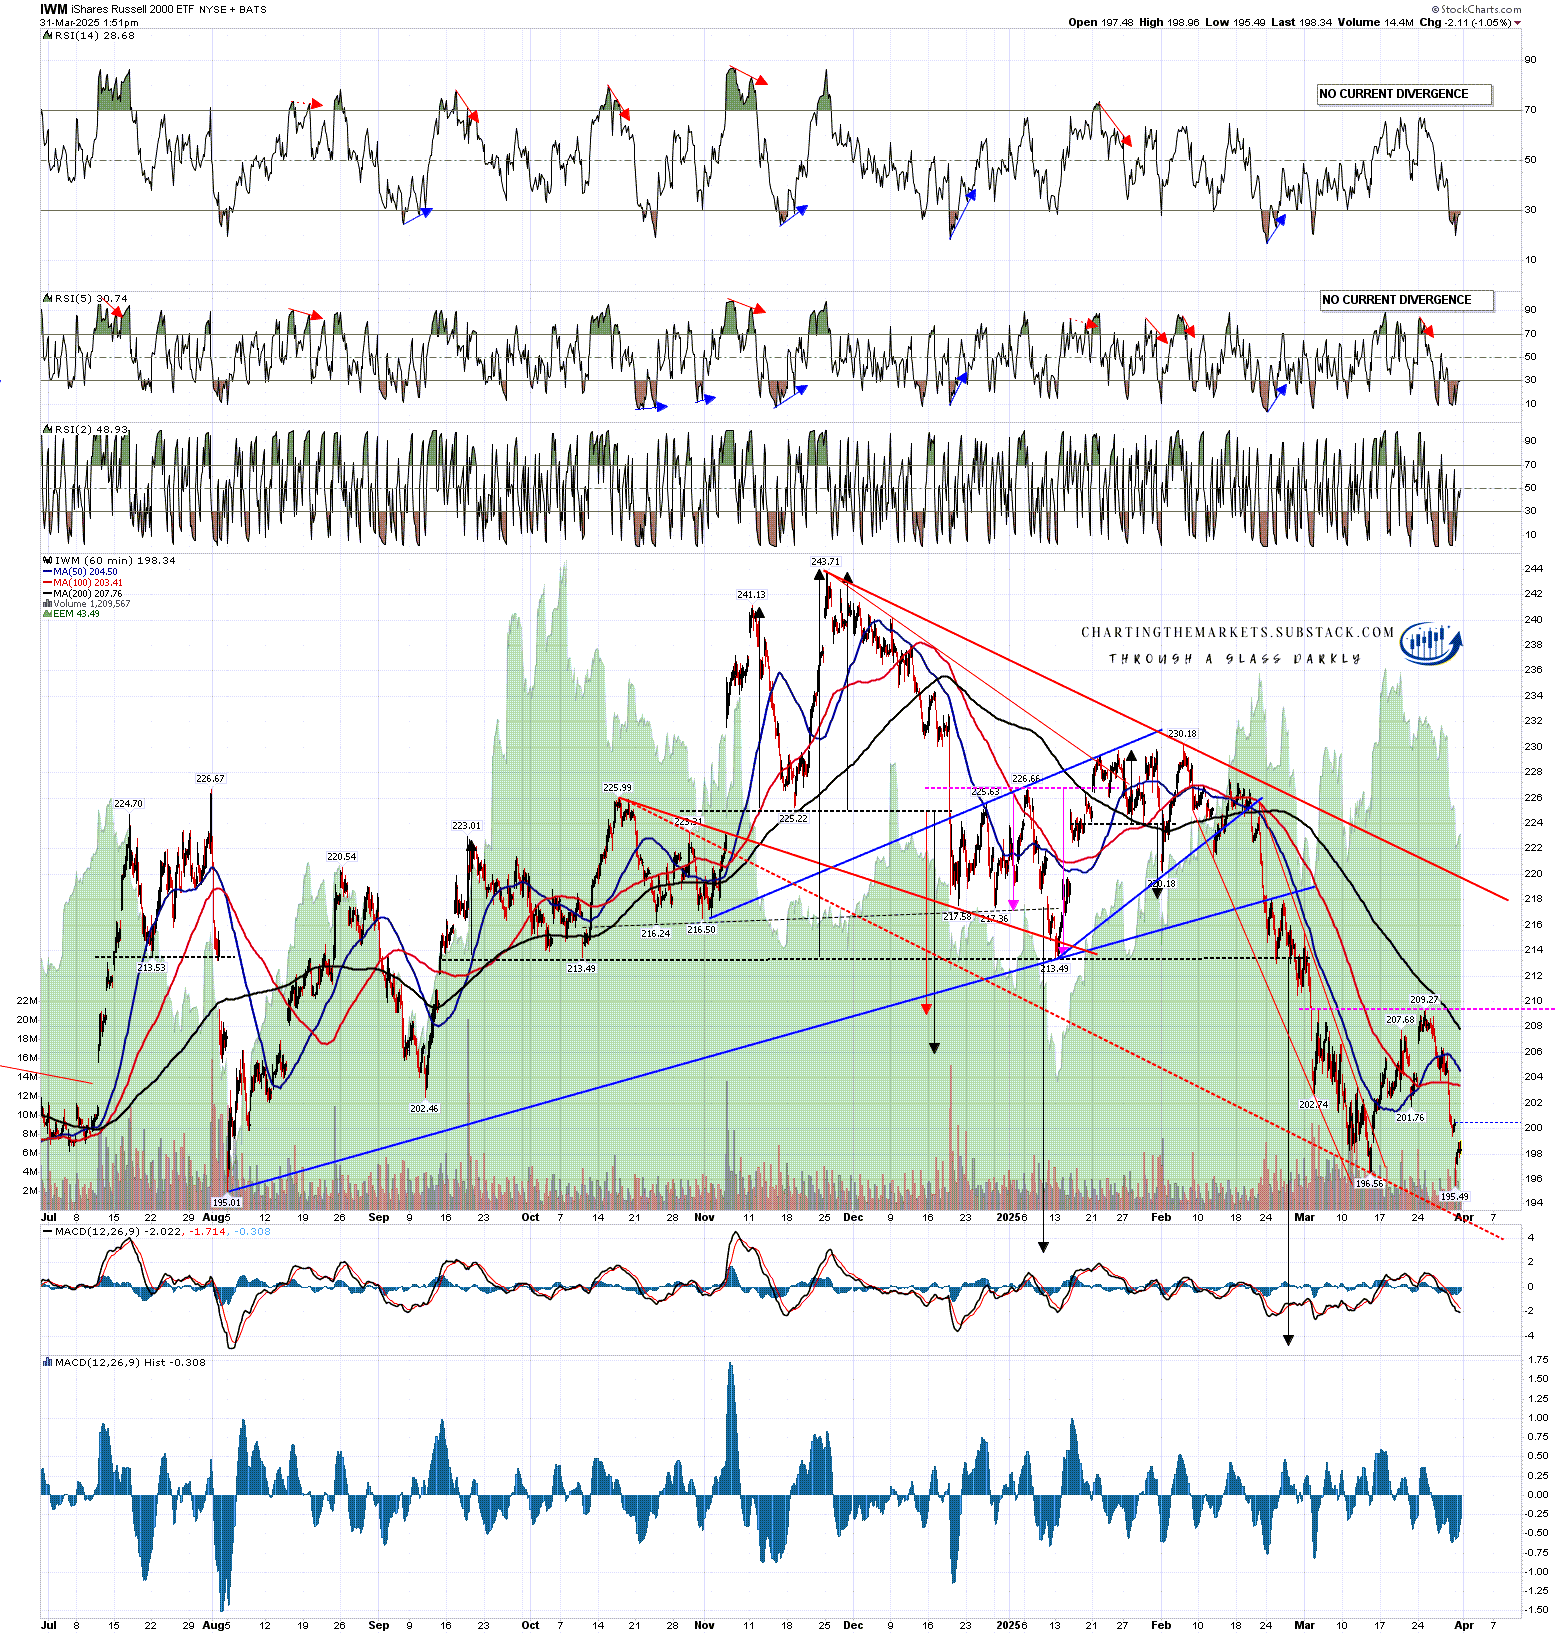
IWM has retested the 2025 low and has set up a high quality double bottom that on a sustained break back over double bottom resistance at 209.27 would look for a target in the 222-4 area, slightly over declining resistance from the all time high currently in the 220 area.

The open H&S target is still some distance below in the 183 area, and I am watching a good quality support trendline that is potential support and that I have marked on the chart below. That is currently in the 192.5 area, and declining of course. Unless this next leg down lasts into mid-May, this trendline would likely need to break in order for the H&S target to be reached.

IWM 60min chart:

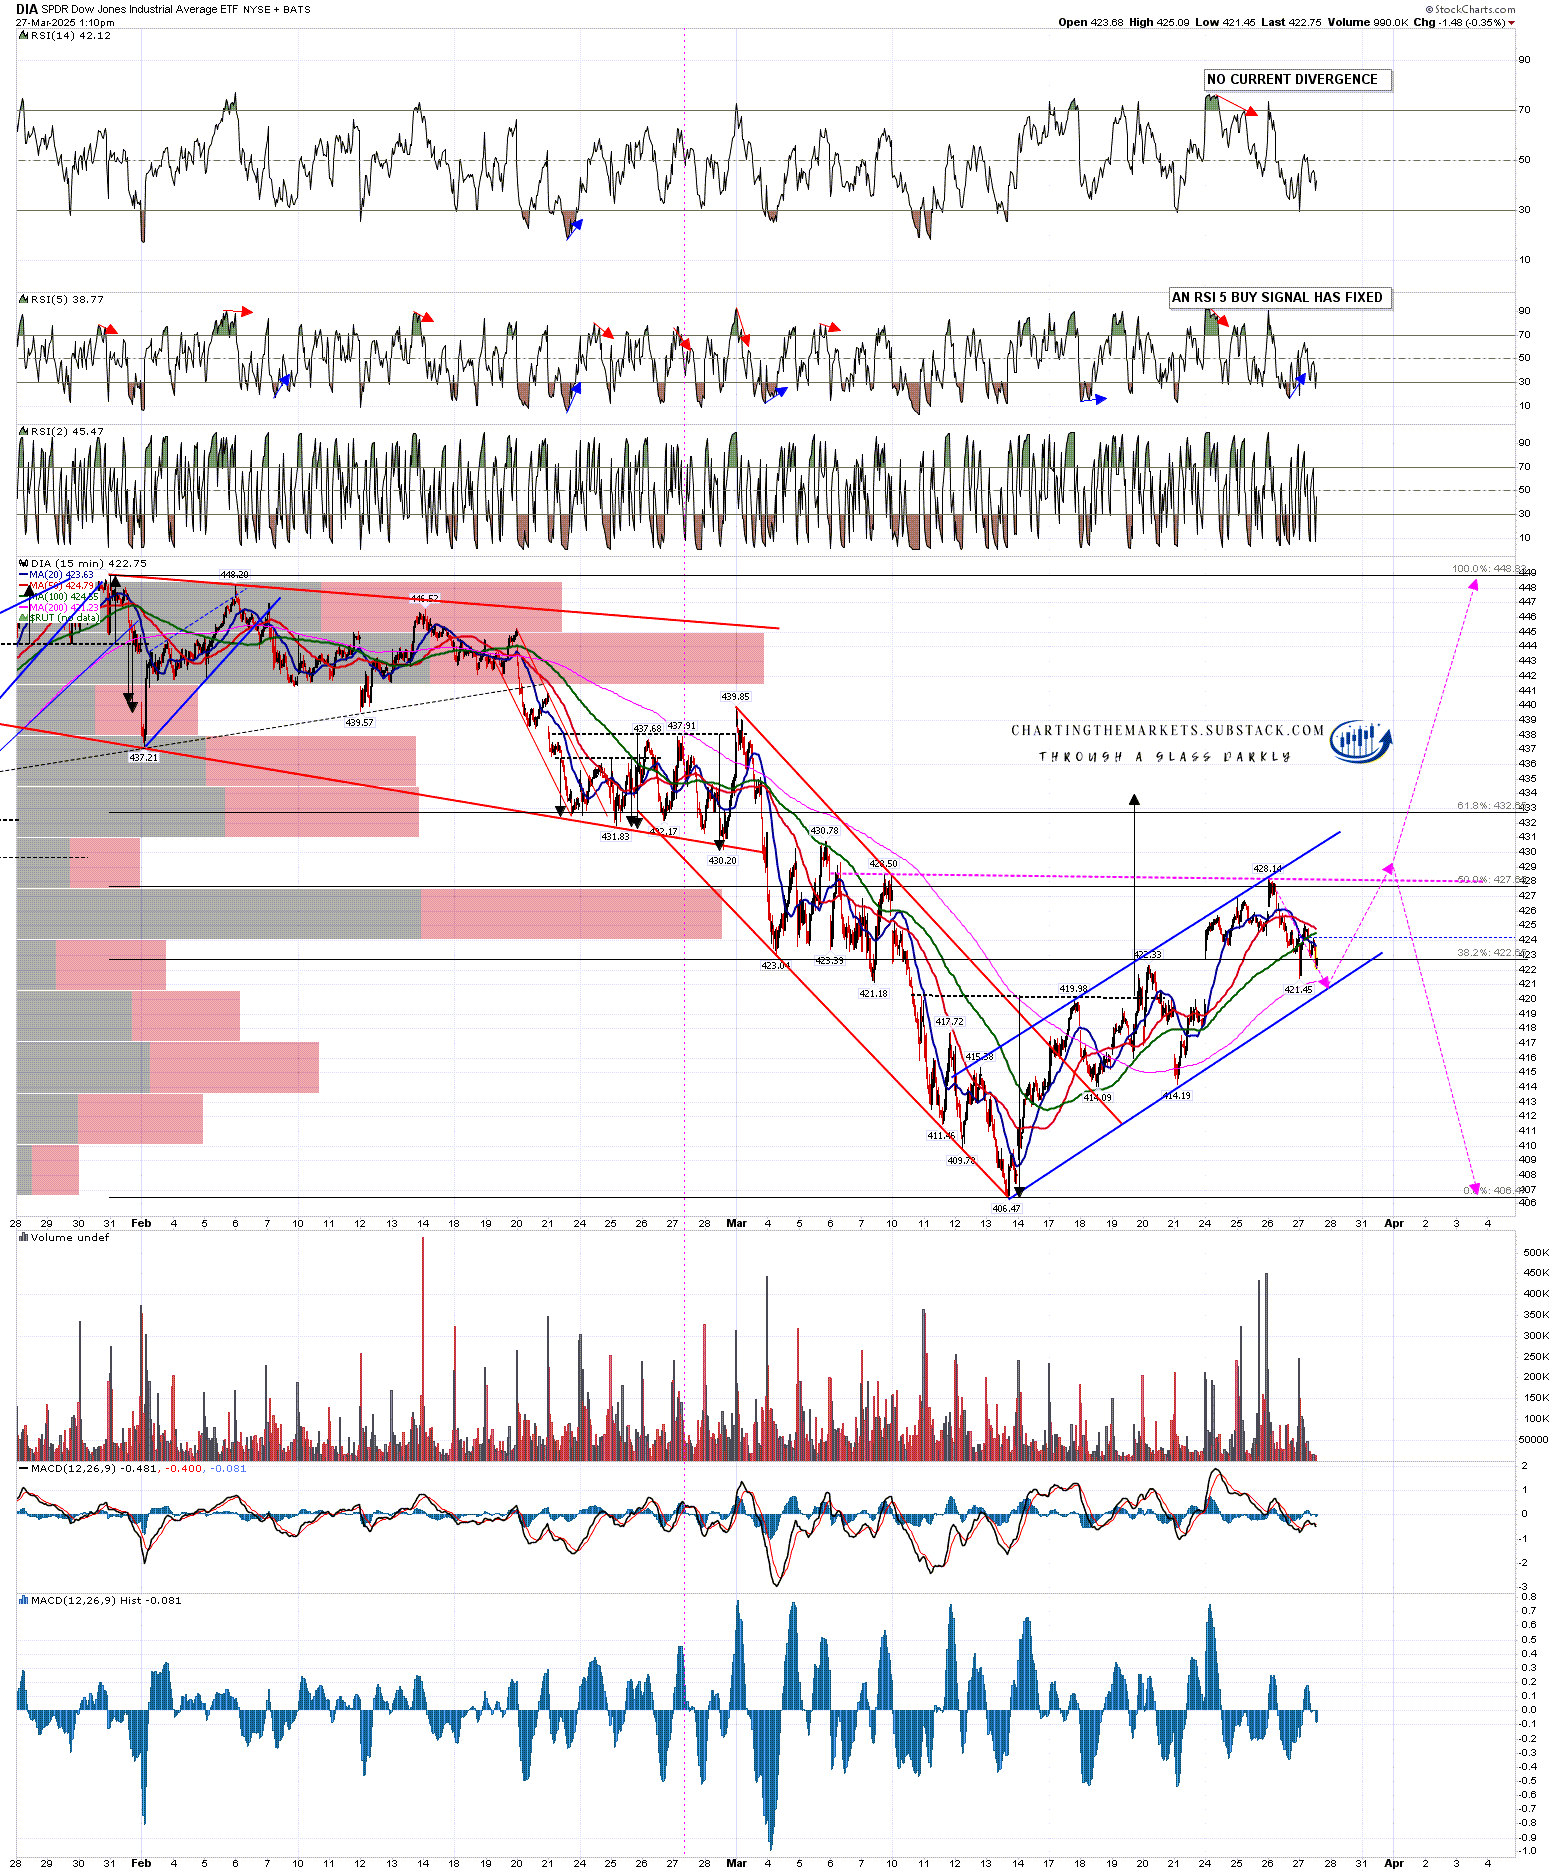
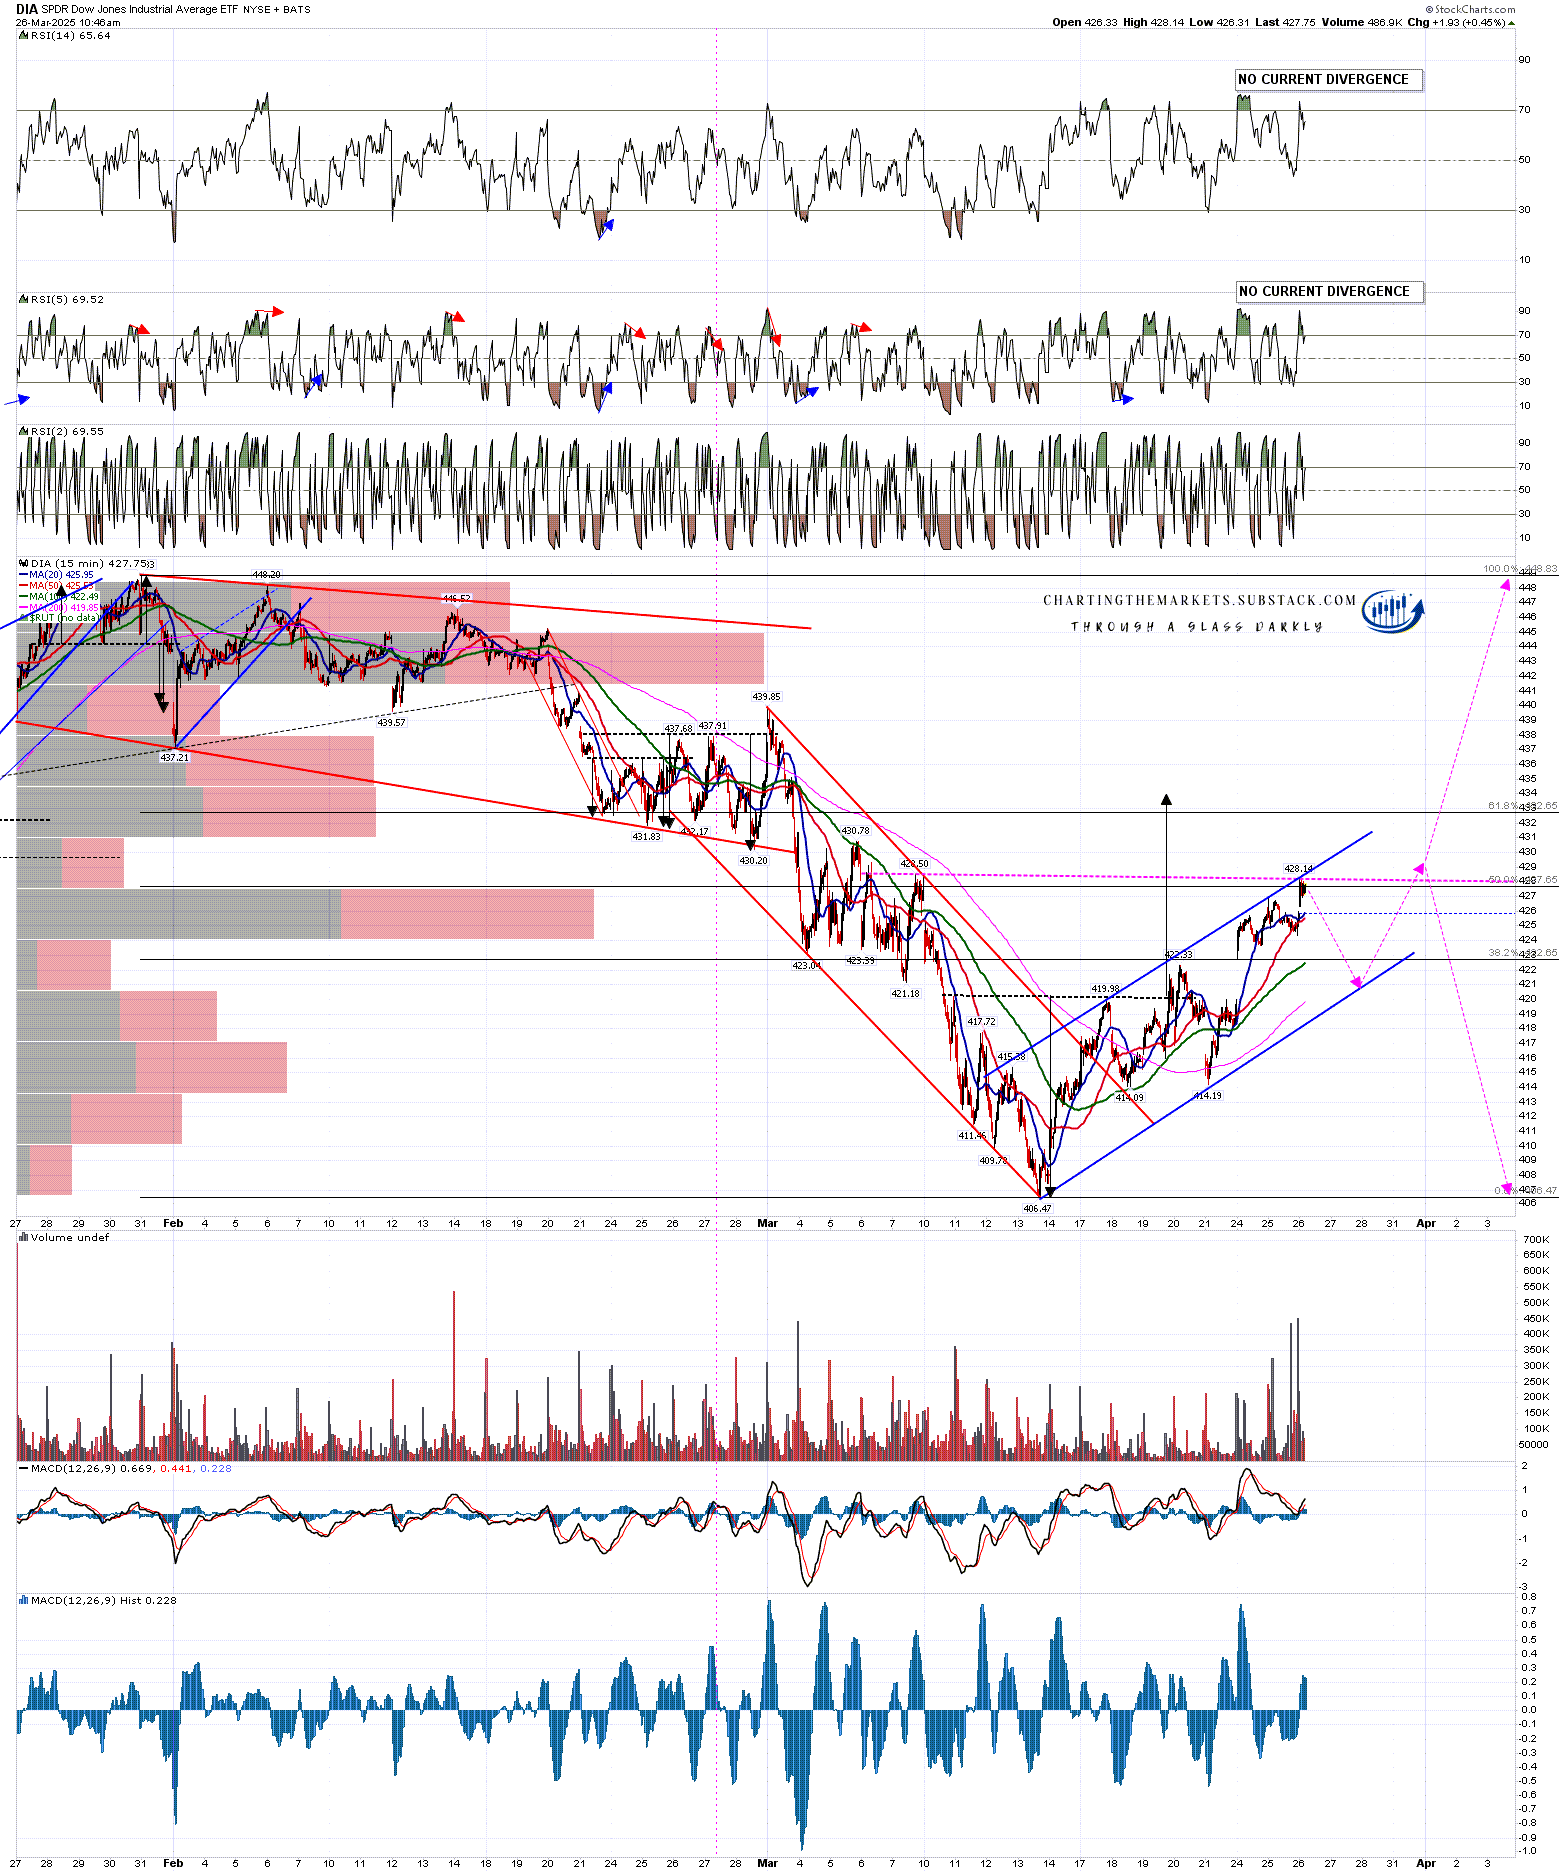
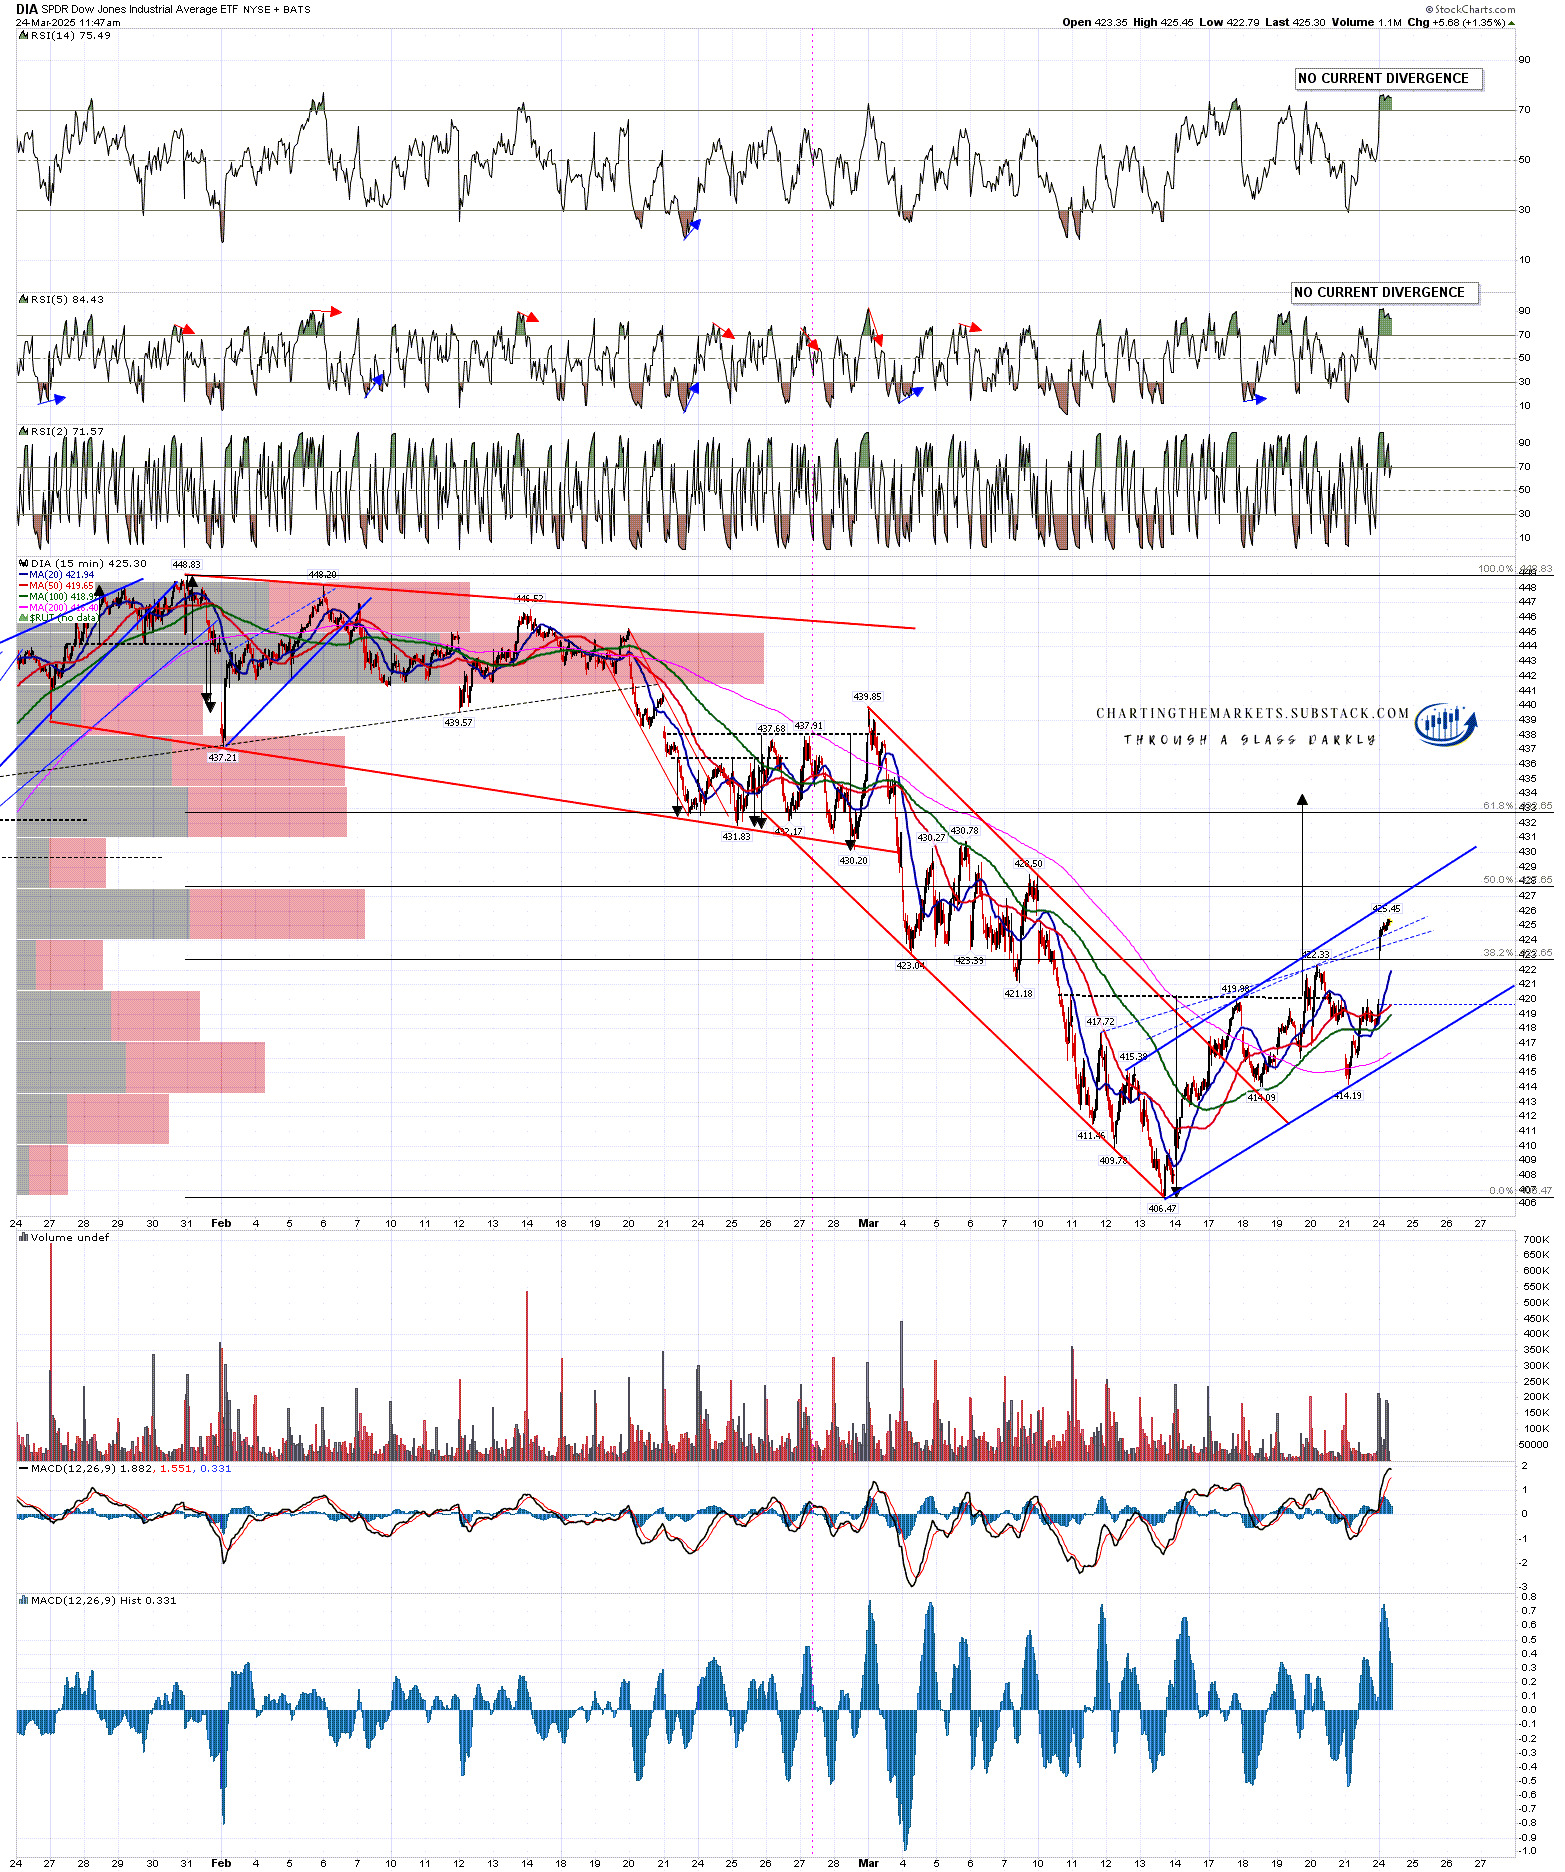
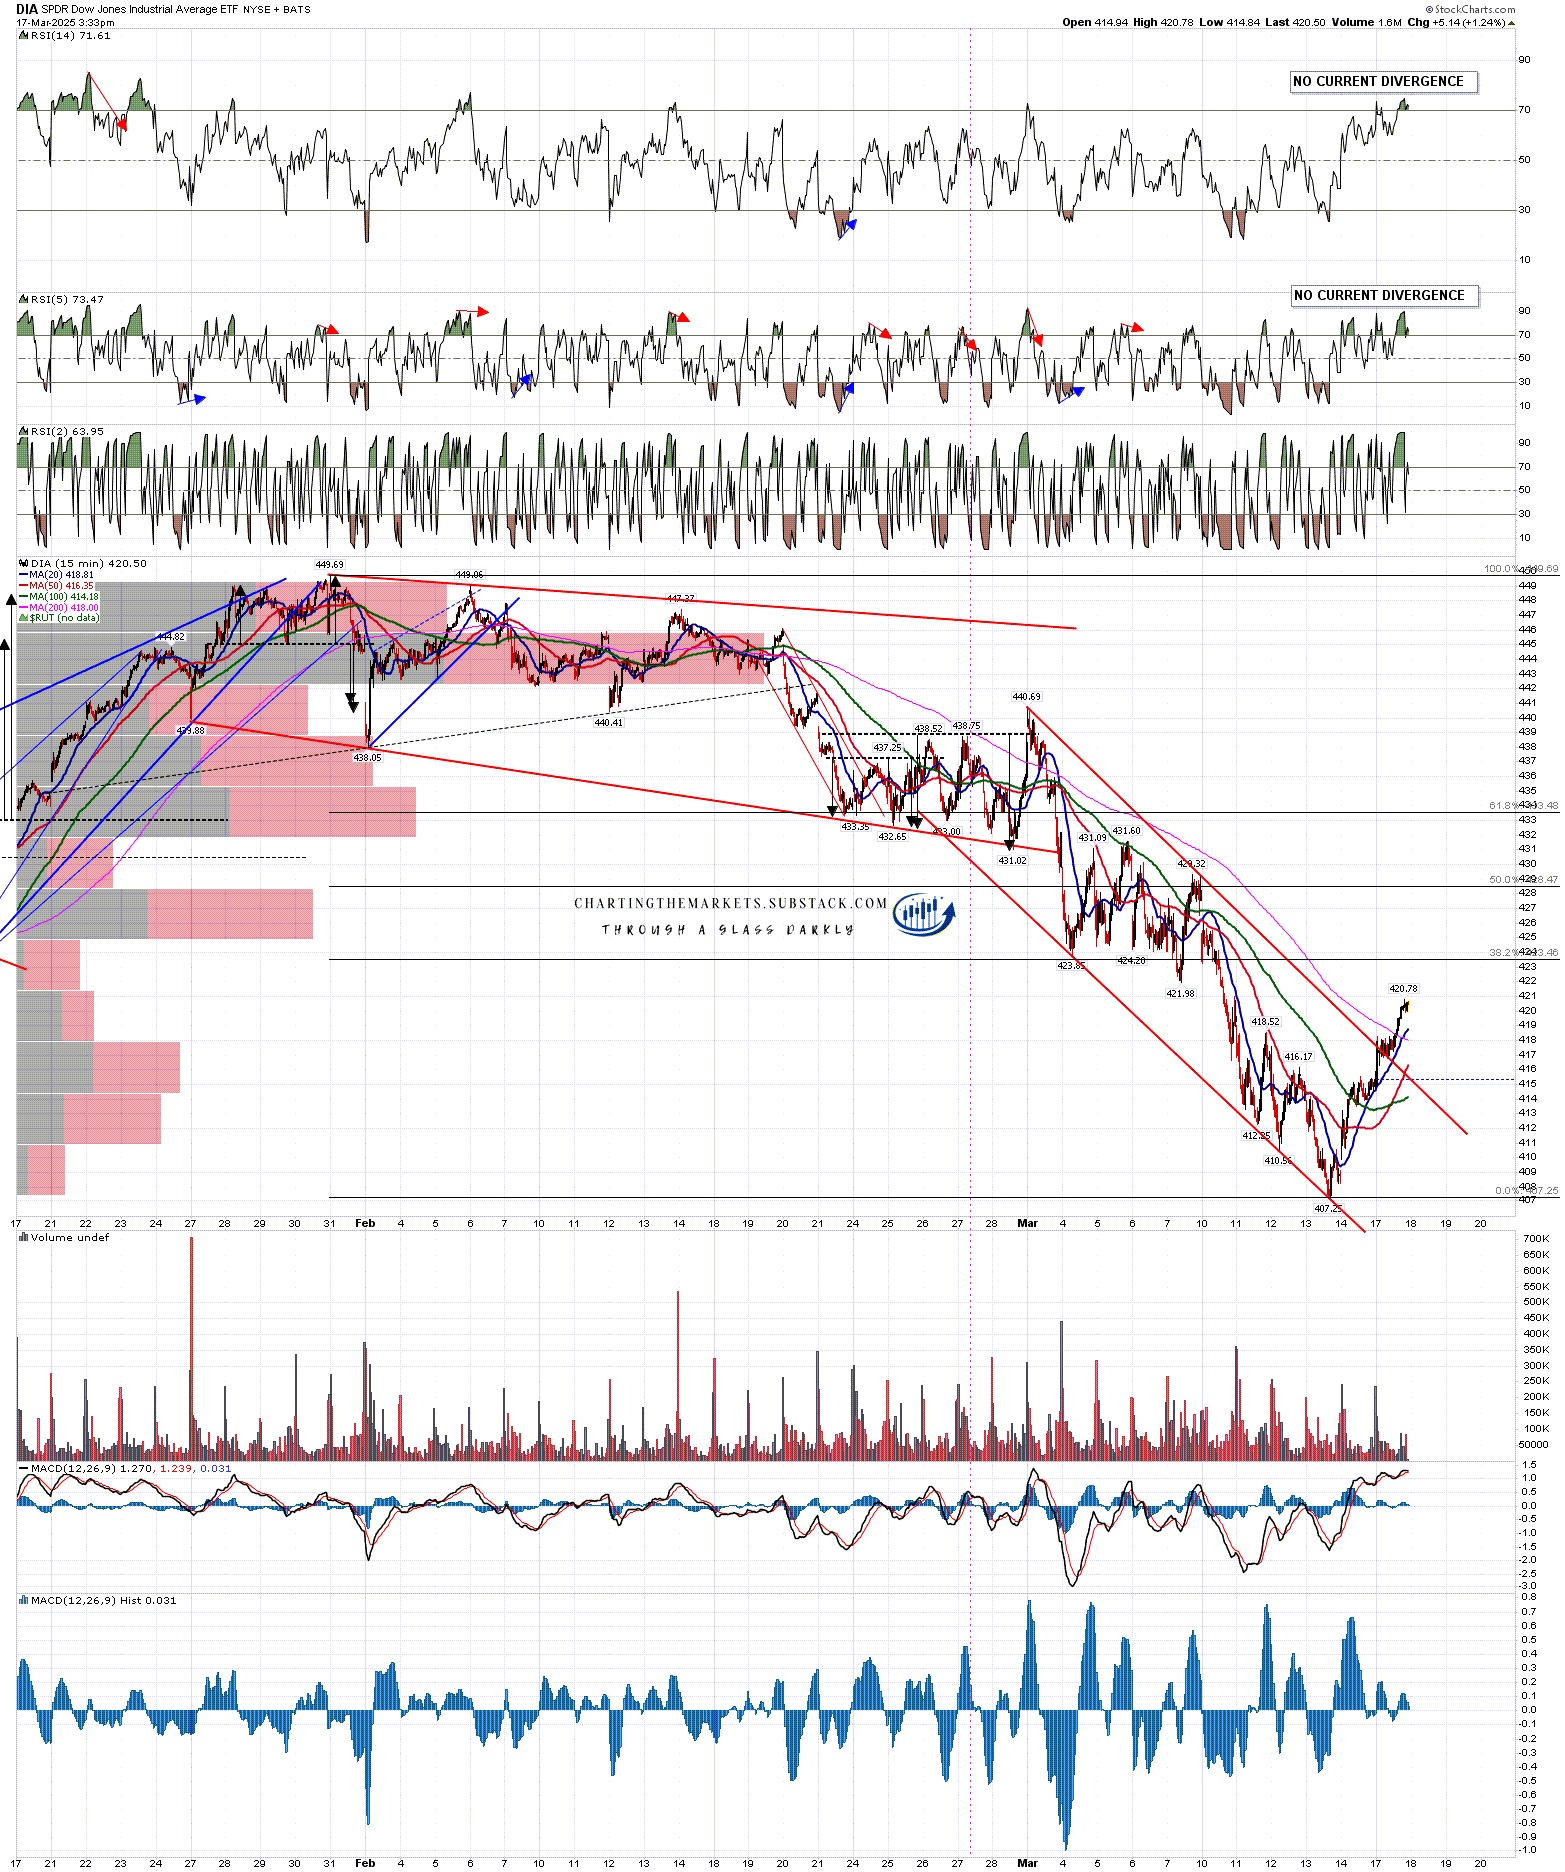
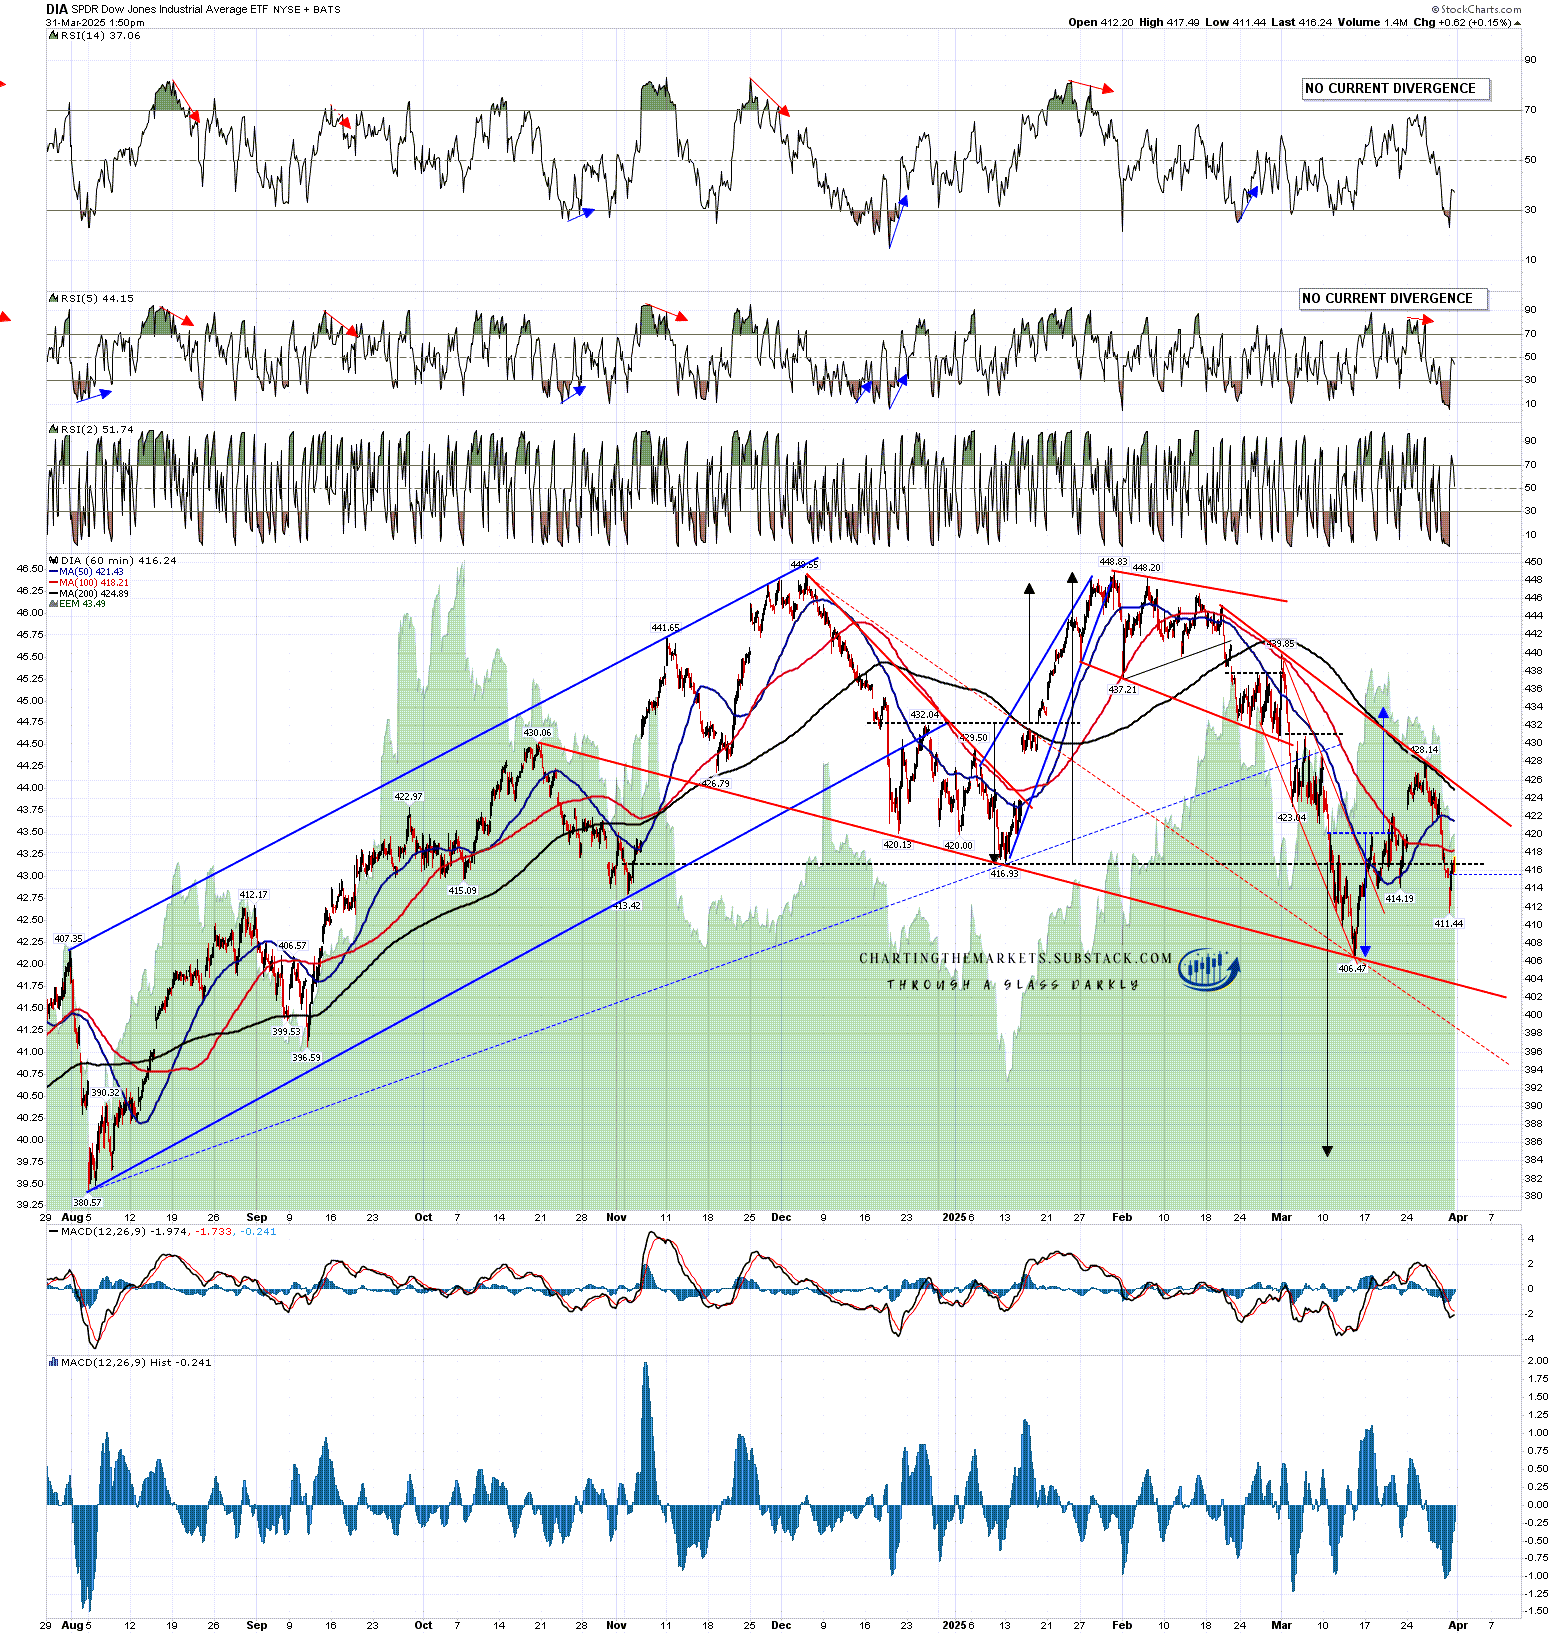
DIA has not yet retested the 2025 low, but likely will soon, ideally tomorrow. If seen, that would set up a possible double bottom that would have a target at a retest of the all time high at 448.83.

The open double top target is still a long way below at 384. I am watching two possible high quality support trendlines that are potential support and that I have marked on the chart below. Those are currently in the 404 and 399 areas, and declining of course. The higher trendline would likely need to be broken to reach this double top target, and unless this next leg down lasts into mid-May, the lower trendline would likely also need to break in order for the H&S target to be reached.

DIA 60min chart:

My working assumption here is that the April 2nd date for a major escalation of the trade war will go ahead as planned to a significant degree against most current US large trading partners, notably against the European Union, which so far appears to be particularly detested by the Trump administration. If so, I‘m expecting that will have a significant impact on economic growth and the equity markets. I’m working on another post to look at the tariffs issue and the big impact I think this may have on the US and other economies and on the US equity markets. I have done most of the research for that already and have split that into two posts. I’m aiming to publish both of those tomorrow morning.

As I have been since the start of 2025 I’m still leaning on the bigger picture towards a weak first half of 2025 and new all time highs later in the year, very possibly as a topping process for a much more significant high. One way or another I think we’ll be seeing lower soon and I’m not expecting this to be a good year for US equities, not least because both of the last two years have been banner years for US equities. A third straight year of these kinds of gains looks like a big stretch. I could of course however be mistaken. UPDATE 11th March 2025 - I am wondering if this may be a bear market that dominates the whole of 2025.

If you like my analysis and would like to see more, please take a free subscription at my chartingthemarkets substack, where I publish these posts first. I also do a premarket video every day on equity indices, bonds, currencies, energies, precious commodities and other commodities at 8.45am EST. If you’d like to see those I post the links every morning on my twitter, and the videos are posted shortly afterwards on my Youtube channel.

Thursday, 27 March 2025

It's A Kind Of Magic

One of the things I enjoy most about being a technical analyst is that sometimes we can make calls that almost look like magic as they deliver, though in truth they’re obviously just a combination of math, historical analysis and good pattern recognition. I also love an uncertain market, as while anyone can look like a genius in a strongly trending market, it takes real skill to trace the likely paths ahead in uncertain markets. Whatever else Trump has done or may yet do this year, he’s at least been delivering a an interesting year for me, and I thank him for that. :-)

Anyway, the story of this rally so far ……..

At the start of last week I wrote a post looking at the case for a rally on US equity indices in the 12 trading day window into April 2nd, the planned day for US tariffs to be extended to most US trade partners. That rally delivered but wasn’t been quite as strong as I hoped then, and I wrote another post on Monday in which I was looking at the bear flags forming on the US indices and talking about those moves topping out on Tuesday or Wednesday this week. Yesterday morning I wrote a third post calling a likely high within those bear flag patterns and sketching out in arrows my preferred path from there.

That call yesterday played out remarkably well so I’m doing an update post on that today, and will spend the rest of the day writing the longer term post that I have promised looking at the much lower targets on US equity indices that may be on the table if the promised trade war scheduled to start in earnest on Wednesday 2nd April is not cancelled or delayed.

First the daily charts. I was carefully watching the closes yesterday on SPX, QQQ, DIA and IWM to see if there were clear breaks below the daily middle bands on those indices. That didn’t happen, with closes just above or below the daily middle bands across the board. All of those closes were in a range I see as a close on the bands so, for now at least, the obvious support there has held on all of these.

SPX daily chart:

On the SPX 15min chart price pretty much exactly followed the arrow I drew. I would stress though that these arrows were more about the ideal target levels rather than the timing, so I’m not expecting that to continue to track like this.

The ideal target was at a test of the 5666.29 low area, and yesterday’s low was close at 5670.94. This forms a close ideal IHS right shoulder on my bullish IHS scenario, and possible double top support on my bearish double top and bear flag scenario.

I would also stress that the two paths I drew are just two scenarios, and there are others, but these are the ones I picked as the most obvious.

If the scenario I drew yesterday continues to play out then I’d expect to see a retest of the current rally high either tomorrow or Monday, forming a possible double top on the bear scenario and breaking up from a larger IHS on the bull scenario.

If there is very good economic news on or before April 2nd, then the IHS would look for the 6070 area. If, as I suspect, the tariff war goes ahead as planned on April 2nd, Trump’s ‘Liberation Day’, then SPX should reverse back to retest the March low at 5504.65 and may then go a lot lower. We will see.

SPX 15min chart:

On QQQ there was no touch of bear flag support, but the low yesterday at 480.25 was just above the ideal IHS right shoulder low at a test of the IHS left shoulder low at 479.81. If QQQ continues to follow the arrows then the next target would be a retest of the current rally high at 493.62, setting up the IHS there with a target in the 519.5 area, and setting up the double top that would have a target close to the March low at 465.74.

QQQ 15min chart:

On DIA there was no touch of bear flag support, but the low yesterday at 421.45 was just above the ideal IHS right shoulder low at a test of the IHS left shoulder low at 421.18. If DIA continues to follow the arrows then the next target would be a retest of the current rally high at 428.14 setting up the IHS there with a target in the 449 area, and setting up the double top that would have a target in the 415 area, but likely would also look for a retest of the March low at 406.47.

DIA 15min chart:

On IWM the bear flag support was broken, but the low yesterday at 203.76 was just above the ideal IHS right shoulder low at a test of the IHS left shoulder low at 202.76. If IWM continues to follow the arrows then the next target would be a retest of the current rally high at 209.27 setting up the IHS there with a target in the 222 area, and setting up the double top that would have a target in the 198.25 area, but likely would also look for a retest of the March low at 196.56.

IWM 15min chart:

My working assumption here is that the April 2nd date for a major escalation of the trade war will go ahead as planned to a significant degree against most current US large trading partners, notably against the European Union, which so far appears to be particularly detested by the Trump administration. If so, I‘m expecting that will have a significant impact on economic growth and the equity markets. I’m working on another post to look at the tariffs issue and the big impact I think this may have on the US and other economies and on the US equity markets. I have done most of the research for that already and may need to split that into two posts. If so I’ll aim to publish both of those tomorrow.

As I have been since the start of 2025 I’m still leaning on the bigger picture towards a weak first half of 2025 and new all time highs later in the year, very possibly as a topping process for a much more significant high. One way or another I think we’ll be seeing lower soon and I’m not expecting this to be a good year for US equities, not least because both of the last two years have been banner years for US equities. A third straight year of these kinds of gains looks like a big stretch. I could of course however be mistaken. UPDATE 11th March 2025 - I am wondering if this may be a bear market that dominates the whole of 2025.

If you like my analysis and would like to see more, please take a free subscription at my chartingthemarkets substack, where I publish these posts first. I also do a premarket video every day on equity indices, bonds, currencies, energies, precious commodities and other commodities at 8.45am EST. If you’d like to see those I post the links every morning on my twitter, and the videos are posted shortly afterwards on my Youtube channel.

Wednesday, 26 March 2025

Decent Quality Bear Flags on Crypto

In my post on Tuesday last week I was looking at the very promising rally setup on Crypto and was looking at the important daily middle band resistance that needed to be broken and converted to open the upside. That didn’t go quite as hoped and in my last post on Friday last week I put forward an alternate scenario where the IHS pattern on Bitcoin (BTCUSD) and Solana (SOLUSD) wouldn’t make targets as it was bear flags that were forming.

In my premarket post this morning I was looking at the bear flags and, coupled with the matching flags on US equity indices, was calling a likely high. We;'‘ll see how that goes.

On the Bitcoin 60min chart a good quality rising wedge bear flag has formed. A break below wedge support in the 86k area looks for a return to the March low at 76.6k.

BTCUSD 60min chart:

On the Solana 60min chart a good quality rising channel bear flag has formed. A break below channel support in the 130 area looks for a return to the March low at 112.19.

SOLUSD 60min chart:

On the Ethereum (ETHUSD) 60min chart a decent quality rising wedge bear flag has formed. A break below wedge support in the 1980 area looks for a return to the March low at 1754.47.

ETHUSD 60min chart:

On the bigger picture Bitcoin has broken down from a high quality double top with a target in the 69k to 70k area. My expectation is that Bitcoin will make this target in the next few weeks and this may be the start of that leg down.

BTCUSD daily chart:

On the much bigger picture I still think that talk of the next bear market on Crypto having already started is premature. It’s possible but there’s no compelling evidence for that so far. I think Bitcoin likely has some more downside coming but I think Solana and Ethereum may already be starting to make their lows for this move.

Against that the setup on equities is looking ncreasingly in favor of at least a technical bear market decline of 20% this year and possibly a lot more than that. If so, that could drag Crypto down into a full bear market with it. We’ll see. Everyone have a great weekend :-)

So far this year I have been and am still leaning towards seeing weakness in the first half of the year and renewed strength in the second half of 2025, with a very possible bull market high on Crypto pencilled in close to the end of the year. That scenario would be a good match with past Crypto bull markets. Is it possible that I am mistaken? Always, but we can only ever try to identify the higher probability paths in the future. Only time can show us the path that is actually taken. Still, I’m with Confucious who said ‘study the past, if you would divine the future’.

If you’d like to see more of these posts and the other Crypto videos and information I post, please subscribe for free to my Crypto substack. I also do a premarket video every day on Crypto at 9.05am EST. If you’d like to see those I post the links every morning on my twitter, and the videos are posted shortly afterwards on my Youtube channel.

I'm also to be found at Arion Partners, though as a student rather than as a teacher. I've been charting Crypto for some years now, but am learning to trade and invest in them directly, and Arion Partners are my guide around a space that might reasonably be compared to the Wild West in one of their rougher years.


The Bear Flags Look Ready

At the start of last week I wrote a post looking at the case for a rally on US equity indices in the 12 trading day window into April 2nd, the planned day for US tariffs to be extended to most US trade partners. That rally delivered but hasn’t been quite as strong as I hoped, and I wrote another post on Monday in which I was looking at the bear flags forming on the US indices and talking about those moves topping out yesterday or today.

So here we are, the bear flags are all formed and today is the day I was expecting these to top out if that didn’t happen yesterday. We’ll see if that happens and if it does, then I have sketched out a possible ideal path that this reversal may take.

First though I’ll show the SPX daily chart where SPX broke back over the daily middle band, currently at 5716, on Monday and then the 200dma, currently at 5756, yesterday. If this is a bullish break then this would be where SPX would convert these levels back to support or, if this is a failed bullish break, SPX would reject back below these levels, and most likely, that would happen today.

SPX daily chart:

I laid out the main decline options in my premarket video today, and I’ve sketched my favorite of these out on the 15min charts below. Something to note here is that all of the indices below have reached possible IHS necklines so any initial decline may be forming a bullish IHS right shoulder for a break higher that could happen in the event that the current April 2 tariff plans are delayed or abandoned altogether. I don’t think that is that likely but the setup is there so I have sketched that in too. Since I did the premarket video ES has declined almost 40 handles and I suspect this move has now started.

These are not the only options, but are my preferred options. One notable alternative option is a direct return on all of these to retest the March lows.

On SPX I’d be looking for an initial decline back into the ideal right shoulder low area around 5666, then a retest of the current rally high at 5787, then either a break higher or, more likely, a break back down towards a retest of the March low at 5504.65.

SPX 15min chart:

On QQQ I’d be looking for an initial decline back into the ideal right shoulder low area around 480, then a retest of the current rally high at 493/4, then either a break higher or, more likely, a break back down towards a retest of the March low at 465.74.

QQQ 15min chart:

On DIA I’d be looking for an initial decline back into the ideal right shoulder low area around 421, then a retest of the current rally high at 428, then either a break higher or, more likely, a break back down towards a retest of the March low at 406.47.

DIA 15min chart:

On IWM I’d be looking for an initial decline back into the ideal right shoulder low area around 202/3, then a retest of the current rally high at 209/10, then either a break higher or, more likely, a break back down towards a retest of the March low at 196.56.

IWM chart:

My working assumption here is that the April 2nd date for a major escalation of the trade war will go ahead as planned to a significant degree against most current US large trading partners, notably against Europe, which appears to be particularly detested by the Trump administration. If so, I‘m expecting that will have a significant impact on economic growth and the equity markets so I am planning a post either tomorrow or Friday looking at the lower targets that might then be reached on these US equity indices if we are seeing another big leg down on equities start here.

As I have been since the start of 2025 I’m still leaning on the bigger picture towards a weak first half of 2025 and new all time highs later in the year, very possibly as a topping process for a much more significant high. One way or another I think we’ll be seeing lower soon and I’m not expecting this to be a good year for US equities, not least because both of the last two years have been banner years for US equities. A third straight year of these kinds of gains looks like a big stretch. I could of course however be mistaken. UPDATE 11th March 2025 - I am wondering if this may be a bear market that dominates the whole of 2025.

If you like my analysis and would like to see more, please take a free subscription at my chartingthemarkets substack, where I publish these posts first. I also do a premarket video every day on equity indices, bonds, currencies, energies, precious commodities and other commodities at 8.45am EST. If you’d like to see those I post the links every morning on my twitter, and the videos are posted shortly afterwards on my Youtube channel.

Monday, 24 March 2025

Halfway Through The Rally Window

A week ago I wrote a post looking at the case for a rally on US equity indices in the 12 trading day window into April 2nd, the planned day for US tariffs to be extended to most US trade partners. That rally has delivered so far but hasn’t been as strong as I hoped, and I want to look today at the rally patterns that have been forming, and what I’m expecting to see over the rest of the rally window.

In my The Bigger Picture video yesterday I was looking at these rally patterns and saying that the initial bottoming pattern target might not all be reached as US indices appeared to be forming bear flags. I was saying that the next obvious move would be another leg up into new rally highs across the board, but that the rally might fail soon after, possibly on Tuesday or Wednesday this week.

In that video I was also looking at the likely impact of these tariffs, described that as being in a likely range between bad and very very bad, and looking at the obvious target areas on US indices if another big leg down starts at the end of the current rally. I’m planning a post looking at these tomorrow or Wednesday but that’s partly already covered in yesterday’s video if you want to see that now.

On to the rally. A week ago, based on previous instances of tests of the 3sd weekly lower bands, I was predicting a minimum two week rally or slightly less, and likely minimum 7% rally from the previous week’s lows. That minimum would see a rally high earliest in the middle of this week, and with the SPX March low at 5504.65, the high so far today at the time of writing, is a rally of 4.76% from the low. A rally of 7% would take SPX into the 5889 area but the pattern setup is suggesting that this rally may top out lower and sooner than that. Let’s have a look at those setups.

On the SPX chart a small double bottom had formed and broken up with a target in the 5760 to 5780 range. That made target this morning but a very possible bear flag rising wedge has been forming and the obvious trendline resistance for that is now slightly higher than price, currently in the 5775-80 area.

There was an old hourly RS14 buy signal fixed, which reached the possible near miss target this morning, and a fixed daily RSI 5 buy signal which will reach the possible near miss target at the close today if price remains strong for the rest of the day.

SPX 15min chart:

On the QQQ chart a small double bottom had formed and broken up with a target in the 495 area. That hasn’t made target yet, and may not, but a very possible bear flag rising megaphone has been forming and the obvious trendline resistance for that is now slightly higher than price, currently in the 493 area.

There was an old hourly RS14 buy signal fixed, which reached the possible near miss target this morning, and a fixed daily RSI 5 buy signal which will reach the possible near miss target at the close today if price remains strong for the rest of the day.

QQQ 15min chart:

On the DIA chart there was no reversal pattern formed a week ago but I suggested then that an IHS right shoulder might form and then the IHS break up with a target in the 434 area. That happened but DIA is a long way short of that target and I am doubtful about that delivering. A very possible bear flag rising megaphone wedge has been forming and the obvious trendline resistance for that is now slightly higher than price, currently in the 427 area.

There was an old hourly RS14 buy signal fixed, which reached the possible near miss target this morning. A daily RSI 5 buy signal had previously also fixed but had already failed by the time the rally started.

DIA 15min chart:

On the IWM chart a small double bottom had formed and broken up with a target in the 208.5 to 210 range. That has reached the target area this morning. A very possible bear flag rising channel has been forming and the obvious trendline resistance for that is now slightly higher than price, currently in the 210 area.

There was an old hourly RS14 buy signal fixed, which reached the possible near miss target this morning, and a fixed daily RSI 5 buy signal which will reach the possible near miss target at the close today if price remains strong for the rest of the day.

IWM 15min chart:

A week ago I was saying that the key rally target and resistance would likely be the daily middle bands. Those are all now being tested this morning. If we see closing breaks above those today then a rejection back below would likely happen tomorrow or, if not tomorrow, then on Wednesday.

SPX daily chart:

Are there options to form larger IHS patterns to take the rally much higher on SPX, QQQ and IWM? Yes, and I have marked in the one on the IWM chart that has actually already formed and broken up with a target in the 220 area. In the absence of some very good news in the next few days though, I’m not taking these seriously, though I will be watching them.

Overall equity indices have now reached an area where most of the initial bottoming patterns have now reached target, and if we see a strong close today, then all of the daily and hourly buy signals will also have reached at least the possible near miss target.

As I have been since the start of 2025 I’m still leaning on the bigger picture towards a weak first half of 2025 and new all time highs later in the year, very possibly as a topping process for a much more significant high. One way or another I think we’ll be seeing lower soon and I’m not expecting this to be a good year for US equities, not least because both of the last two years have been banner years for US equities. A third straight year of these kinds of gains looks like a big stretch. I could of course however be mistaken. UPDATE 11th March 2025 - I am wondering if this may be a bear market that dominates the whole of 2025.

If you like my analysis and would like to see more, please take a free subscription at my chartingthemarkets substack, where I publish these posts first. I also do a premarket video every day on equity indices, bonds, currencies, energies, precious commodities and other commodities at 8.45am EST. If you’d like to see those I post the links every morning on my twitter, and the videos are posted shortly afterwards on my Youtube channel.

Friday, 21 March 2025

Rally Failing So Far On Crypto

In my last post on Tuesday I was looking at the very promising rally setup on Crypto and was looking at the important daily middle band resistance that needed to be broken and converted to open the upside. So far, that has not been going well and while the rally setup hasn’t failed yet, it may well be failing.

On the Bitcoin (BTCUSD) chart, there was a clear break back above the daily middle band on Wednesday, then a clear rejection back below yesterday. That was not promising, as more often than not this delivers a low retest.

BTCUSD daily chart:

On Solana (SOLUSD) resistance at the daily middle band was tested on Wednesday and held again.

SOLUSD daily chart:

On Ethereum (ETHUSD) resistance at the daily middle band was tested on Wednesday and held again.

ETHUSD daily chart:

On the Bitcoin hourly chart the IHS that has broken up with a target in the 92000 area has not yet failed, but will fail with a target at a retest of the lows on a break below the right shoulder low at 79.9k. A high quality bear flag falling wedge has also been forming though that hasn’t broken down yet.

BTCUSD 60min chart:

On the Solana hourly chart the IHS that has broken up with a target in the 152 area has not yet failed, but will fail with a target at a retest of the lows on a break below the right shoulder low at 120.74.

SOLUSD 60min chart:

So what happens if these two IHS patterns fail? Most likely a retest of the retracement lows on Bitcoin, at 78.2k, and Solana, at 112.19. They could hold those levels as the second lows of double bottoms but there is of course still an open double top target on the Bitcoin chart with a target in the 69k to 70k area, and we might well see continuation down to that target directly.

BTCUSD weekly chart:

On the bigger picture I still think that talk of the next bear market on Crypto having already started is premature. It’s possible but there’s no compelling evidence for that so far. I think Bitcoin likely has some more downside coming but I think Solana and Ethereum may already be starting to make their lows for this move.

Against that the setup on equities is looking ncreasingly in favor of at least a technical bear market decline of 20% this year and possibly a lot more than that. If so, that could drag Crypto down into a full bear market with it. We’ll see. Everyone have a great weekend :-)

So far this year I have been and am still leaning towards seeing weakness in the first half of the year and renewed strength in the second half of 2025, with a very possible bull market high on Crypto pencilled in close to the end of the year. That scenario would be a good match with past Crypto bull markets. Is it possible that I am mistaken? Always, but we can only ever try to identify the higher probability paths in the future. Only time can show us the path that is actually taken. Still, I’m with Confucious who said ‘study the past, if you would divine the future’.

If you’d like to see more of these posts and the other Crypto videos and information I post, please subscribe for free to my Crypto substack. I also do a premarket video every day on Crypto at 9.05am EST. If you’d like to see those I post the links every morning on my twitter, and the videos are posted shortly afterwards on my Youtube channel.

I'm also to be found at Arion Partners, though as a student rather than as a teacher. I've been charting Crypto for some years now, but am learning to trade and invest in them directly, and Arion Partners are my guide around a space that might reasonably be compared to the Wild West in one of their rougher years.

Wednesday, 19 March 2025

Watching the Rally Setups on Crypto

In my last post on Friday I was looking at the overall picture on Crypto and the current setup on Bitcoin (BTCUSD), Solana (SOLUSD) and Ethereum (ETHUSD) which is still in the balance but looking decent this morning, though some key resistance levels still need to be broken to open the upside for a decent rally.

Looking at the bigger picture again there is a double top setup on Bitcoin that has broken down with a target in the 69k to 70k area, and I am still expecting that target to be reached after any rally here.

I would also note on the weekly chart below that Bitcoin is rallying (so far at least) at the weekly middle band, which is a very obvious and historically strong support level.

BTCUSD weekly chart:

On the daily chart Bitcoin has been stalled so far at a big double resistance level, the 200dma currently at 84359, and the daily middle band, currently at 85055. This is the obvious level for this rally to fail and must be broken and converted to support for the rally to procced higher.

BTCUSD daily chart:

On the hourly chart a clear IHS has broken up with a target in the 92000 area, and I’ll also be watching declining resistance from the all time high, currently in the 95000 area.

If Bitcoin trades below the IHS right shoulder low at 79.9k then the IHS fails and a retest of the last significant low at 76.6k becomes likely. With the obvious target below in the 69k to 70k area there would be a high risk that Bitcoin would then head there directly.

BTCUSD 60min chart:

There is also strong resistance on the Solana daily chart, and again that is at two big resistance levels that are close to intersecting. The first level is the daily middle band, currently at 136 and a level that has already been tested and held once since the current low at 112.19. The second level is declining resistance from the all time high, currently in the 137 area and close to crossing the daily middle band. These are the obvious levels for this rally to fail at, and must be broken and converted to support for the rally to procced higher.

SOLUSD daily chart:

On the hourly chart a clear IHS has formed and broken up with a target in the 152 area. If Solana goes higher then I would be watching the last rally high at 179.45 as a possible target.

If Solana trades below the IHS right shoulder low at 120.74 then the IHS fails and a retest of the last significant low at 112.19 becomes likely.

SOLUSD 60min chart:

There is no current reversal pattern on Ethereum but the short term falling wedge has broken up since Friday and the rally is looking good so far. Ethereum is now testing important resistance at the daily middle band, currently at 2065, and if that is broken and converted to support, then the obvious target would be declining resistance from the all time high, currently in the 2800 area and currently declining at about 100 dollars per week.

ETHUSD 60min chart:

I really like this rally setup, particularly given the even more attractive rally setup on all of the main US equity indices. There is an ideal rally window into the scheduled big escalation of the trade war on April 2nd, and the setup is very nice. Any setup can fail however and if these rally setups fail, then the chances are that they will fail together.

On the bigger picture I think that talk of the next bear market on Crypto having already started is premature. It’s possible but there’s no compelling evidence for that so far. I think Bitcoin likely has some more downside coming but I think Solana and Ethereum may already be starting to make their lows for this move.

So far this year I have been and am still leaning towards seeing weakness in the first half of the year and renewed strength in the second half of 2025, with a very possible bull market high on Crypto pencilled in close to the end of the year. That scenario would be a good match with past Crypto bull markets. Is it possible that I am mistaken? Always, but we can only ever try to identify the higher probability paths in the future. Only time can show us the path that is actually taken. Still, I’m with Confucious who said ‘study the past, if you would divine the future’.

If you’d like to see more of these posts and the other Crypto videos and information I post, please subscribe for free to my Crypto substack. I also do a premarket video every day on Crypto at 9.05am EST. If you’d like to see those I post the links every morning on my twitter, and the videos are posted shortly afterwards on my Youtube channel.

I'm also to be found at Arion Partners, though as a student rather than as a teacher. I've been charting Crypto for some years now, but am learning to trade and invest in them directly, and Arion Partners are my guide around a space that might reasonably be compared to the Wild West in one of their rougher years.

Tuesday, 18 March 2025

A Case For A Decent Rally Here

Every so often something rare happens on equity indices, and I get to run the numbers to see what to expect when that happens, which is something I always enjoy doing. Last week there were touches and punches below the weekly 3sd lower band on the US equity indices, so I’ve been looking back to see what has happened in the past when this happened.

On the bigger picture the topping patterns on the US equity indices that I was looking at in my post on Wednesday 19th Feb have all broken down and none have yet made target, though SPX and QQQ are getting close. I’m expecting to the US indices go lower, but there is a decent case for a rally during the next couple of weeks before we reach Trump’s key date on April 2nd when he has said that his full threatened tariffs on the rest of the US trading partners are going on.

We saw a very near miss of the weekly 3sd lower band on IWM last week, full hits on QQQ and DIA and and an intraweek punch below on SPX. So what does this tell us to expect here? Well the takeaways are as follows:

The only two previous punches below were in:

  • the 2020 crash, which continued down for a further two weeks and 11% before making a major low.

  • Feb ‘22 and delivered a 10% rally over the next couple of weeks before declining again.

The other four touches or near misses of the weekly 3sd lower band delivered the following:

  • Dec ‘19 - Serious low lasting 14 months and rising about 50%

  • May ‘22 - Two week rally rising about 7%

  • June ‘22 - Ten week rally rising about 18%

  • Oct ‘23 - Serious low lasting 16 months and rising about 50%

I’m doubtful about a serious low here for many reasons, and I’m also doubtful that we are watching a full crash play out here at speed, though that could be the case. What I think is more likely is that we see an oversold rally here, that should historically last at least a week and deliver a rise of at least 7%. With last week’s low at 5504 then that would give a minimum target in the 5890 area.

SPX weekly chart:

Another thing I look for at lows is a decent pattern structure, and that also came into focus last week with a decent quality falling megaphone on SPX from the highs. In the short term a small double bottom has broken up with a target in the 5760-80 range, with falling megaphone resistance currently in the 5735 area.

On the bigger picture a daily RSI 5 buy signal fixed at the close on Friday, daily middle band resistance is currently at 5835, and weekly middle band resistance is currently at 5950.

SPX 15min chart:

I was watching the high quality falling megaphone from the highs for much of last week on QQQ. In the short term that falling megaphone has broken up and small double bottom has broken up with a target in the 495 area.

On the bigger picture a daily RSI 5 buy signal fixed a few days ago and reconfirmed at the close on Friday, daily middle band resistance is currently at 504, and I have NDX weekly middle band resistance currently at 21114.

QQQ 15min chart:

A decent quality falling wedge has formed and broken up on DIA. No obvious reversal pattern has broken up yet but a IHS right shoulder may well be forming at the moment. If that forms and breaks up, the target would be in the 434 area.

On the bigger picture a daily RSI 5 buy signal fixed a few days ago, but then failed so there is no current daily buy signal on DIA. Daily middle band resistance is currently at 430, and I have INDU weekly middle band resistance currently at 43516.

DIA 15min chart:

A decent quality falling wedge has formed and broken up on IWM. In the short term that falling wedge has broken up and a small double bottom has broken up with a target in the 209 - 210.5 area.

On the bigger picture a daily RSI 5 buy signal fixed at the close on Friday, daily middle band resistance is currently at 210.70, and I have weekly middle band resistance currently at 224.

IWM 15min chart:

There is a clear two week window here into the next big tariff date on April 2nd and I’m thinking this is a nice setup for a decent rally. I’ll be watching for possible bear flags to form on US indices to set up the next leg down that will likely follow.

As I have been since the start of 2025 I’m still leaning on the bigger picture towards a weak first half of 2025 and new all time highs later in the year, very possibly as a topping process for a much more significant high. One way or another I think we’ll be seeing lower soon and I’m not expecting this to be a good year for US equities, not least because both of the last two years have been banner years for US equities. A third straight year of these kinds of gains looks like a big stretch. I could of course however be mistaken. UPDATE 11th March 2025 - I am wondering if this may be a bear market that dominates the whole of 2025.

If you like my analysis and would like to see more, please take a free subscription at my chartingthemarkets substack, where I publish these posts first. I also do a premarket video every day on equity indices, bonds, currencies, energies, precious commodities and other commodities at 8.45am EST. If you’d like to see those I post the links every morning on my twitter, and the videos are posted shortly afterwards on my Youtube channel.