
Back in 2011/2 I was chatting to a guy on a blog and he said that the problem with gold was that the price of gold was only what someone was prepared to pay for it. I replied that he had come very close to a huge insight into nature of markets, but had failed to grasp it at the last moment. That is because the truth is that anything is only worth what someone is prepared to pay for it, and what they would be paying for it with was also only worth what someone is prepared to pay for that. To that extent markets are based on faith, rather than value, as value itself is heavily based on faith.
What does this mean? Well it means sentiment and expectation are very important, and uncertainty depresses markets, and a big shock in confidence can cause big market declines or crashes.
How is this relevant? Well there is a nice looking rally setup here at a big inflection point, but for the rally to happen markets will need to make a leap of faith.
In my post on Wednesday 19th Feb I was looking at the topping patterns on US indices and obviously they completed forming and, with the exception of DIA, they have now all broken down.
In my post on Wednesday I was looking at a possible short term low setup that might form, I was leaning towards a lower low with SPX reaching the first and smaller double top target in the 5695 to 5715 area, and SPX reached that area yesterday. In my premarket video yesterday morning I was looking at that and the possibility that we might see a strong rally start from that level or close to it, fuelled by Trump walking back some or all of the tariffs imposed on Canada and Mexico that were imposed on Tuesday, and he has done that yesterday.
Trump delayed some of the tariffs yesterday, exempting until April 2 the tariffs for goods covered by the USMCA agreement, and that was good news to a limited extent, though it still leaves those tariffs scheduled to be reimposed in a few weeks, along with the tariffs on much of the rest of the world currently also scheduled to be imposed on the same day. There is some hope that at least some of these proposed tariffs might be reconsidered over those few weeks and that what would amount to a declaration of economic war on the world may then be modified or cancelled.
How likely is that? Well I think Trump did seem genuinely surprised that Canada and Mexico were imposing (Canada & China) or planning (rest of the world) retaliatory tariffs against the US, and that this tariffs policy might not just be free tax revenue but might actually badly hurt the US economy, and it may be that gives him pause, but my personal feeling is that, having talked tariffs up so much as good, just and vital for the US, he’s likely to at least try to go further, but we’ll see.
In the meantime here there is a window for a possible strong rally here on US equities and I’m watching to see if that may deliver. I don’t think this tariff disruption is ending & I think lower lows later are likely, but for today let’s have a look at that rally setup.
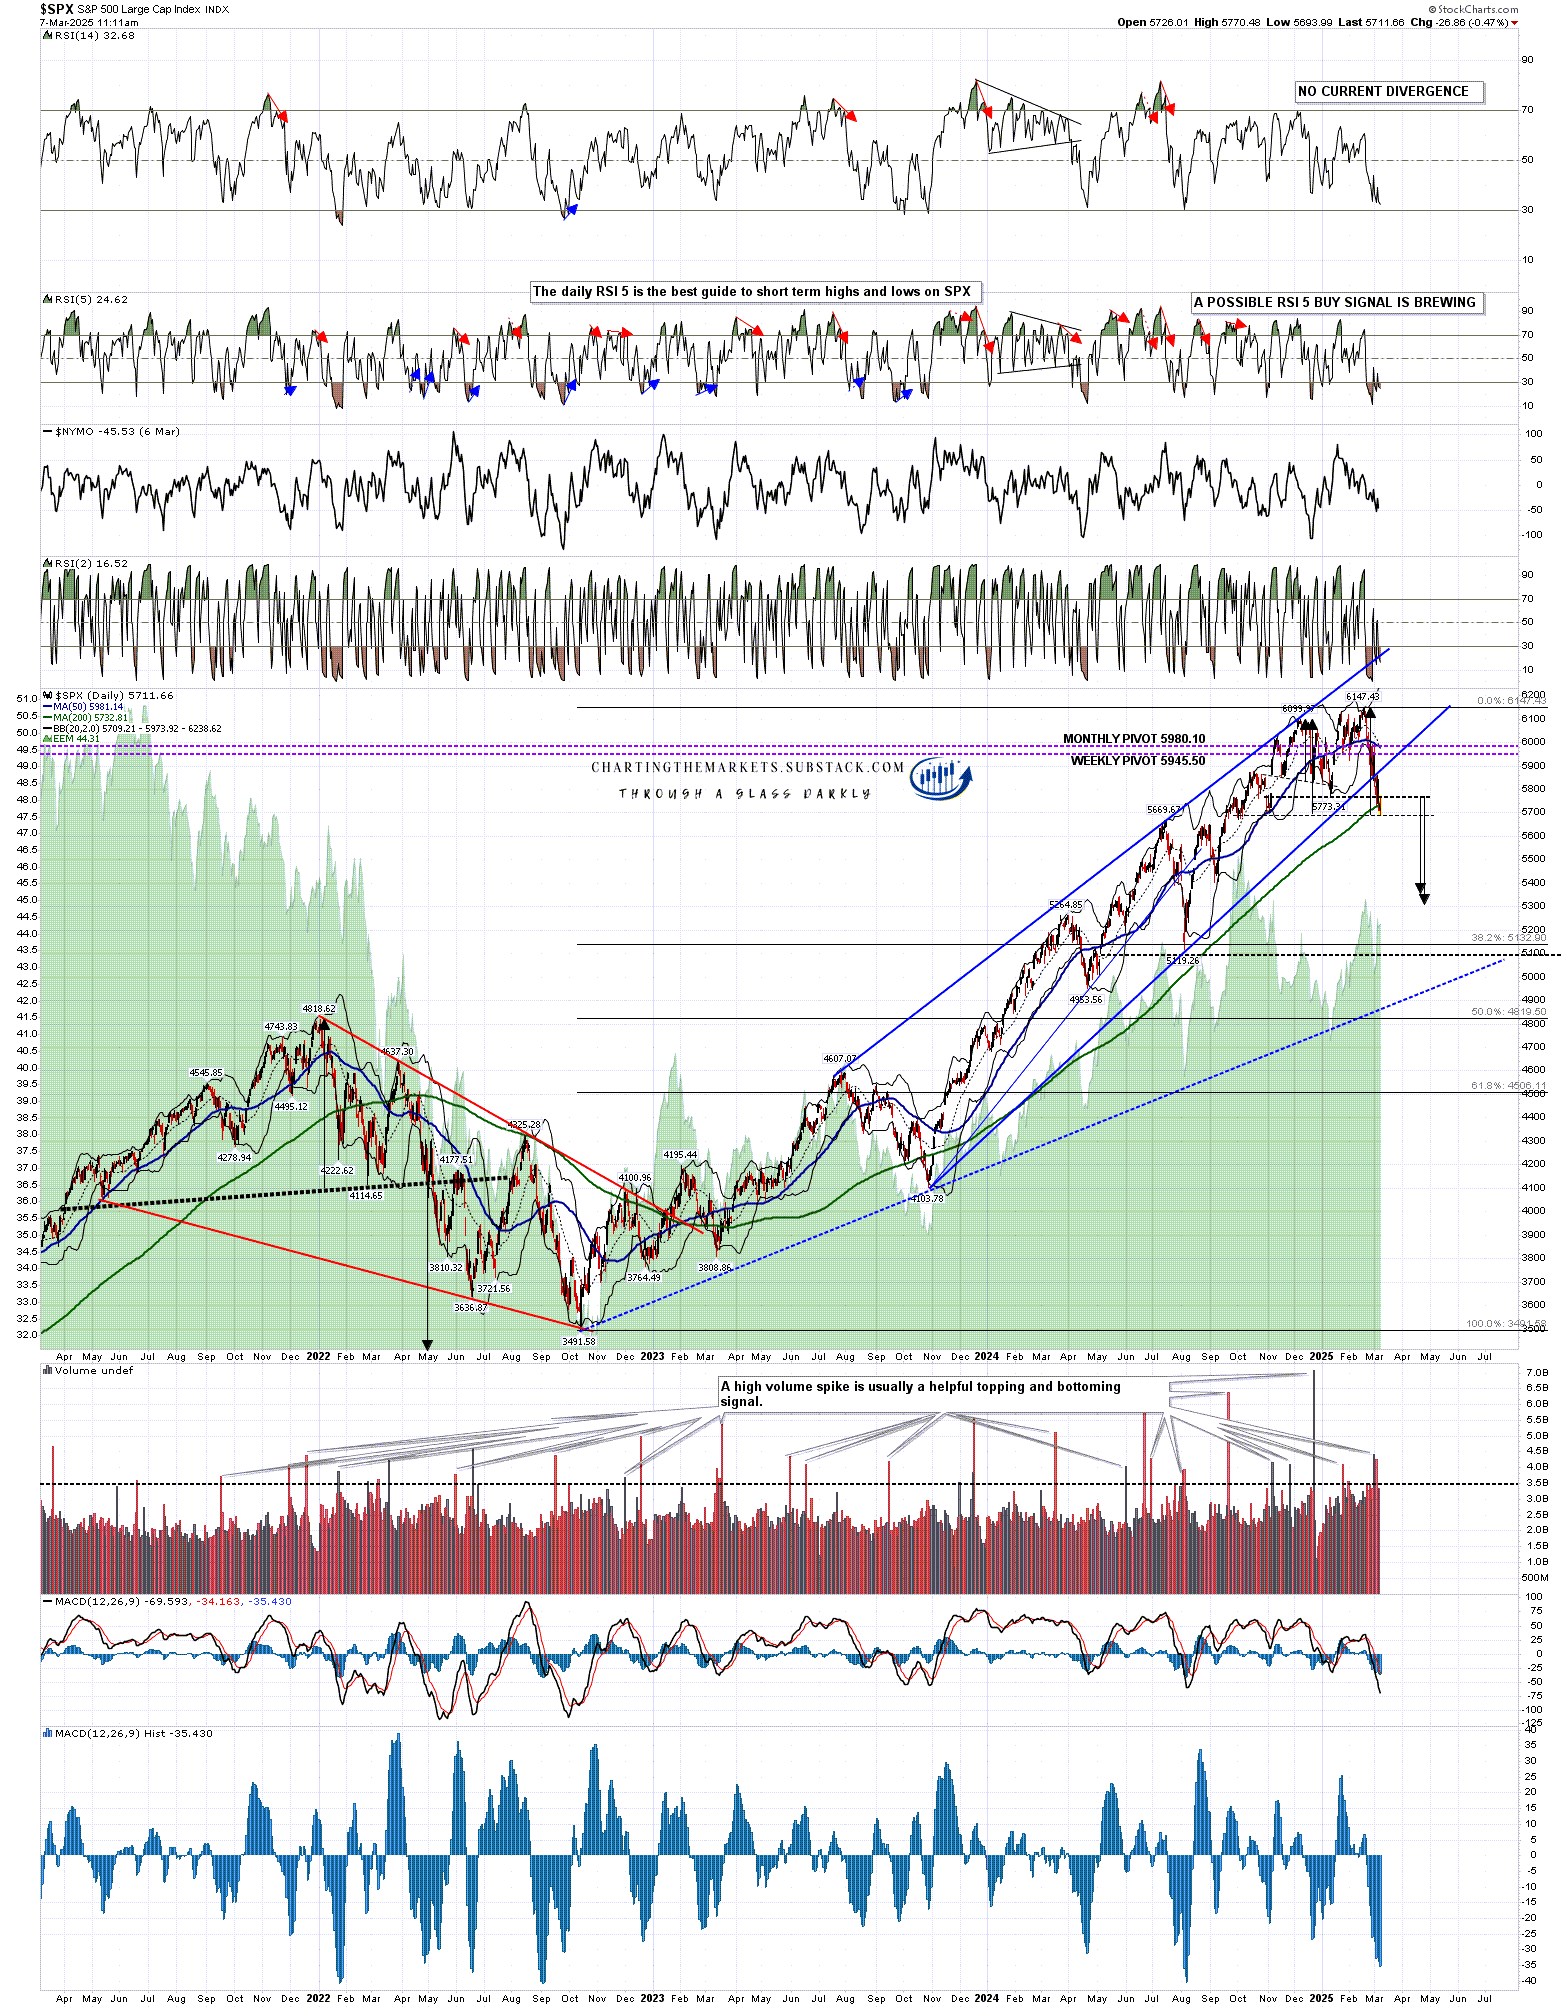
On the SPX daily chart a possible RSI 5 buy signal is brewing, there is another brewing on IWM and two more already fixed on QQQ and DIA. If a rally gets going here it may be a strong one.
SPX has been testing the 200dma the last couple of days, currently at 5730.77. There has been no daily close below this so far and it is a big support level that may hold on this test.
There have also been high volume spikes on SPX on Tuesday and Wednesday this week that may mean a short term reversal is close.
SPX daily chart:
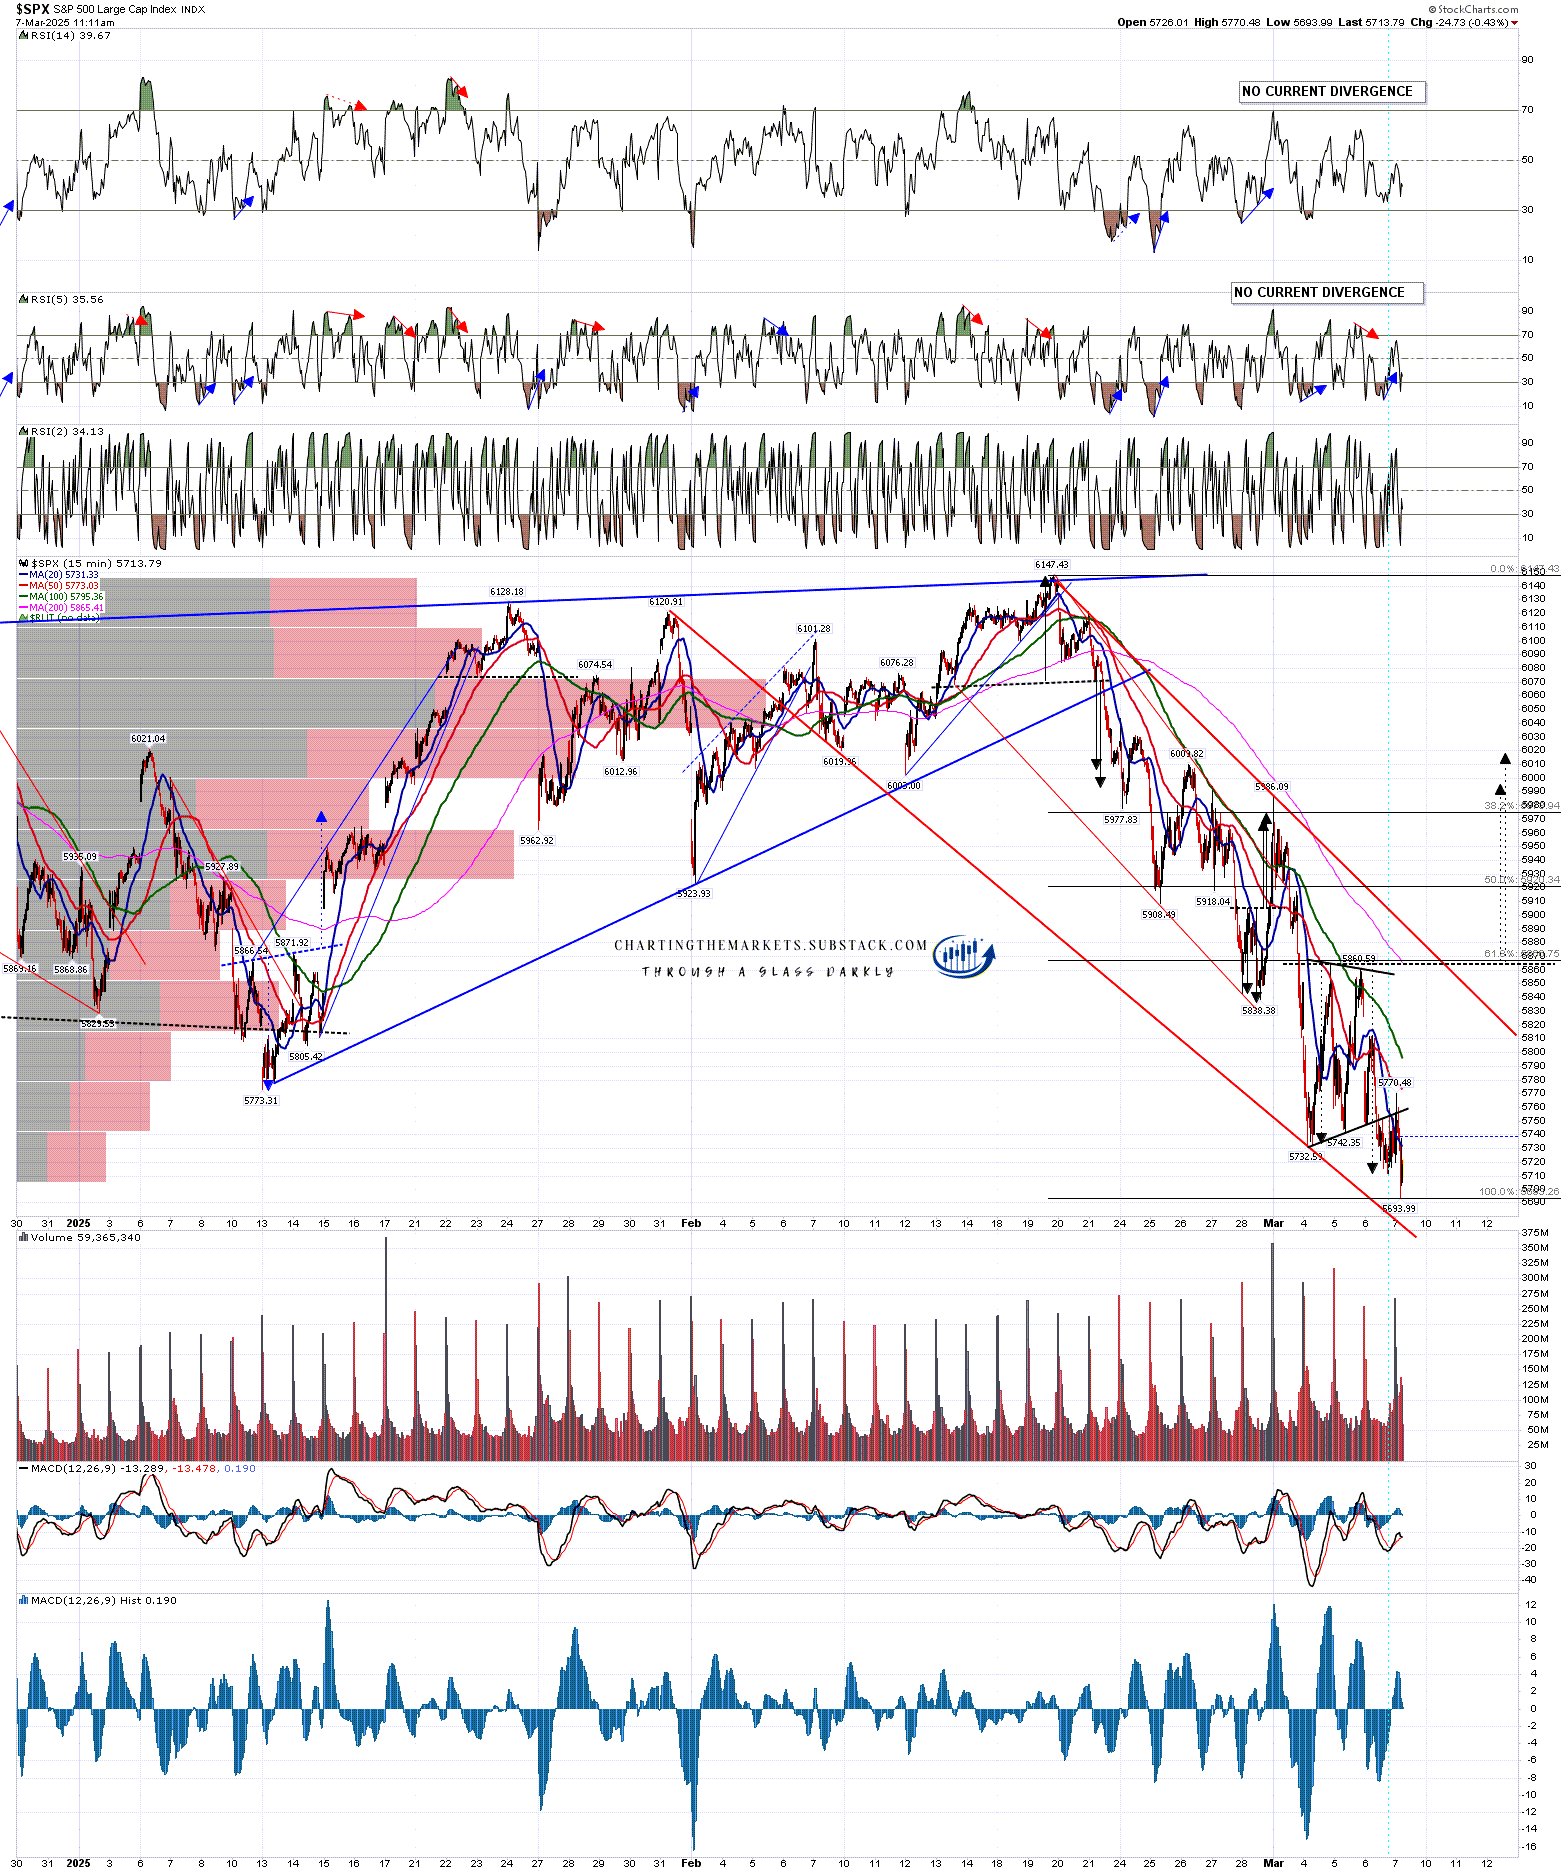
On the SPX 15min chart there is a possible double bottom setup, though that is deteriorating as I write this, and a possible falling wedge with resistance currently in the 5890 area that would be the obvious next target within that falling wedge.
SPX 15min chart:
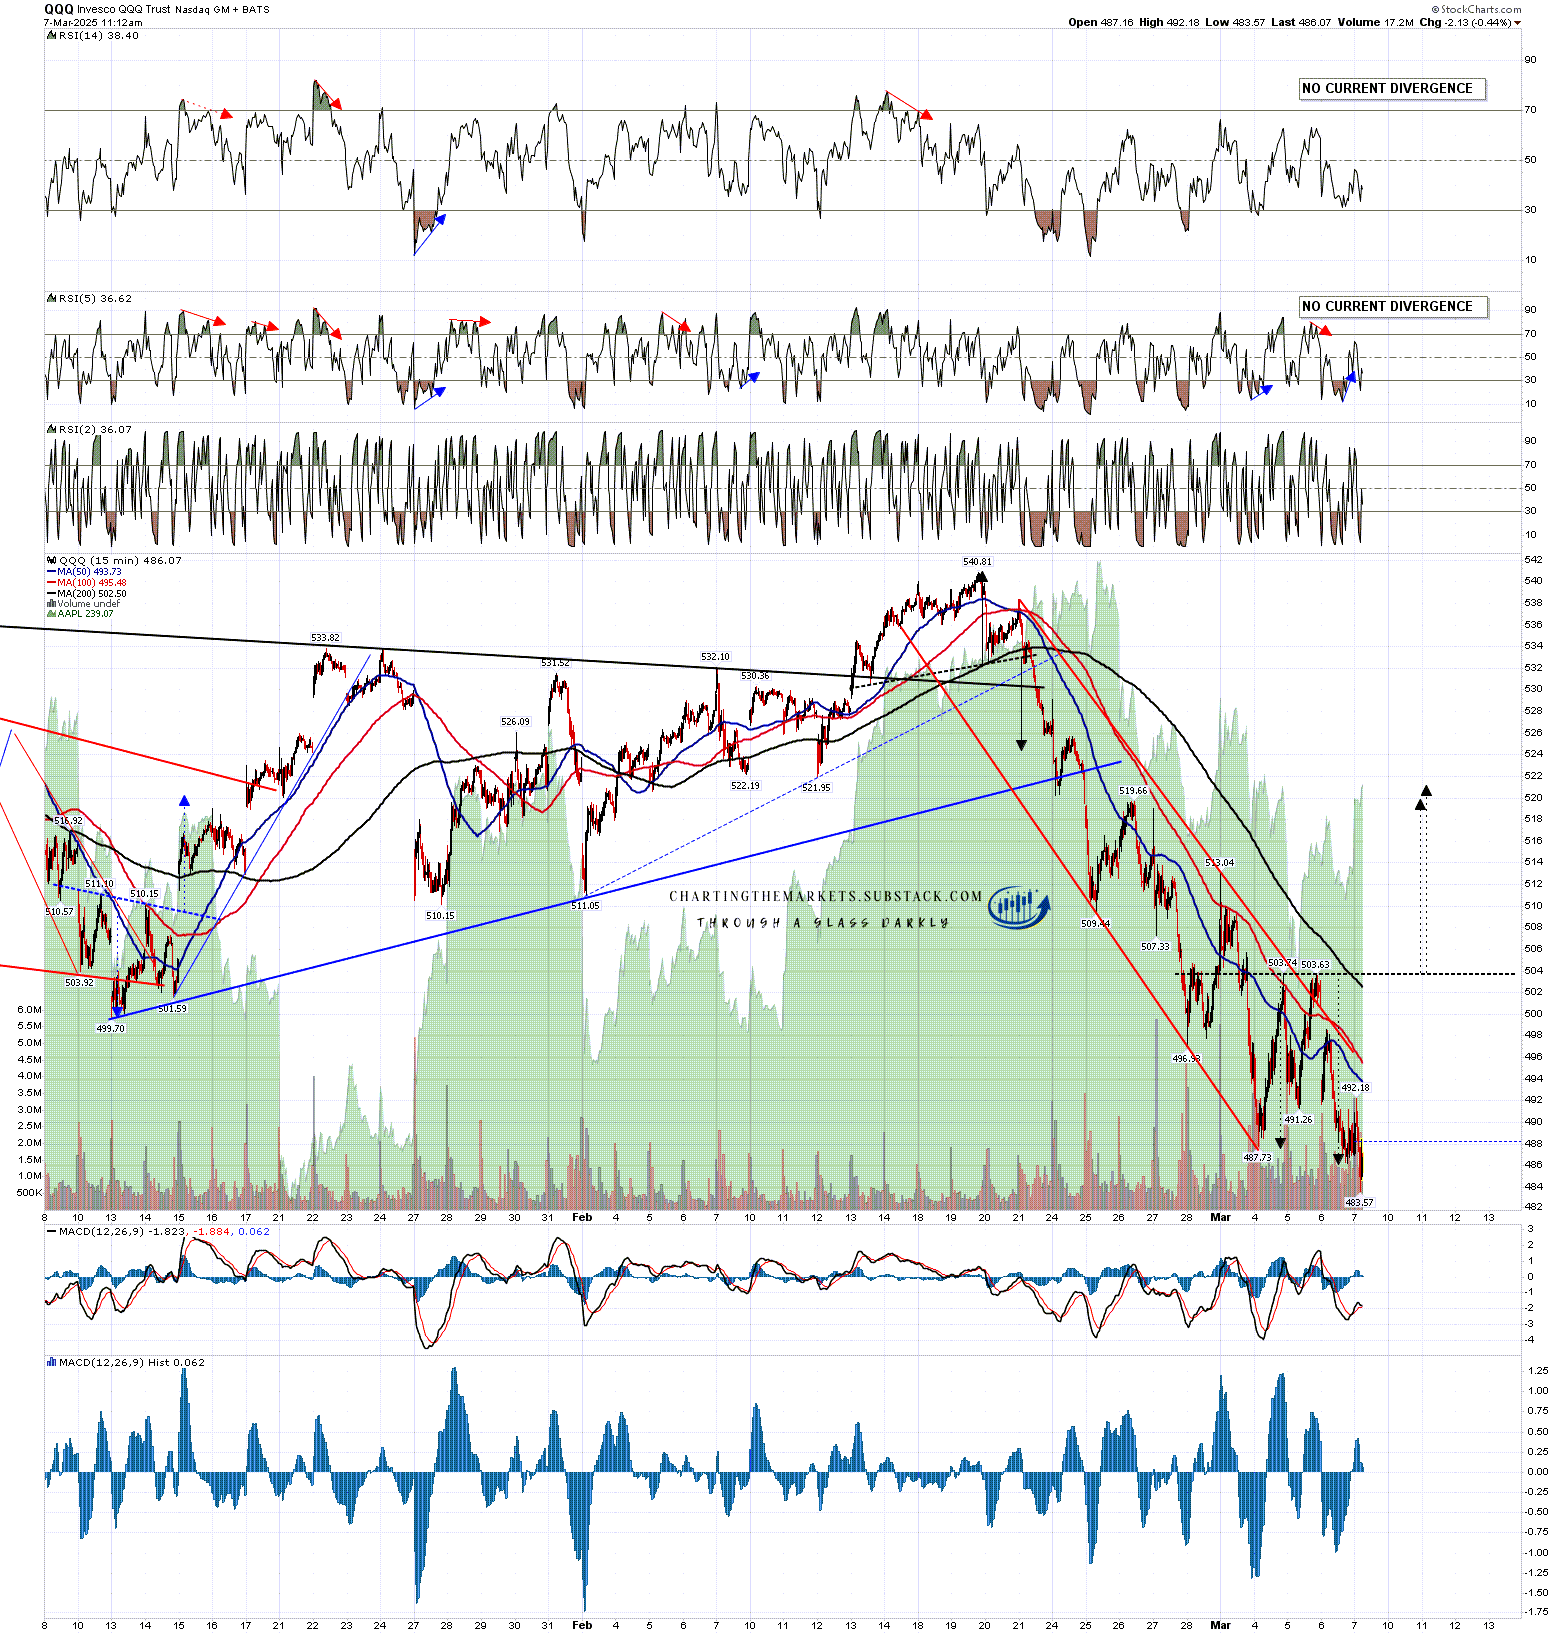
On the QQQ 15min chart there is another double bottom setup that could deliver a rally back into the 520-1 area.
QQQ 15min chart:
On the DIA 15min chart there is another double bottom setup that could deliver a rally back into the 439.5 area.
DIA 15min chart:

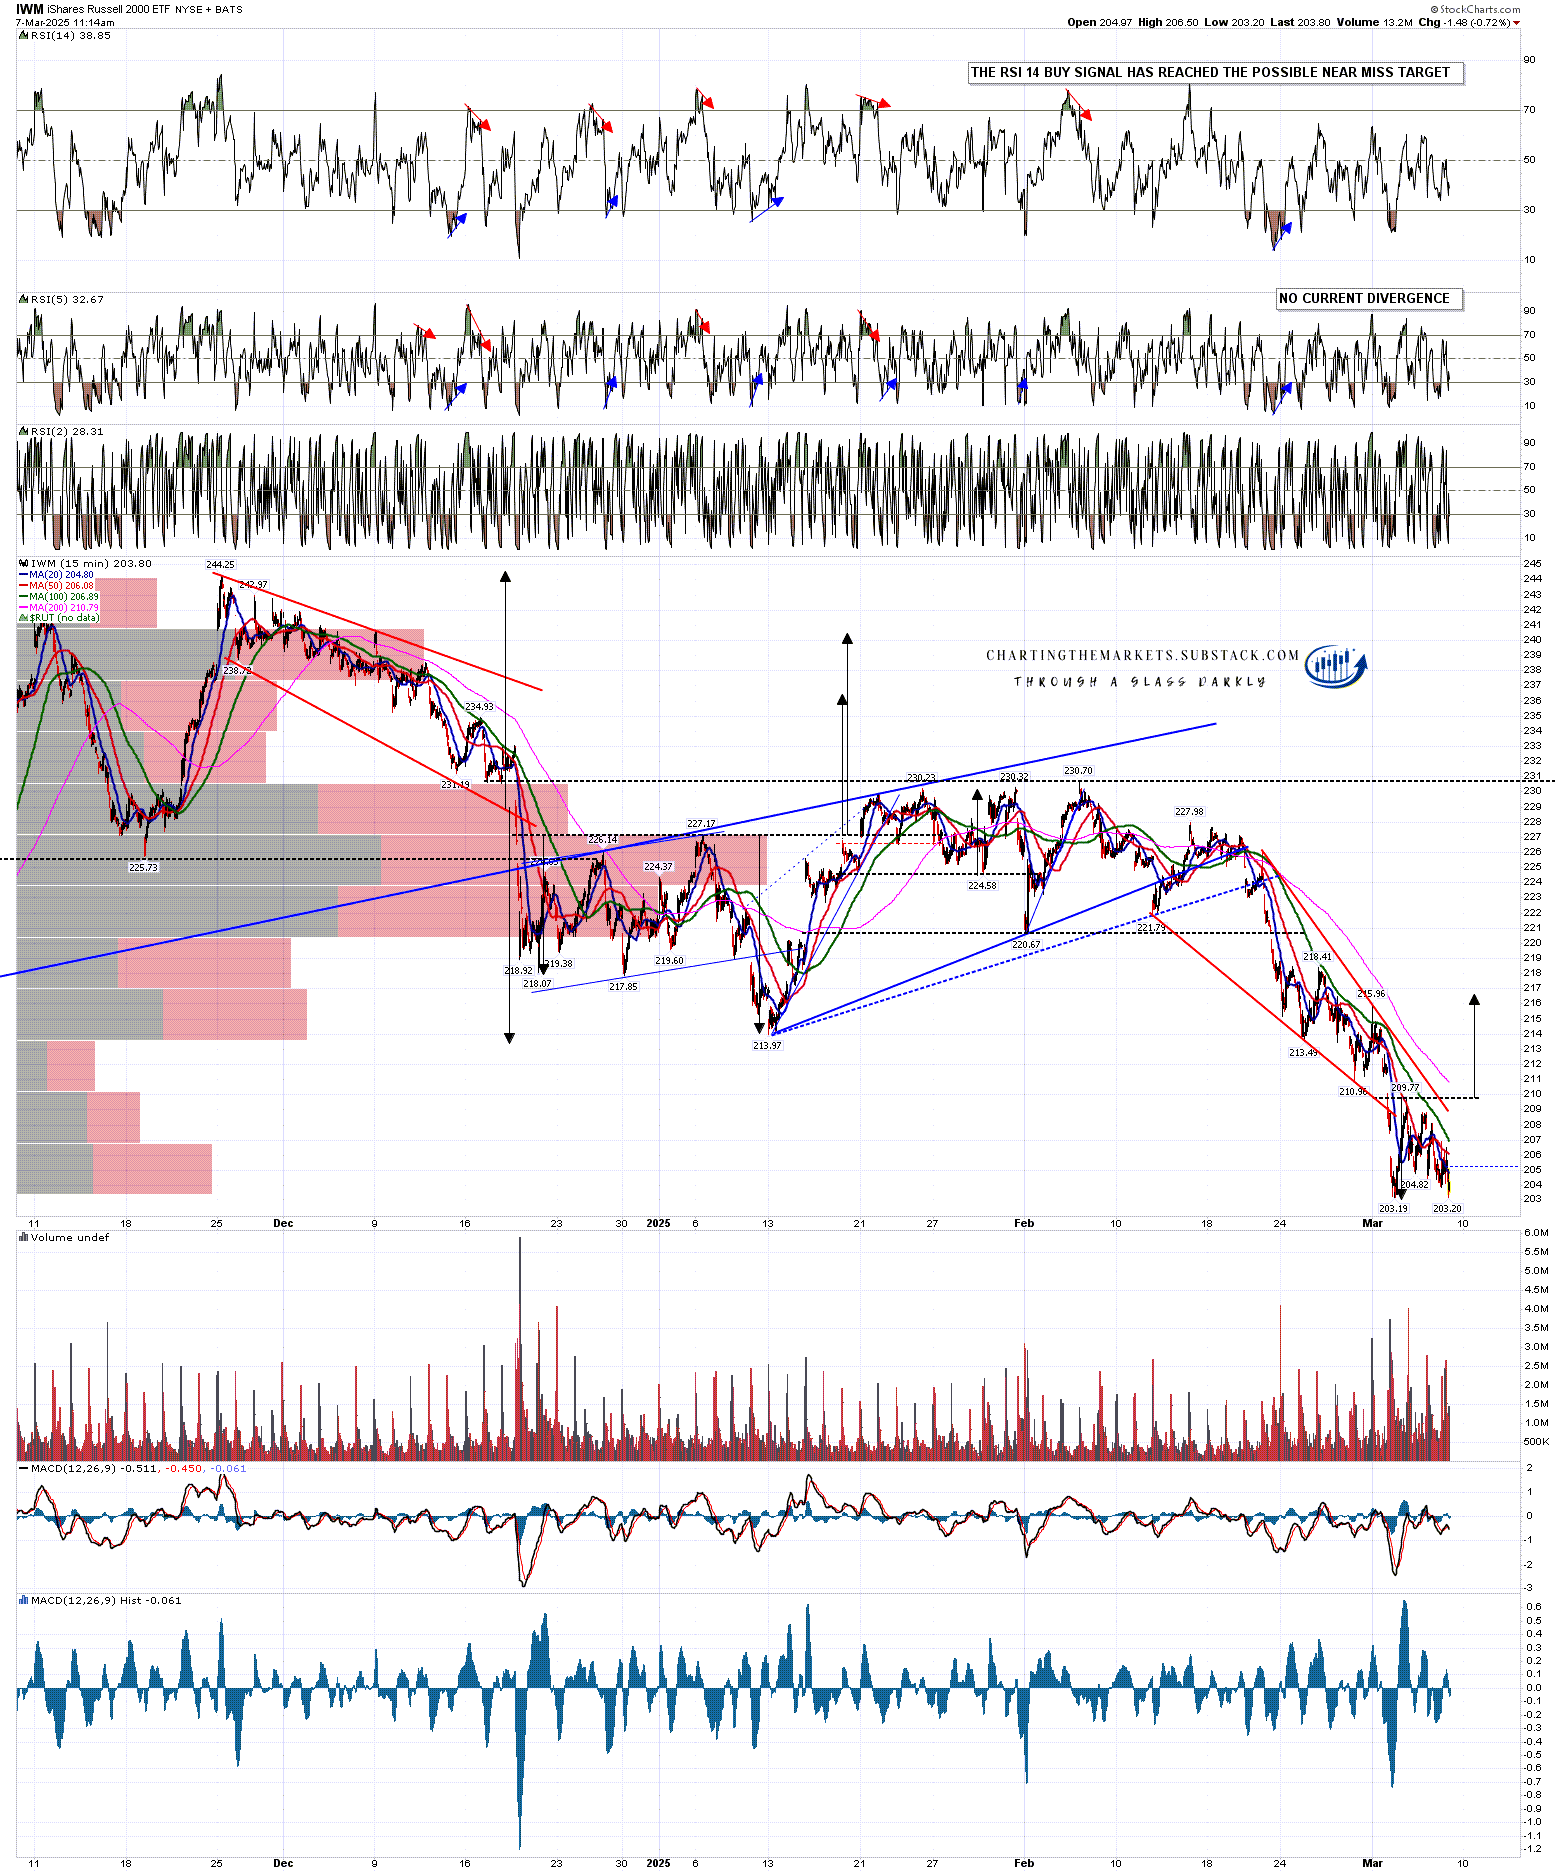
On the IWM 15min chart there is another double bottom setup that could deliver a rally back into the 216.7 area.
IWM 15min chart:
How likely are we to see this rally over the next one to three weeks? Well ….. right now I’m leaning towards 50/50 odds, but I am biased. If we see this rally I think the rest of March will be more fun and profitable to trade as I think that this would likely just be a counter-trend rally delivering lower lows in a few weeks. Last I checked though, the markets don’t take requests and it may just continue down directly from here. A sustained break below 5700 would not be at all encouraging for this rally setup. Everyone have a great weekend. :-)
As I have been since the start of 2025 I’m still leaning on the bigger picture towards a weak first half of 2025 and new all time highs later in the year, very possibly as a topping process for a much more significant high. One way or another I think we’ll be seeing lower soon and I’m not expecting this to be a good year for US equities, not least because both of the last two years have been banner years for US equities. A third straight year of these kinds of gains looks like a big stretch. I could of course however be mistaken.
If you like my analysis and would like to see more, please take a free subscription at my chartingthemarkets substack, where I publish these posts first. I also do a premarket video every day on equity indices, bonds, currencies, energies, precious commodities and other commodities at 8.45am EST. If you’d like to see those I post the links every morning on my twitter, and the videos are posted shortly afterwards on my Youtube channel.
No comments:
Post a Comment