
In my last post on Friday I was looking at a decent quality rally setup and that was looking good on Friday night, but Trump’s interviews on Sunday delivered a big decline yesterday. Trump’s comments in those interviews however were very illuminating about the likely direction on tariff policy over the next few months.
So what did the interviews tell us? Well firstly Trump is very very keen on imposing tariffs on most of the trading partners of the US, and seems to be convinced that will bring in a lot of extra money for the US. I think he is seeing that as a heavy tax that the US can impose on trading partners for the privilege of trading with the US, and we have already seen that he seems to think that this won’t come at a heavy cost to the US.
It seems likely therefore that he is at least going to give this a serious try that will likely last at least a few months. In practical terms I would expect that this tariff will mainly be levied on US consumers and the the main effect will mainly be to put up big tariff barriers between the US and the rest of the world that may depress trade for years to come, and will not immediately bounce back if tariffs are then lifted.
Secondly it is now clear that Trump is aware that his tariff policy may increase prices and reduce growth, possibly putting the US into recession, and he seems relaxed about that prospect. Again, this a sign that he is likely to give this policy at least months and possibly years to work before giving up on it. Trump 1.0 was very sensitive to market movements, Trump 2.0 no longer seems concerned about this:
The world has been changing fast around us and we need to adapt to it. So what does this mean for markets?
The odds that we see bear market declines of more than 20% on US indices this year are now much higher. The odds of seeing a full stock market crash this year have also now risen significantly. In my post on Wednesday 19th Feb I was looking at the topping patterns on SPX, QQQ, DIA and IWM and my working assumption is that all of those have a decent shot at making target. On the bigger picture that would only take US equity markets back towards the August 2024 low and I’ll have a look at the obvious targets below those that may then also be hit.
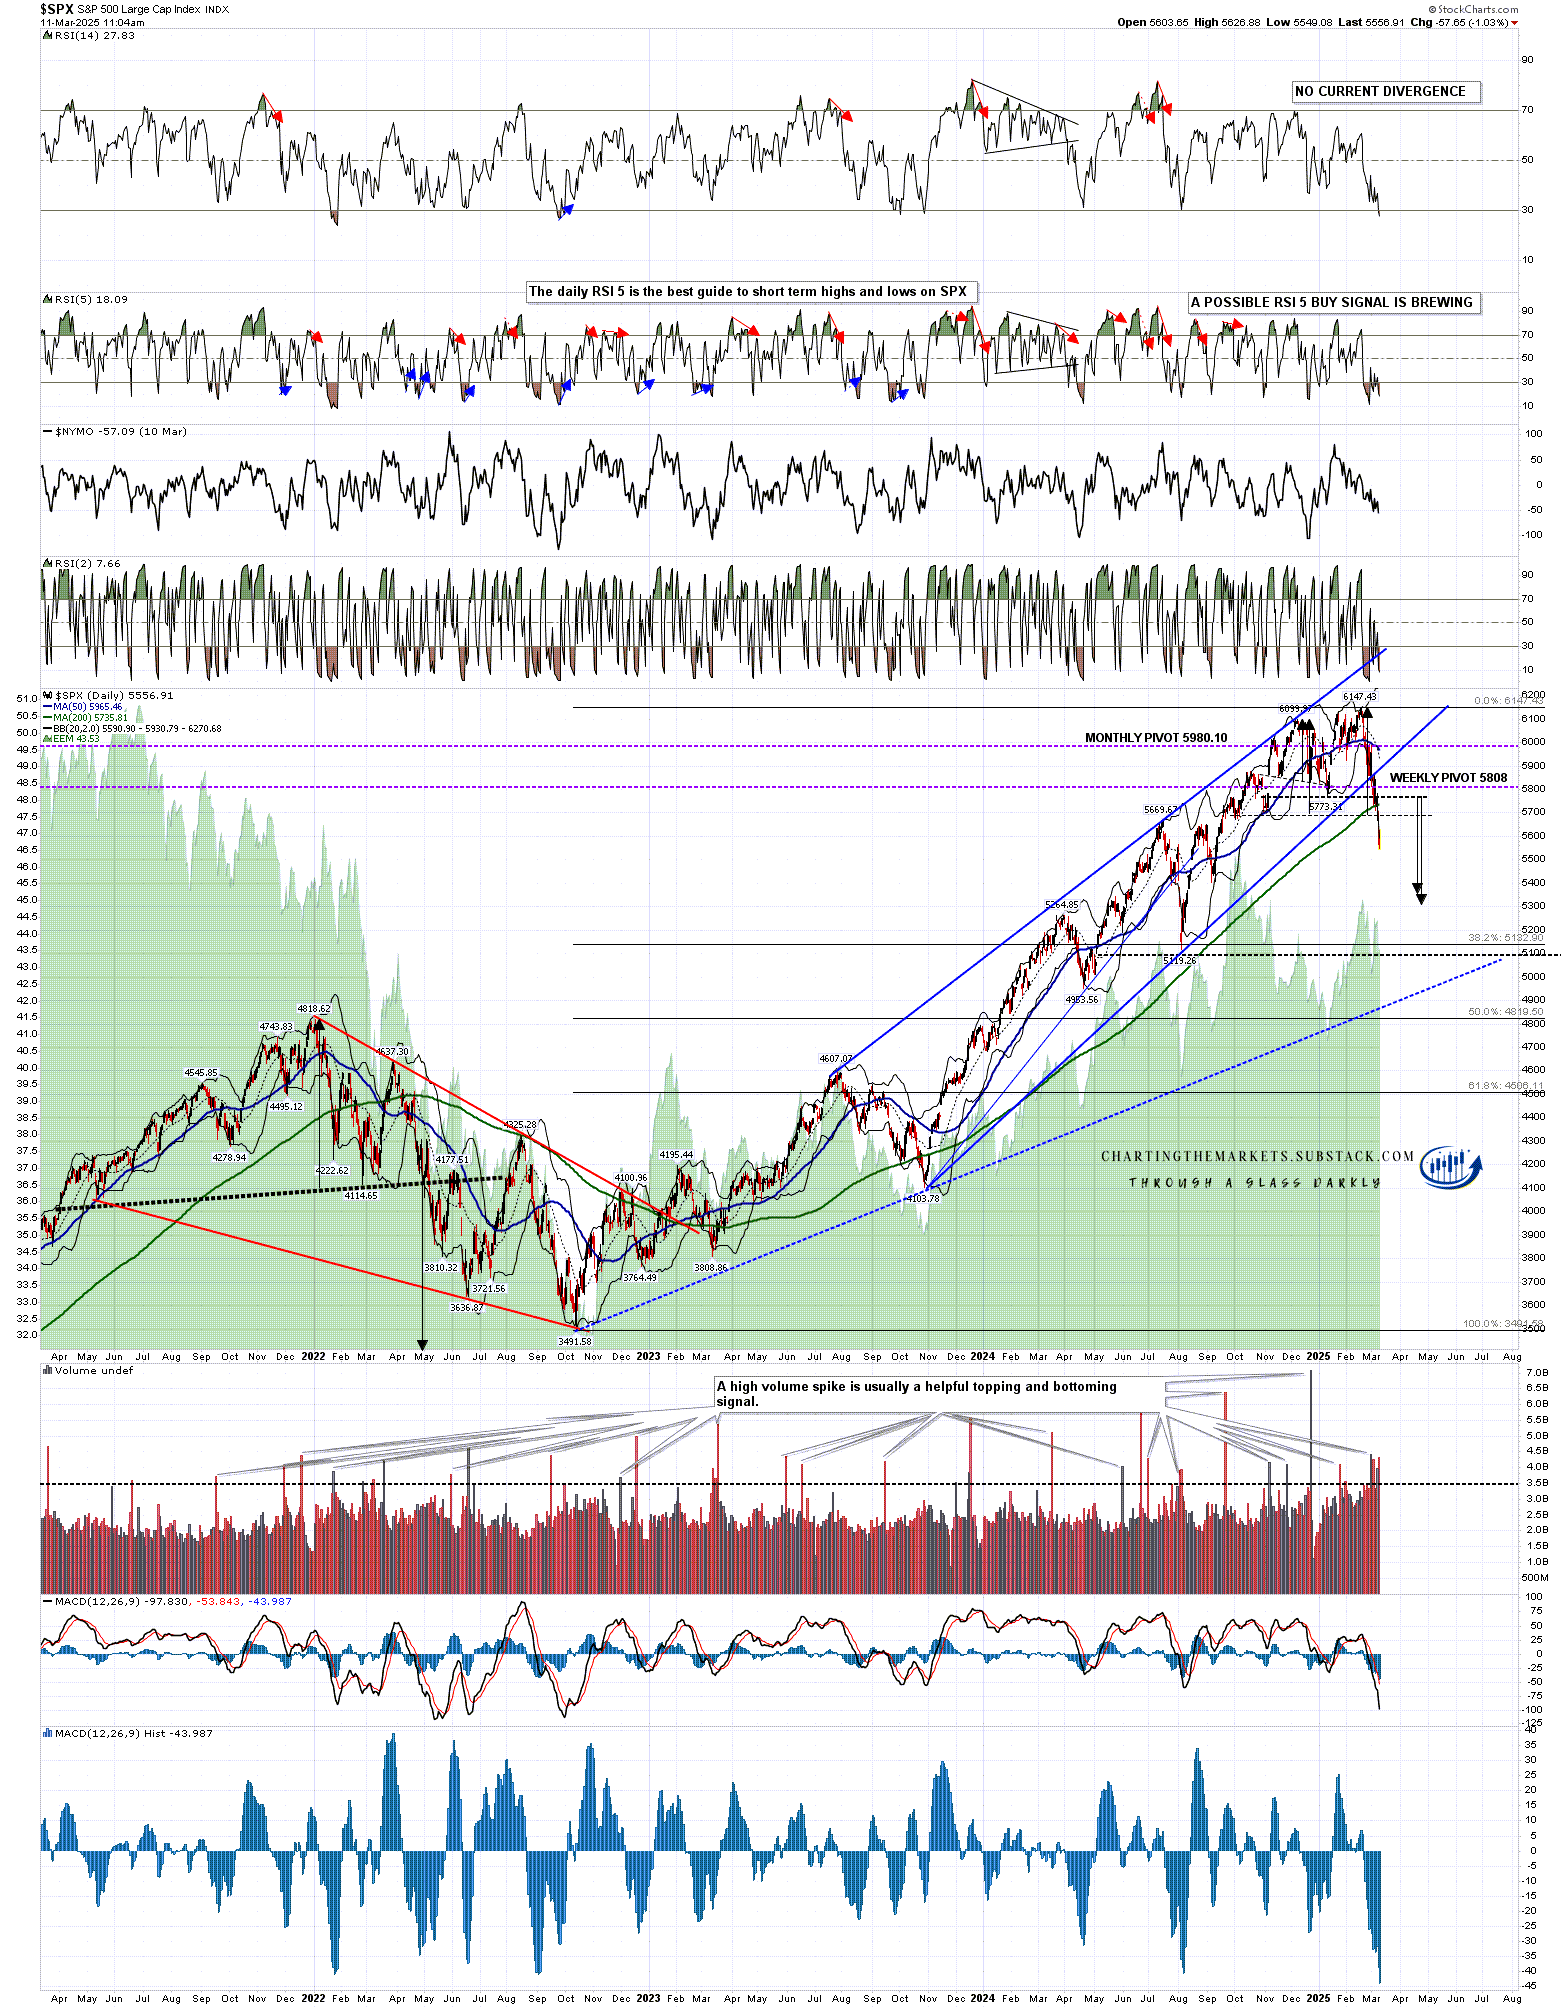
On SPX I was looking at two nested double tops in my post on 19th Feb. The smaller double top target was reached last week and SPX is now over halfway to the larger double top target in the 5395 to 5445 area. SPX has now broken hard below the 200dma and I’m expecting this double top target area to be reached.
On continuation lower the next target would be a full retrace to the August low at 5119.26 and below that I have the main rising support trendline from the Oct 2022 low, currently in the 4950 area and due to reach the August low within three months. A 20% decline from the all time high on SPX would be at 4917.944.
SPX daily chart:
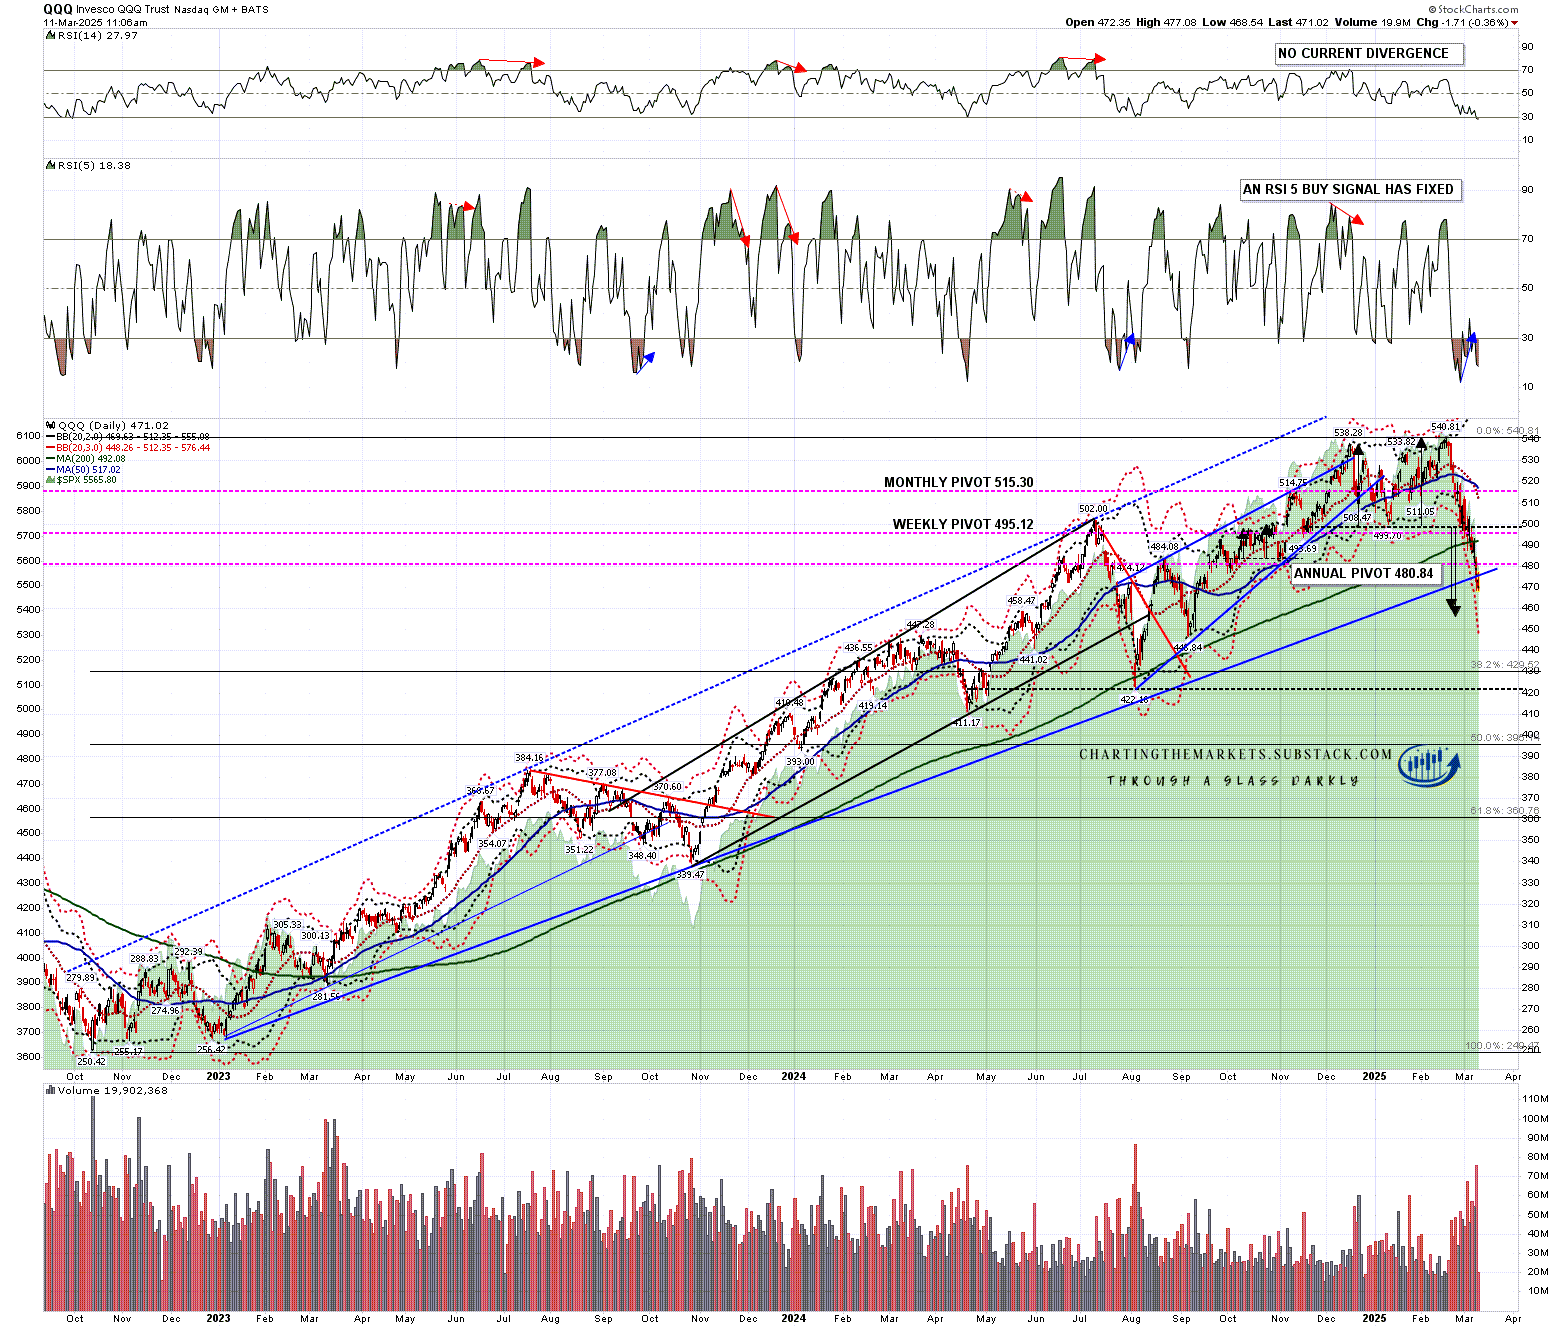
On QQQ I was looking at a double top in my post on 19th Feb. QQQ is now well over half of the way towards the double top target at 459-60. QQQ broke hard below the 200dma last week and rising support from the Oct 2022 low yesterday. I’m expecting this double top target area to be reached.
On continuation lower the next target would be a full retrace to the August low at 422.16 and below that I have the 50% retracement level from the Oct 2022 low at 395. A 20% decline from the all time high on QQQ would be at 432.65.
QQQ daily chart:
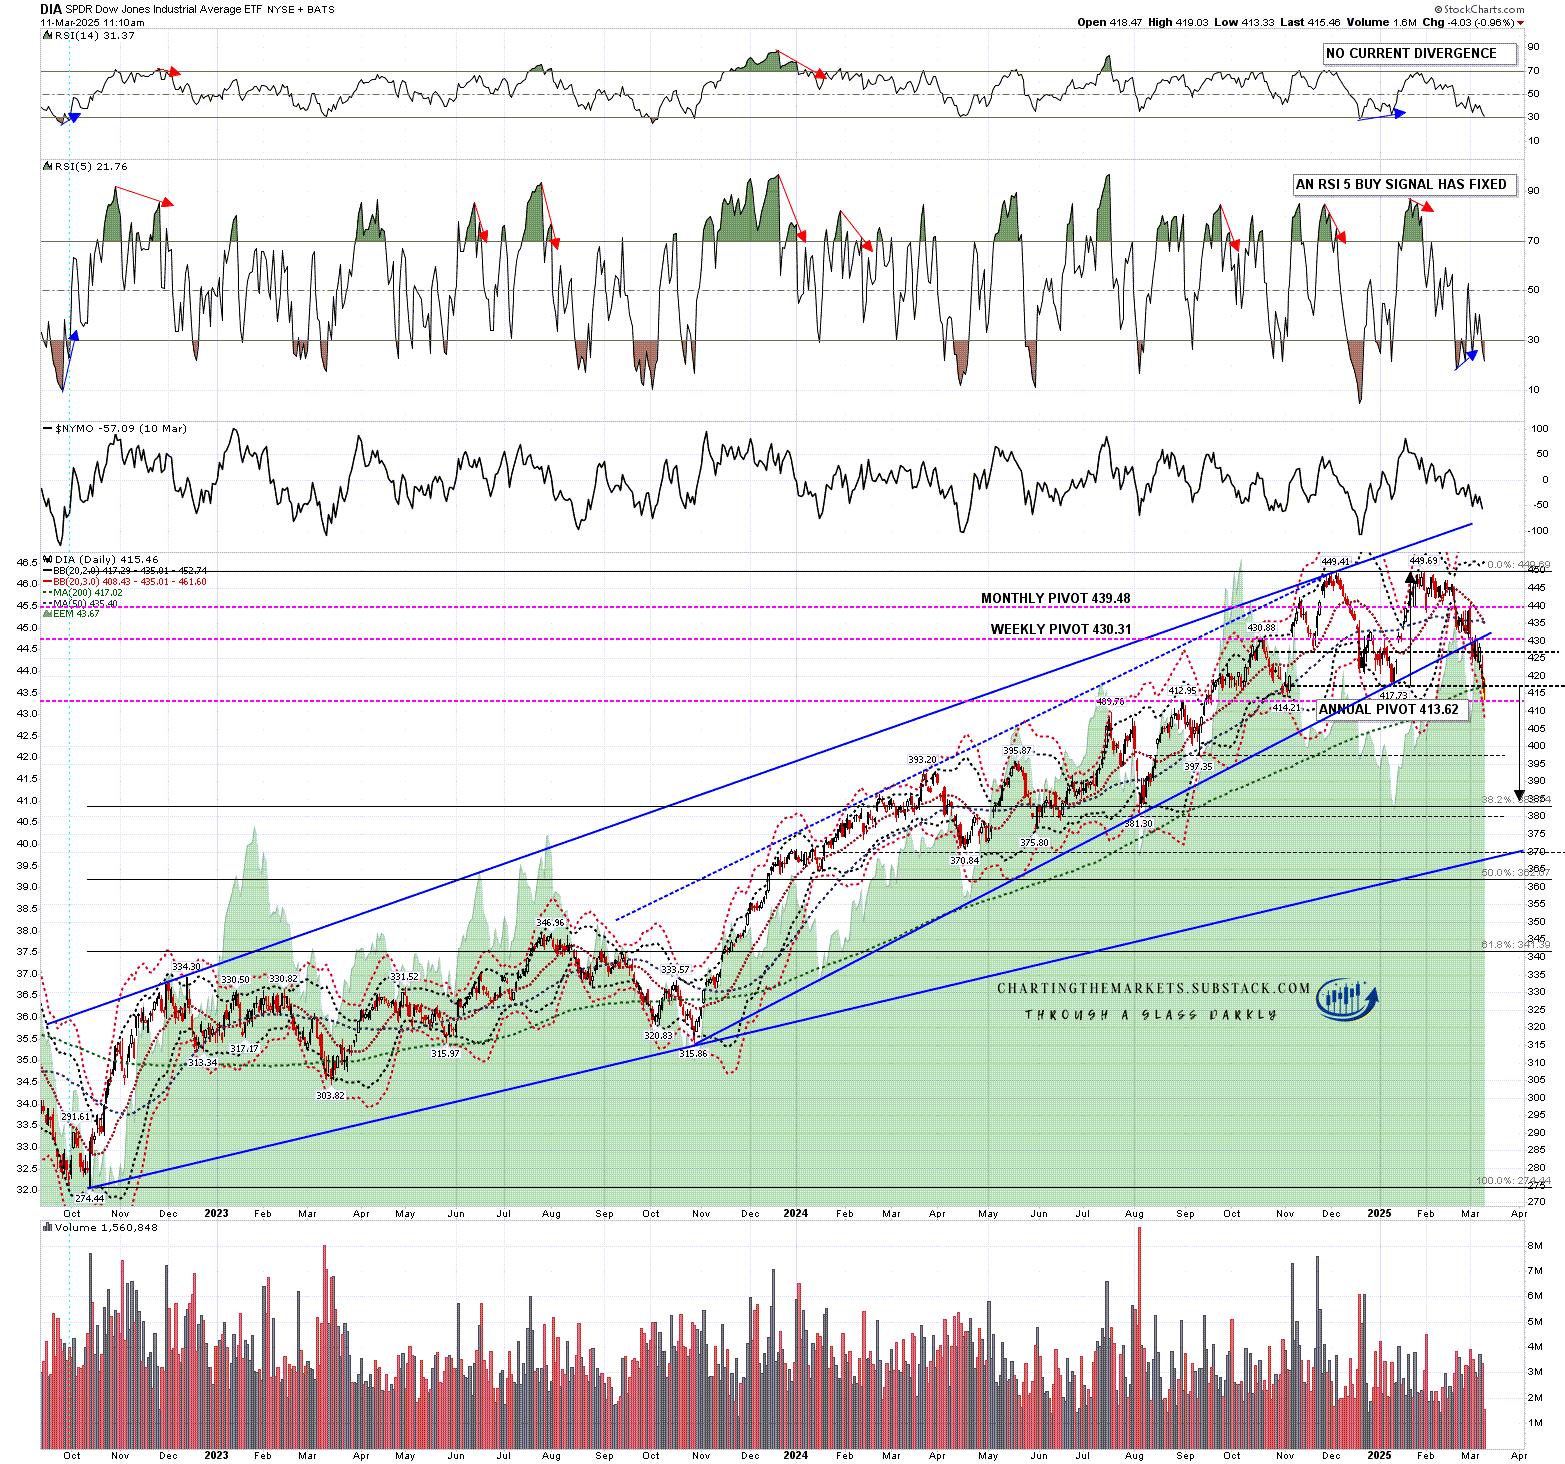
On DIA I was looking at a double top in my post on 19th Feb, and until yesterday it was the only one of those patterns that had not yet broken down. That has now broken down with a target in the 385 area on a significant break below the 200dma. I am less confident about this target being reached, but just below that target is the full retracement back to the August low at 381.30 so it is an attractive target.
On continuation lower the next target would be the rising support trendline from the Oct ‘22 low, currently in the 370 area. A 20% decline from the all time high on DIA would be at 359.75.
DIA daily chart:

IWM topped out in November and has broken down from an H&S with a target in the 183.5 area. The 50% retracement level from the Oct’23 low at 201.75 was hit yesterday. I’m expecting this H&S target to be reached. There isn’t much to see in terms of further targets below except for a possible full retracement back to the Oct ‘23 low at 159.21. A 20% decline from the all time high on IWM would be at 195.4 and will likely be reached soon.
IWM daily chart:
In the short term hourly buy signals fixed overnight on all six of the equity index futures that I watch - ES, NQ, RTY, YM, DAX & ESTX50. Usually this would deliver a significant rally and all of those signals would reach their targets but in this news bomb environment that’s harder to call. Trump announced higher tariffs on Aluminium and Steel this morning and markets fell on and are still digesting that news.
As I have been since the start of 2025 I’m still leaning on the bigger picture towards a weak first half of 2025 and new all time highs later in the year, very possibly as a topping process for a much more significant high. One way or another I think we’ll be seeing lower soon and I’m not expecting this to be a good year for US equities, not least because both of the last two years have been banner years for US equities. A third straight year of these kinds of gains looks like a big stretch. I could of course however be mistaken. UPDATE 11th March 2025 - I am wondering if this may be a bear market that dominates the whole of 2025.
If you like my analysis and would like to see more, please take a free subscription at my chartingthemarkets substack, where I publish these posts first. I also do a premarket video every day on equity indices, bonds, currencies, energies, precious commodities and other commodities at 8.45am EST. If you’d like to see those I post the links every morning on my twitter, and the videos are posted shortly afterwards on my Youtube channel.
No comments:
Post a Comment