
In my post on Monday 10th Feb I was looking at the bull flag setups on SPX and QQQ and the historically bullish lean through Tuesday 18th Feb and was projecting that we might well see retests of the all time highs on SPX and QQQ in that bullish window. We saw those all time high retests on QQQ on Friday 14th Feb and on SPX on Tuesday 18th Feb.
In my post on Wednesday 19th Feb I was looking at the very nice looking topping setups on SPX, QQQ and DIA and the historically bearish lean through Friday 28th Feb and suggesting that, if these patterns were going to deliver, then this bearish window would be a good time to get started on that. We saw very sharp declines in that bearish window.
In my post on Friday 28th Feb I was looking at the possibility that we might see a strong rally start that might deliver all time high retests on SPX, QQQ and DIA, and SPX has rallied 138 handles off that low so far. I’m leaning towards that extending higher and I’ll be talking about why that is.
In the background the world is changing rapidly. The US may be in the process of leaving NATO and may well soon be engaged in a trade war with their former NATO allies, starting with Canada tomorrow and very possibly continuing with the EU next month. The continuation of the US nuclear umbrella that has protected peace in the developed world since 1950 is now in doubt, and that means that we may well soon start to see widespread moves throughout the developed world for countries to develop their own nuclear weapons for their own security.
The tectonic plates of the political world are shifting rapidly and there may be some major political, economic and security earthquakes and tsunamis coming our way in coming months and years but …….. so far technical analysis seems to be working just fine. Hopefully that will remain the case.
Just to recap Friday’s post, one thing I’ve mentioned regularly below over the years is that we often see, at a serious high, a spike down that is then recovered before the real move begins. This happens a lot, and I’ve been weighing the possibility that we might see that here. In a forming high I call this making the low before the (main) high. These also happen at big lows and there I call this making the high before the low. That is what we may be seeing happen here.
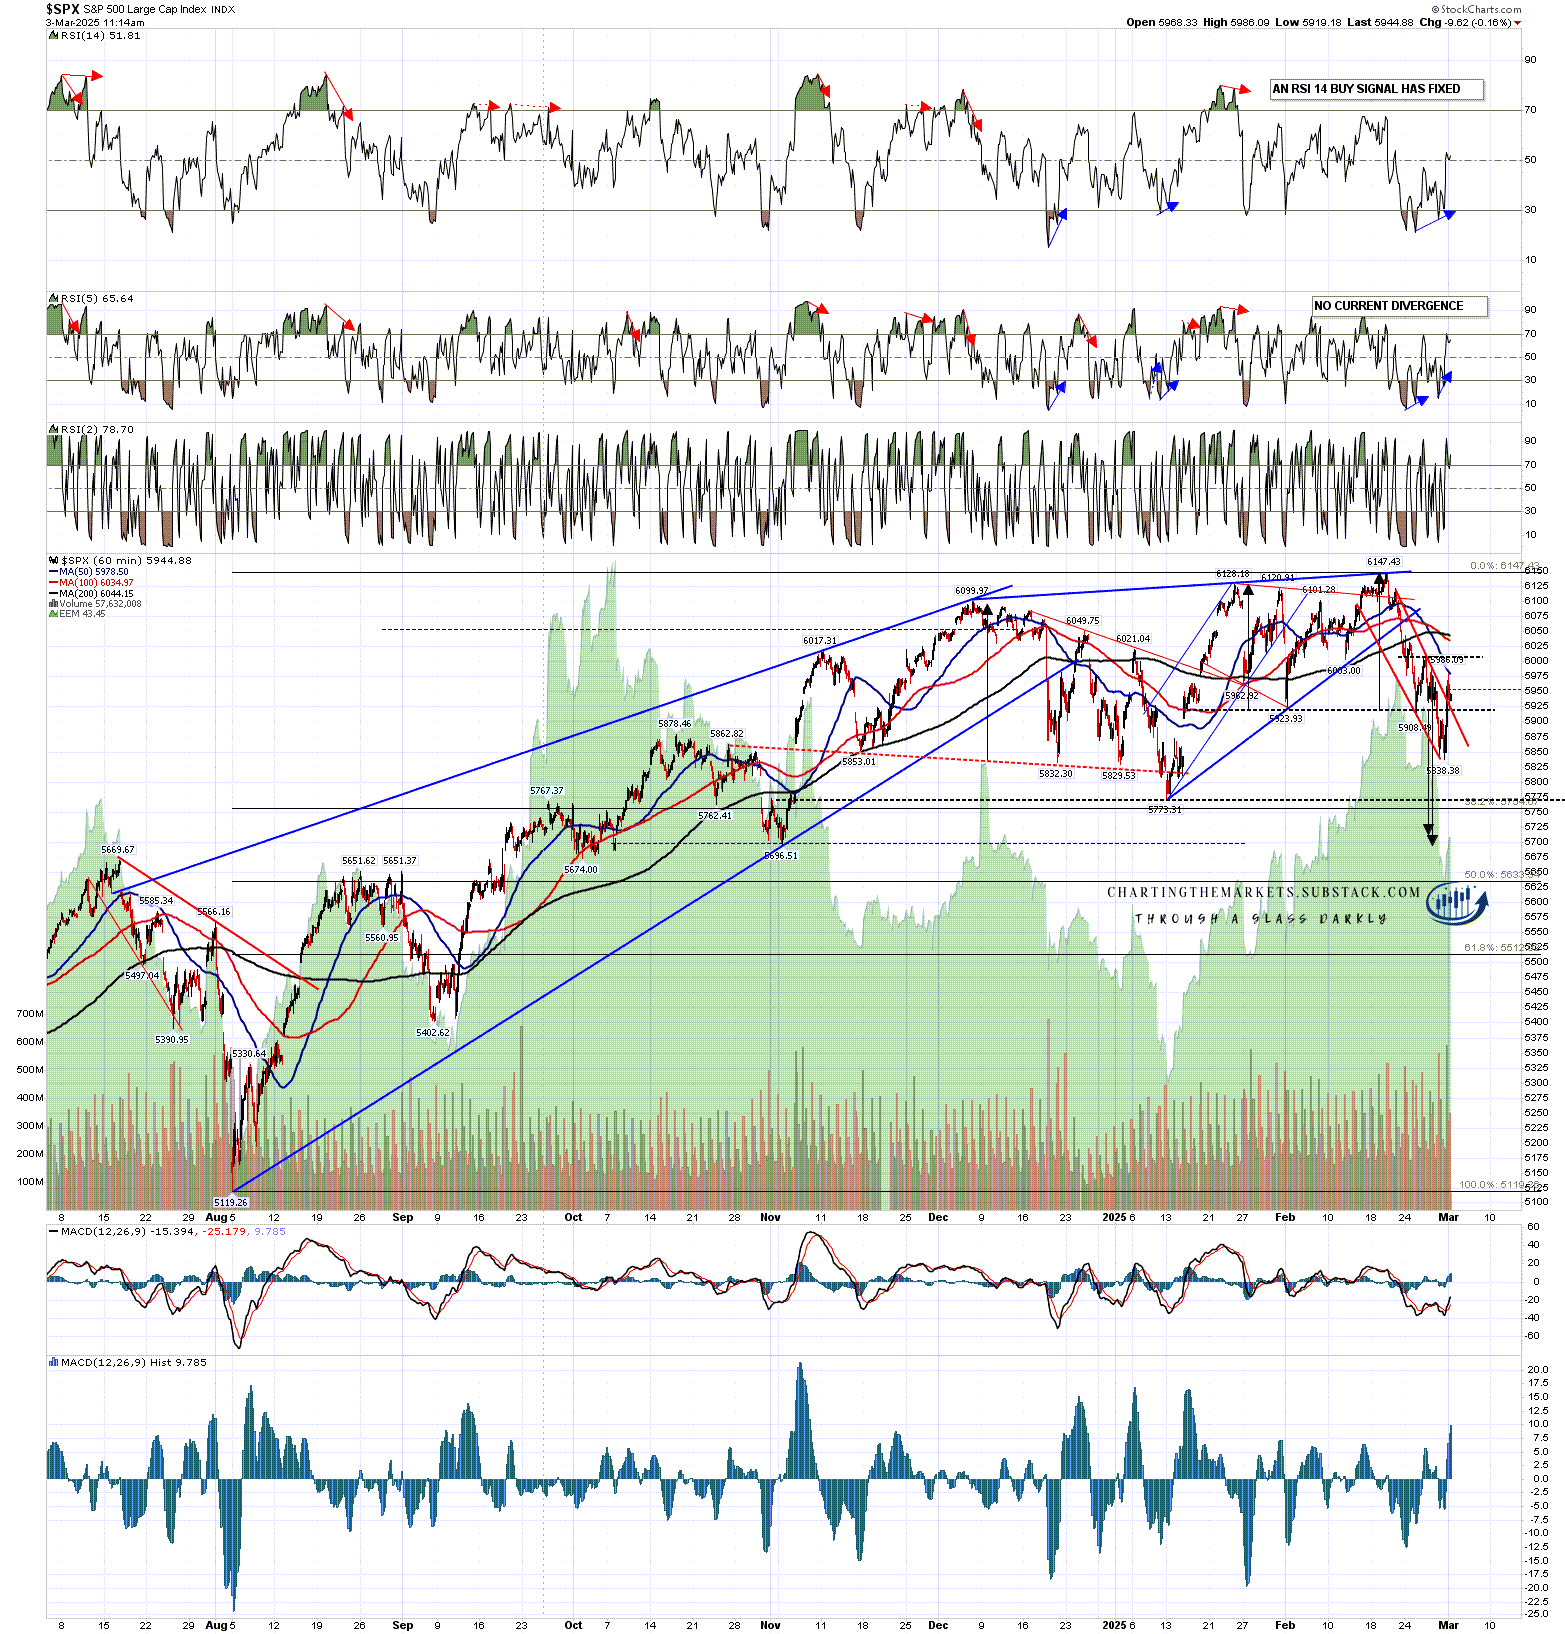
On the SPX hourly chart the smaller of the two nested double tops that I’ve been watching has broken down with a target in the 5695 to 5710 range, with the larger double top support at 5773.31. That is the downside scenario here of course.
I was looking on Friday morning at the falling wedge on SPX, which has now broken up, and the possible RSI 14 buy signal that was forming, which has now fixed. These are high quality buy signals and they generally reach target. If this one is to make target then SPX will likely go higher.
In the short term I’m watching two levels. The first is the possible IHS neckline in the 6010 area. If that should be tested and then a right shoulder forms (ideal right shoulder low 5910 area), then an IHS could form that on a sustained break over the IHS neckline would have a target at a retest of the all time high at 6147.43. This would be the most obviously bullish option.
The second level is the daily middle band, currently at 6034. This is key downtrend resistance and a break and conversion of this level to support would again set up a possible retest of the all time high.
SPX 60min chart:
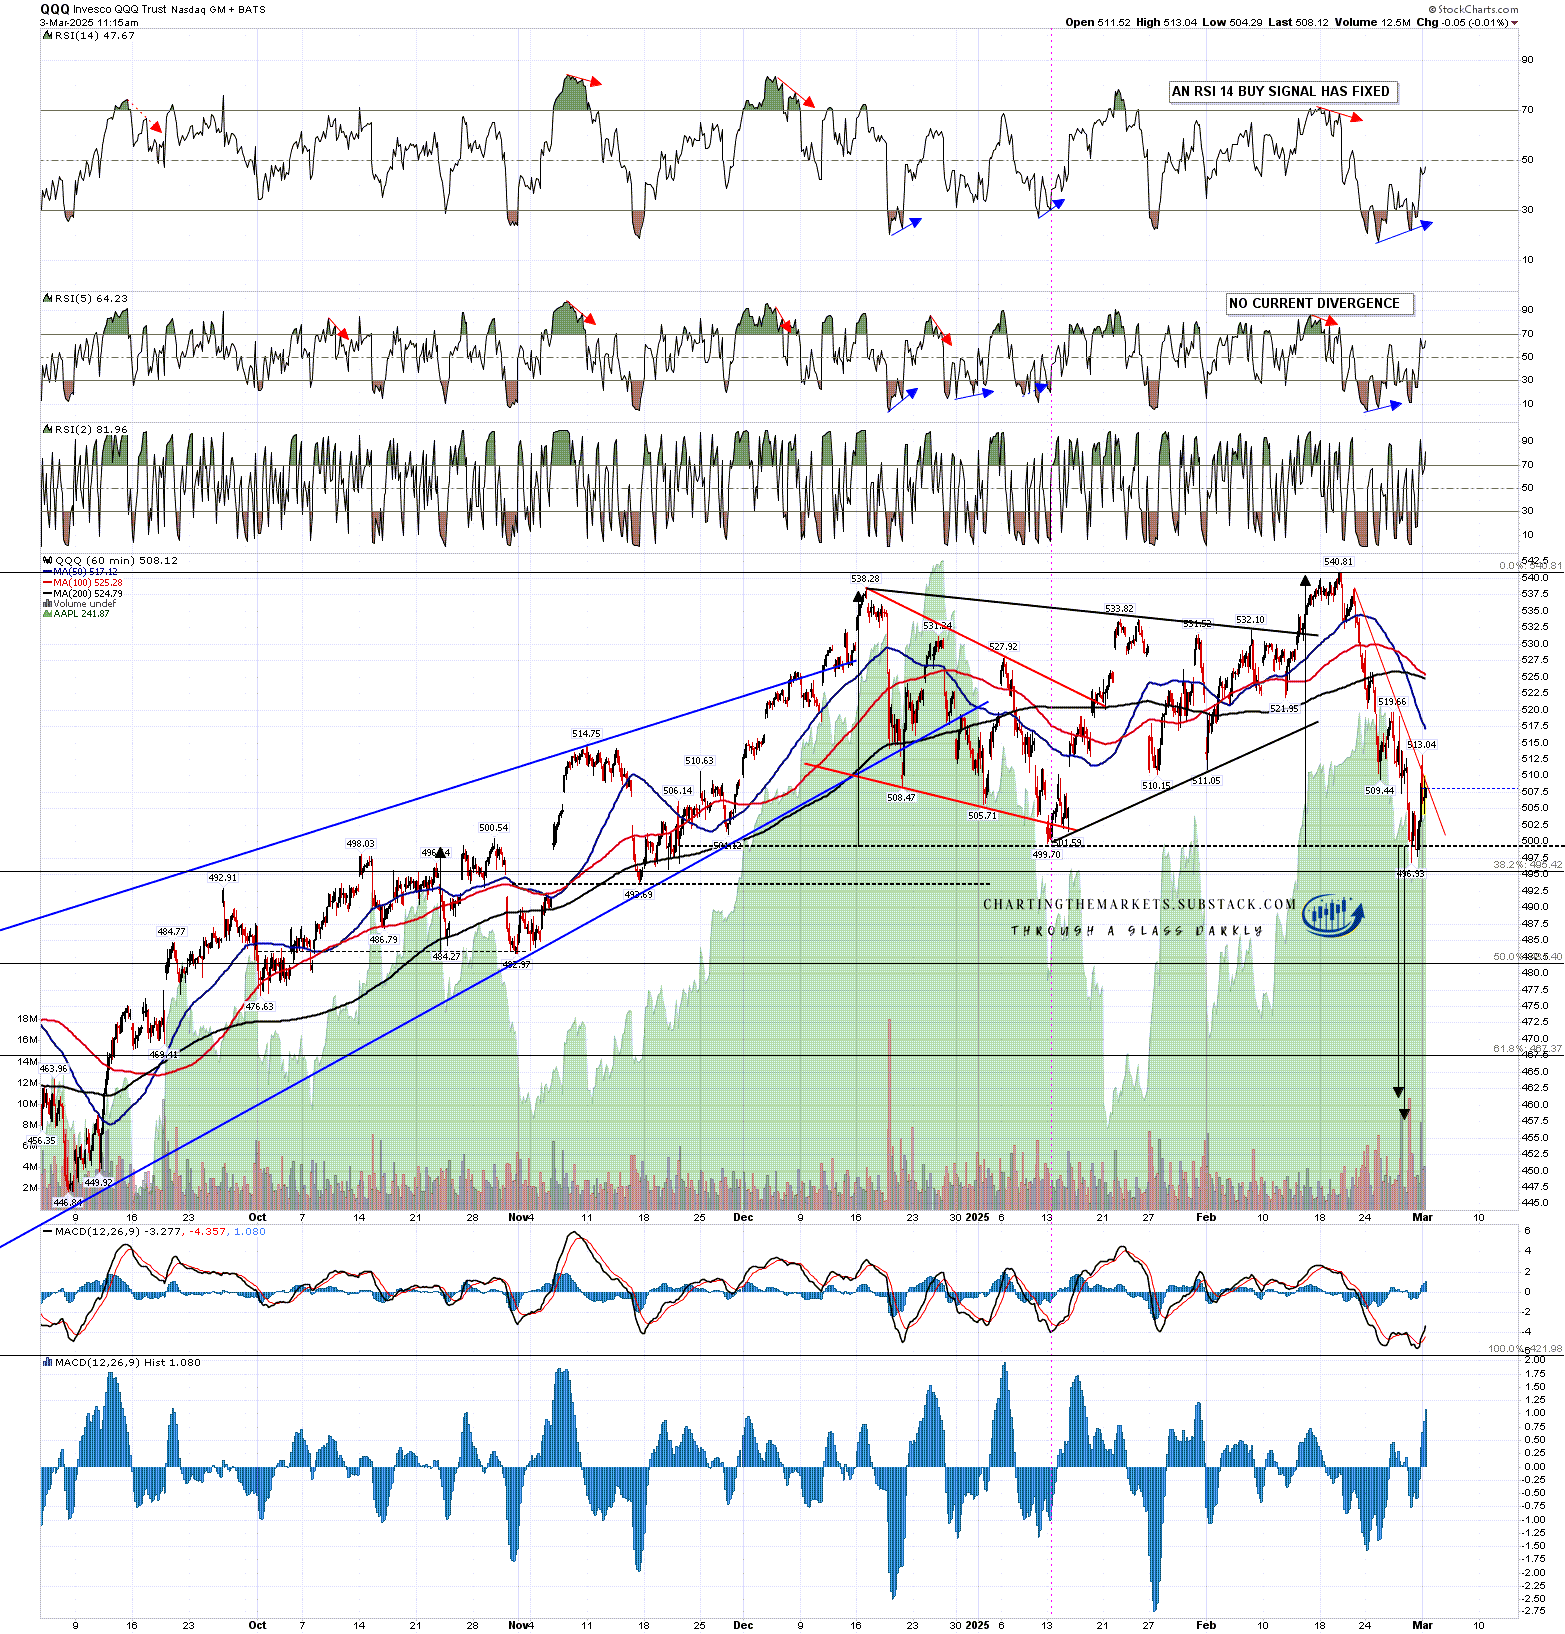
On the QQQ chart the main double top setup broke down at the low last week with a target in the 457.5 to 461 area. That is the downside scenario here of course.
I was also looking at a possible hourly RSI 14 sell signal brewing and that also fixed on Friday. Declining resistance from the all time high was also broken.
In the short term I’m watching two levels. The first is the possible IHS neckline in the 520 area. If that should be tested and then a right shoulder forms (ideal right shoulder low 510 area), then an IHS could form that on a sustained break over the IHS neckline would have a target at a retest of the all time high at 540.81. This would be the most obviously bullish option.
The second level is the daily middle band, currently at 524.5. This is key downtrend resistance and a break and conversion of this level to support would again set up a possible retest of the all time high.
QQQ 60min chart:
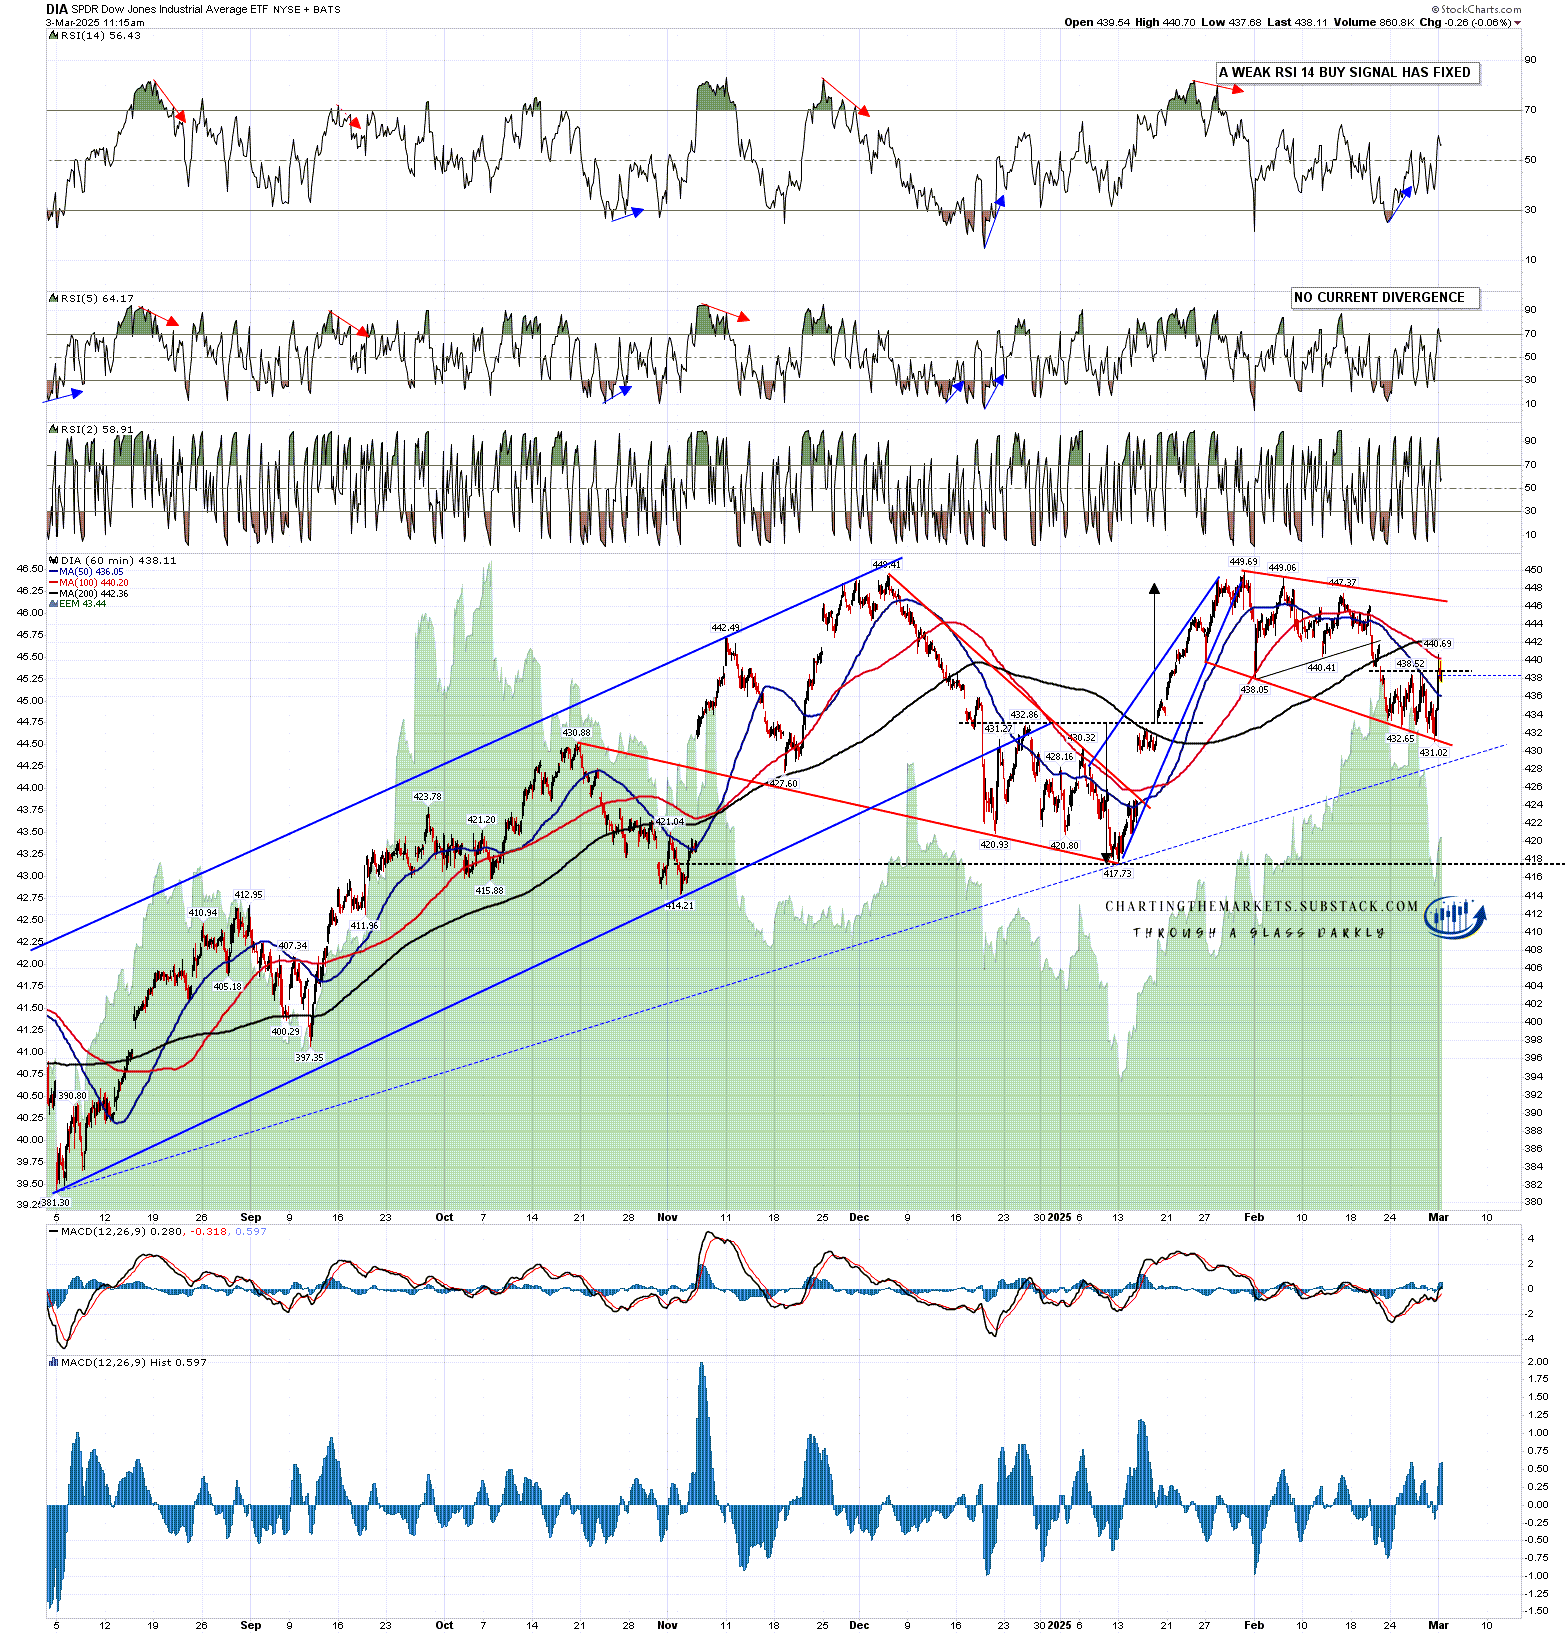
On DIA a weak hourly RSI 14 buy signal had already fixed, and a high quality bull flag megaphone had formed. If that breaks down then DIA can continue down towards double top support at 417.73, but until then the megaphone is suggesting that we could see another retest of the all time high next, and has made a lot of progress in that direction since Friday morning.
DIA 60min chart:
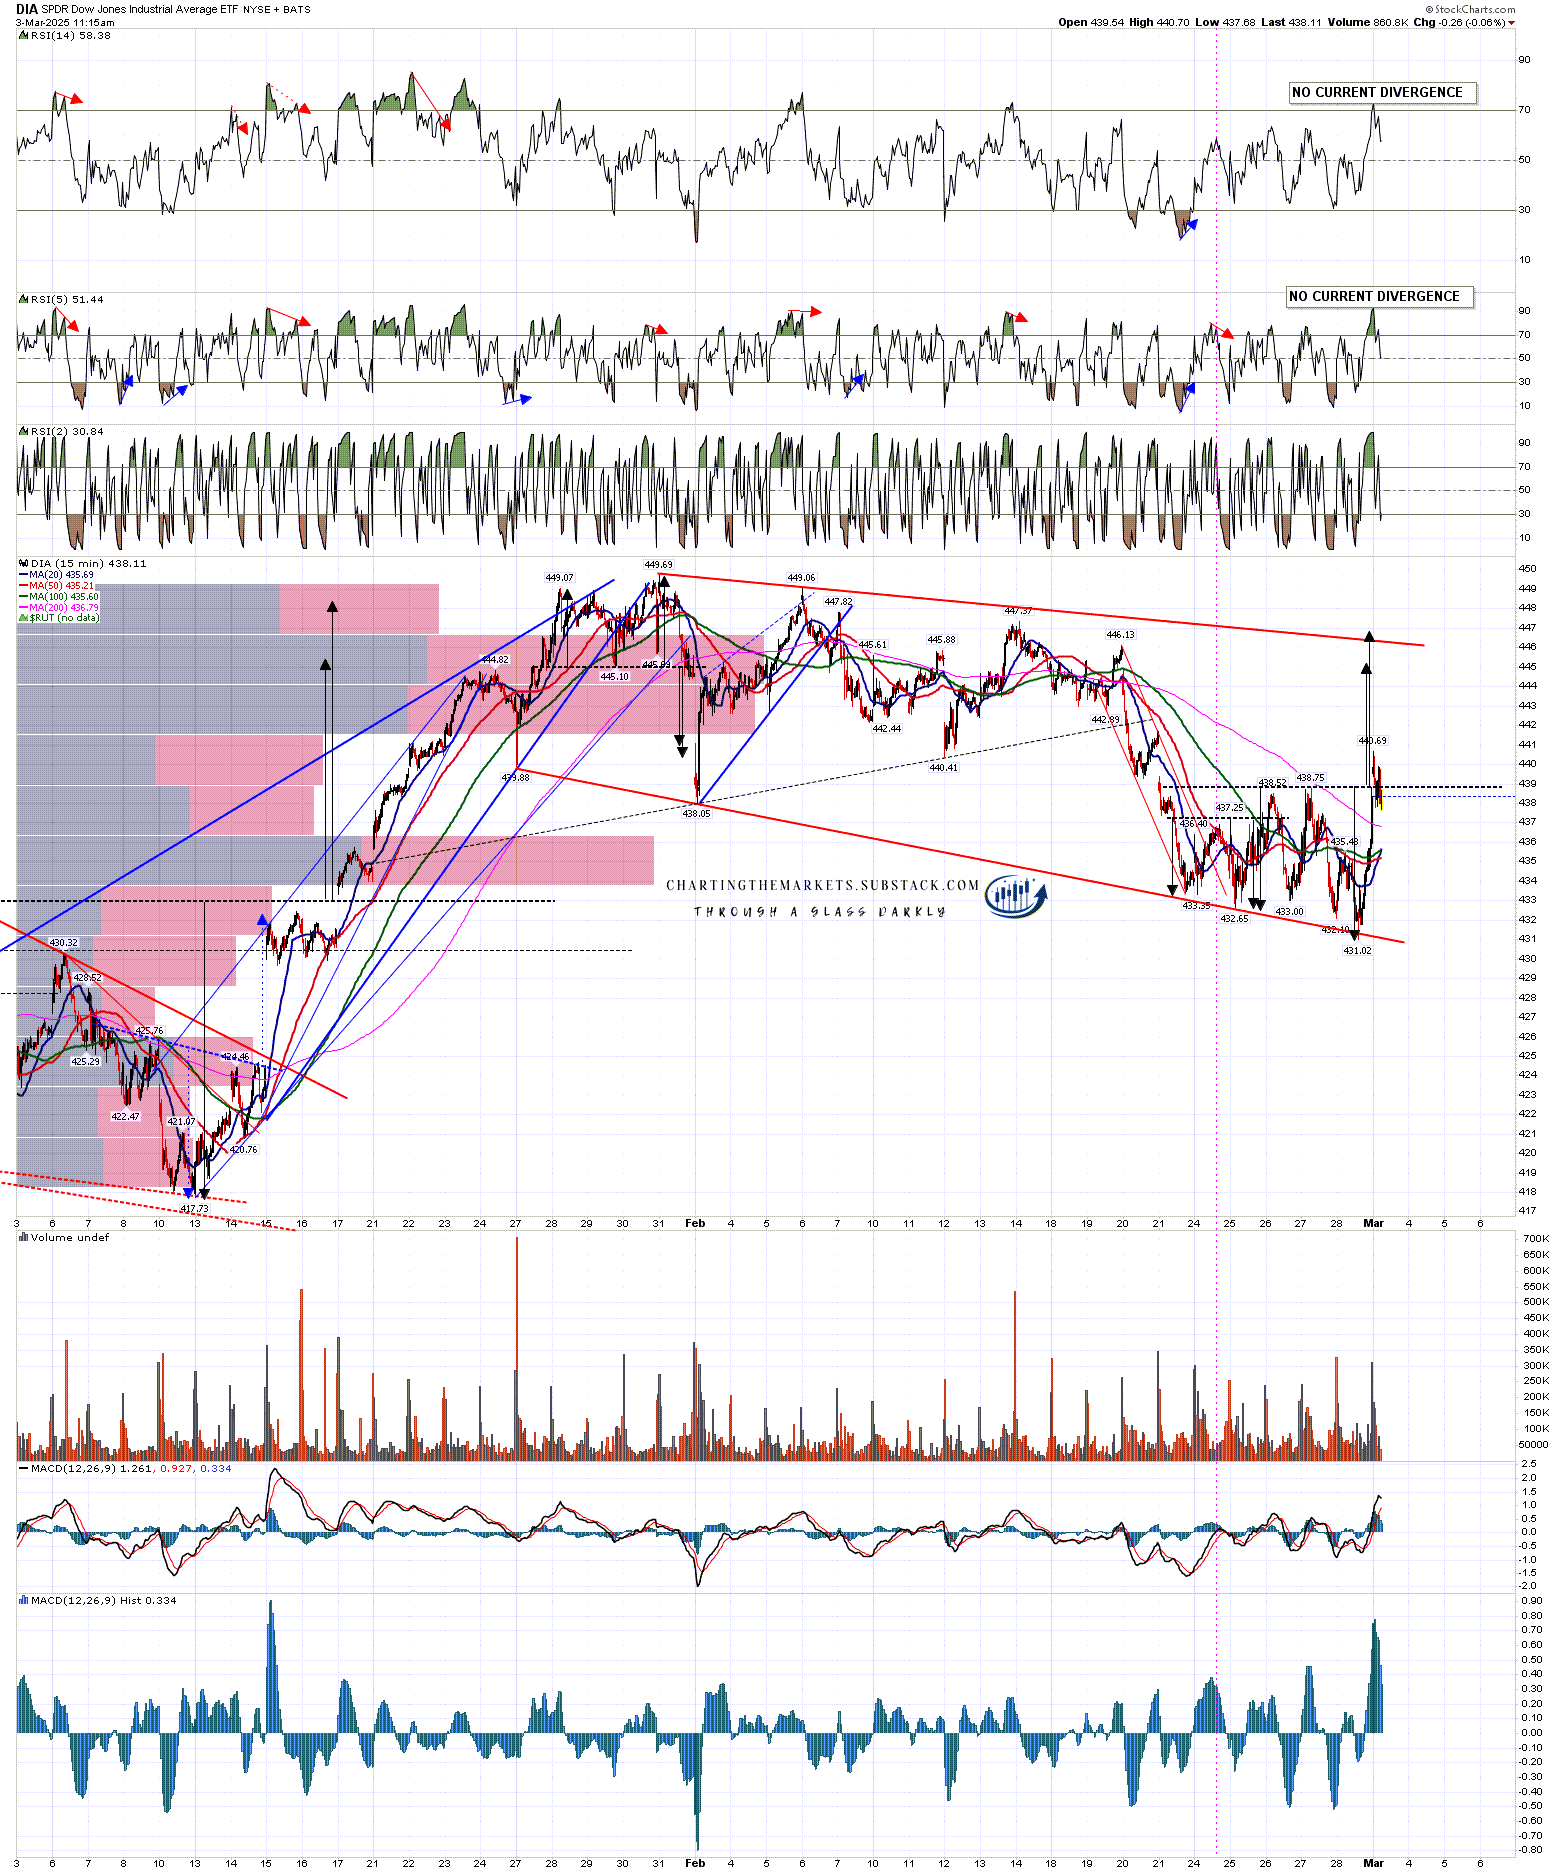
On the DIA 15min chart a decent quality double bottom has now broken up with a target in the 445-7 area, with possible bull flag megaphone resistance currently in the 446.4 area. A sustained break up over that bull flag resistance would look for a target at a retest of the all time high at 449.69.
DIA 15min chart:
The H&S that I have been looking at on IWM has now broken down with a target in the 183 area. There’s not much in terms of positive divergence or reversal setups to see on IWM here, but whenever a reversal pattern like this breaks down there is an opportunity either to reject back up into the high, or to continue down towards the target, and that generally happens not long after the break.
A weak hourly RSI 14 buy signal had already fixed on IWM and a small falling wedge from the February high broke up on Friday. IWM has been the weakest of these four indices for several months and the move off the low last weak has so far also been the weakest.
I am doubtful about seeing a really big rally on IWM but if it should rally back over the right shoulder high at 230.70 then the H&S would fail and a double bottom would be starting to break up with a target at the November high at 244.25. I will not be holding my breath waiting for that to happen but you never know.
IWM daily chart:
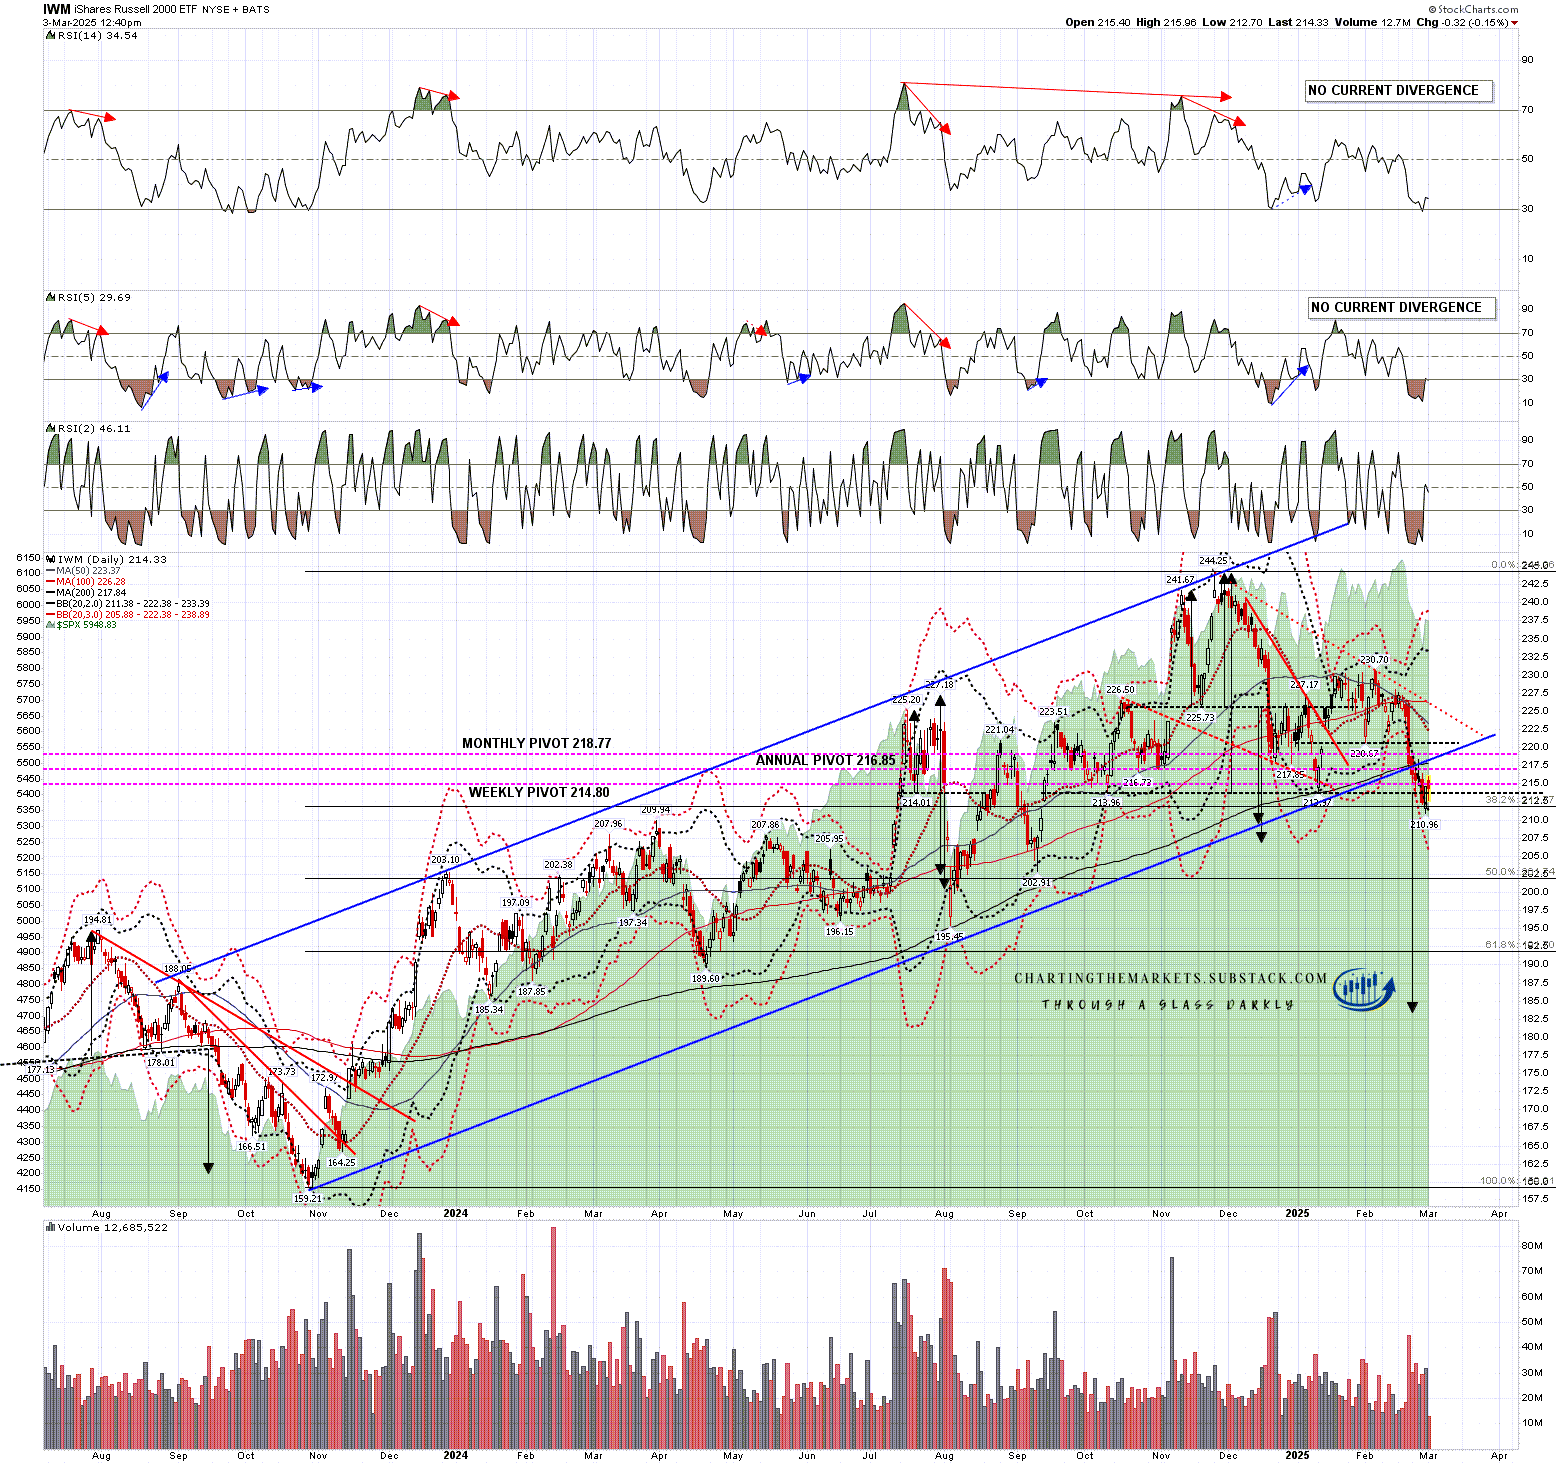
I think a significant high has been forming here, and that topping process may be complete, but if there is a last high to be be made in this process, then this would both be the obvious place to see that, and that move may now has started. We’ll see how that goes. On the bigger picture this would not be an obviously bullish setup, but would likely just deliver a last high retest before a larger retracement.
As I have been since the start of 2025 I’m still leaning on the bigger picture towards a weak first half of 2025 and new all time highs later in the year, very possibly as a topping process for a much more significant high. One way or another I think we’ll be seeing lower soon and I’m not expecting this to be a good year for US equities, not least because both of the last two years have been banner years for US equities. A third straight year of these kinds of gains looks like a big stretch. I could of course however be mistaken.
If you like my analysis and would like to see more, please take a free subscription at my chartingthemarkets substack, where I publish these posts first. I also do a premarket video every day on equity indices, bonds, currencies, energies, precious commodities and other commodities at 8.45am EST. If you’d like to see those I post the links every morning on my twitter, and the videos are posted shortly afterwards on my Youtube channel.
No comments:
Post a Comment