
In my post on 20th February I was looking at the big support levels on Bitcoin (BTCUSD), Solana (SOLUSD) and Ethereum (ETHUSD). I was leaning towards seeing a retracement / consolidation on Crypto in the first half of this year and then strong new highs towards the end of the year with possible bull market highs pencilled in for Nov/Dec 2025. So far the big levels on Solana and Ethereum have been tested and are holding, but the Bitcoin double top has not yet played out to the target at 69k to 70k and I’m still thinking that is likely.
In my post on 28th February I was putting the case that the bull market on Crypto isn’t over until the bull market on Bitcoin is over, and so far there is little indication of that, though that could change of course if there is a hard break below the 65k to 73.8k backtest zone.
I already covered this next chart on an earlier equities post this week, so if you’ve already seen this, just skip ahead.
Bitcoin is very significantly correlated with equity prices, but sometimes it makes a significant high earlier than equity prices. I’ve marked in the obvious four examples of this below in the last few years (red highlight zones), including the current one.
Now the first example marked from 2014 had Bitcoin retrace mostly without SPX for several months before bottoming while SPX delivered a modest decline in Q4 2014. A repeat of this could see both bottom out soon with a sharp last move down on Bitcoin while SPX declined modestly, but likely a bit more.
The other two examples also both have a sharp last move down on Bitcoin, but also a sharp move down on SPX. If we see a repeat of these two we would see a significant further decline on both Bitcoin and SPX into a low made together in one to six months. I’m leaning towards this scenario here.
I would note that all of these scenarios involve a sharp lower low on Bitcoin, but I’m expecting that in any case. I have a double top that has broken down on Bitcoin with a target in the 69k to 70k area, in a very attractive bullish retracement and backtest target zone, and I’m not seeing any obvious reason to think that won’t make target.
BTCUSD weekly (LOG) vs SPX chart:
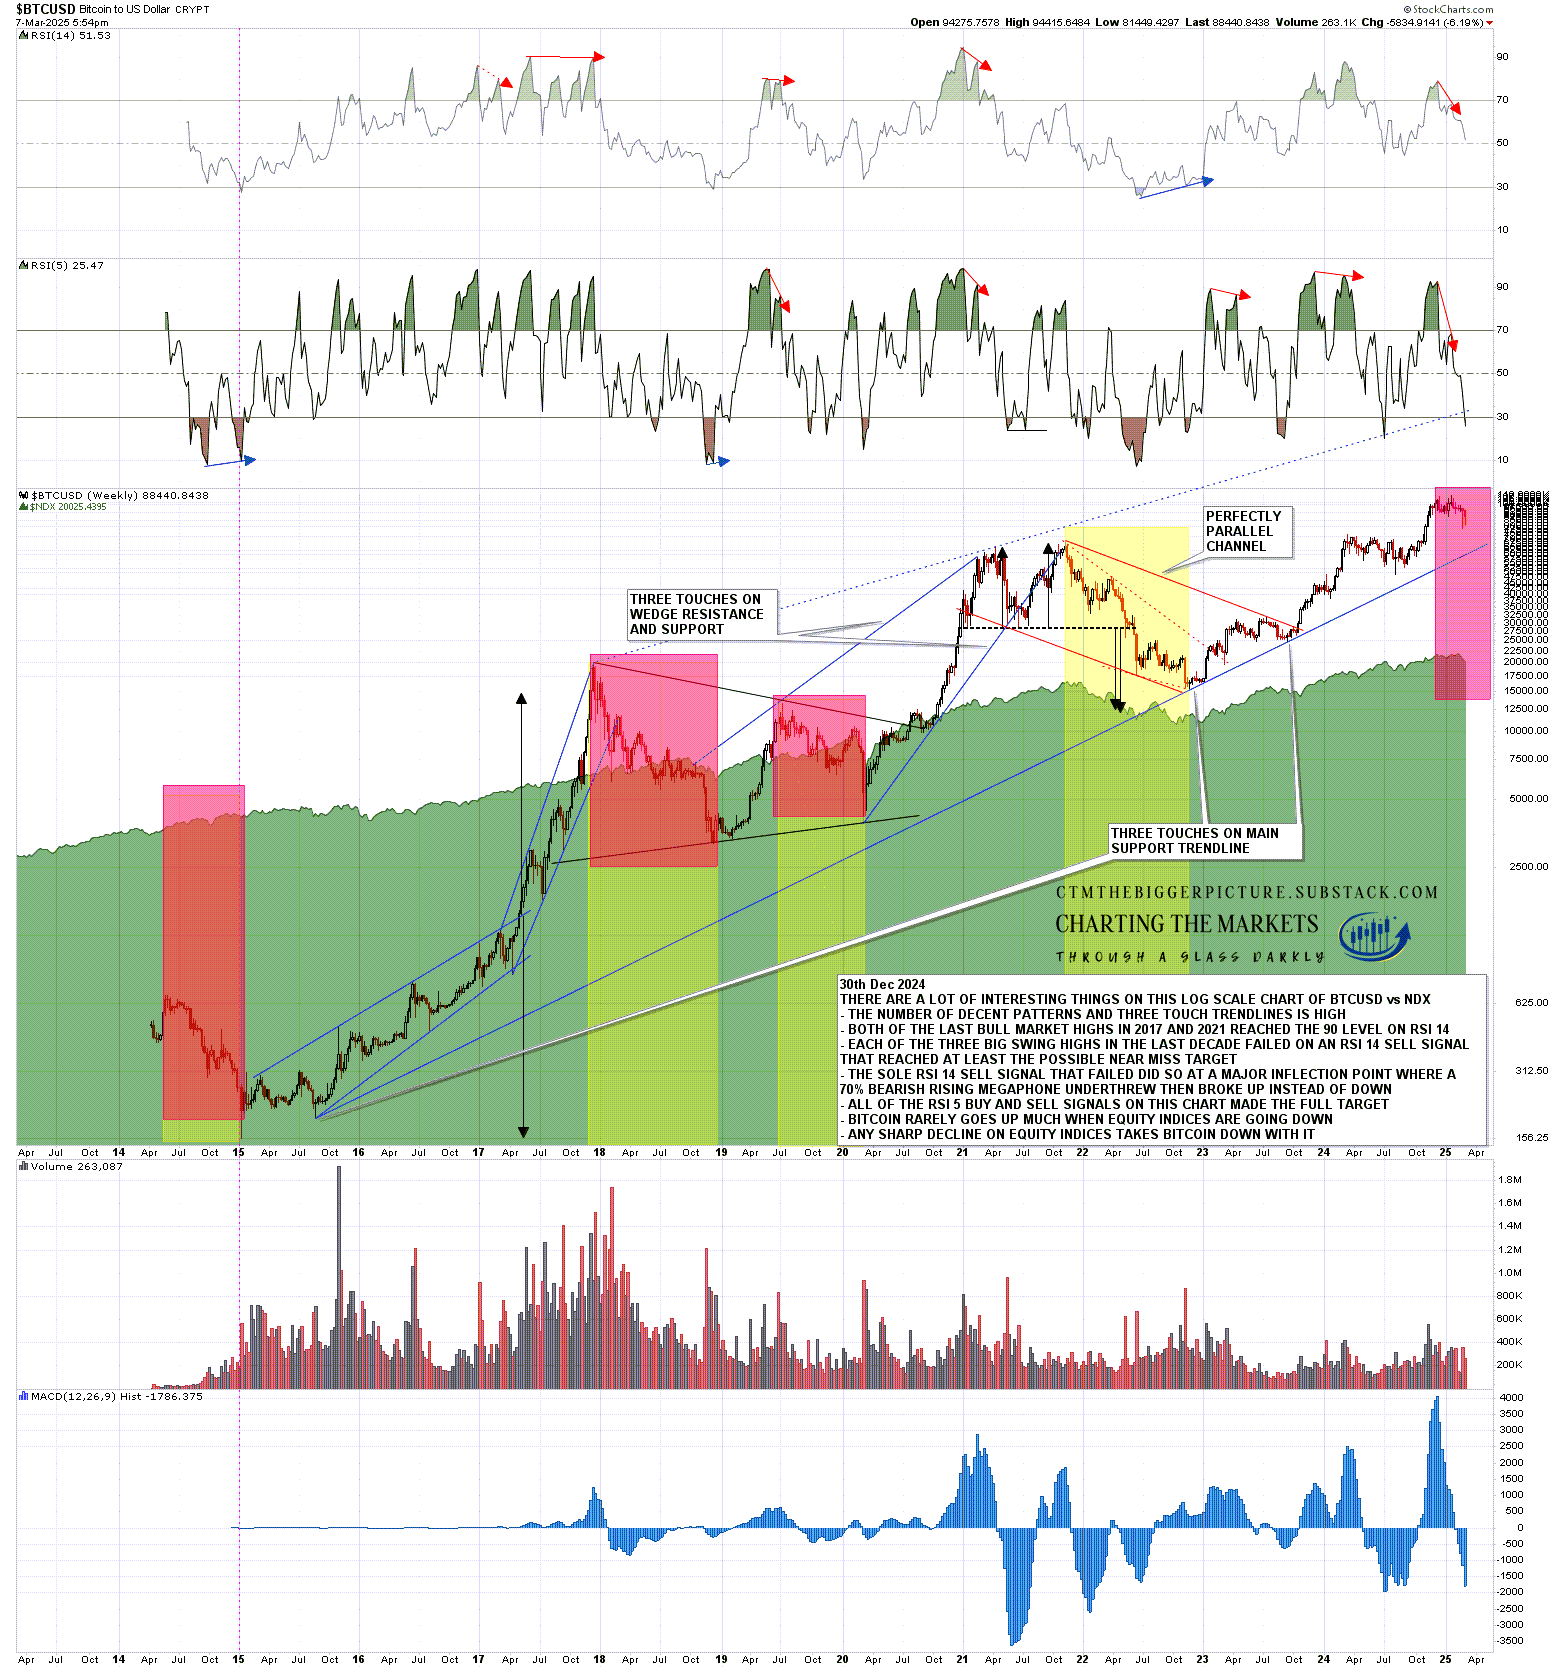
On the Bitcoin chart below you can see the very nice double top that has broken down with a target in the 69k to 70k area.
I would also note that current downtrend resistance is at the daily middle band, currently at 91363, and the first strong resistance on any rally.
BTCUSD daily chart:
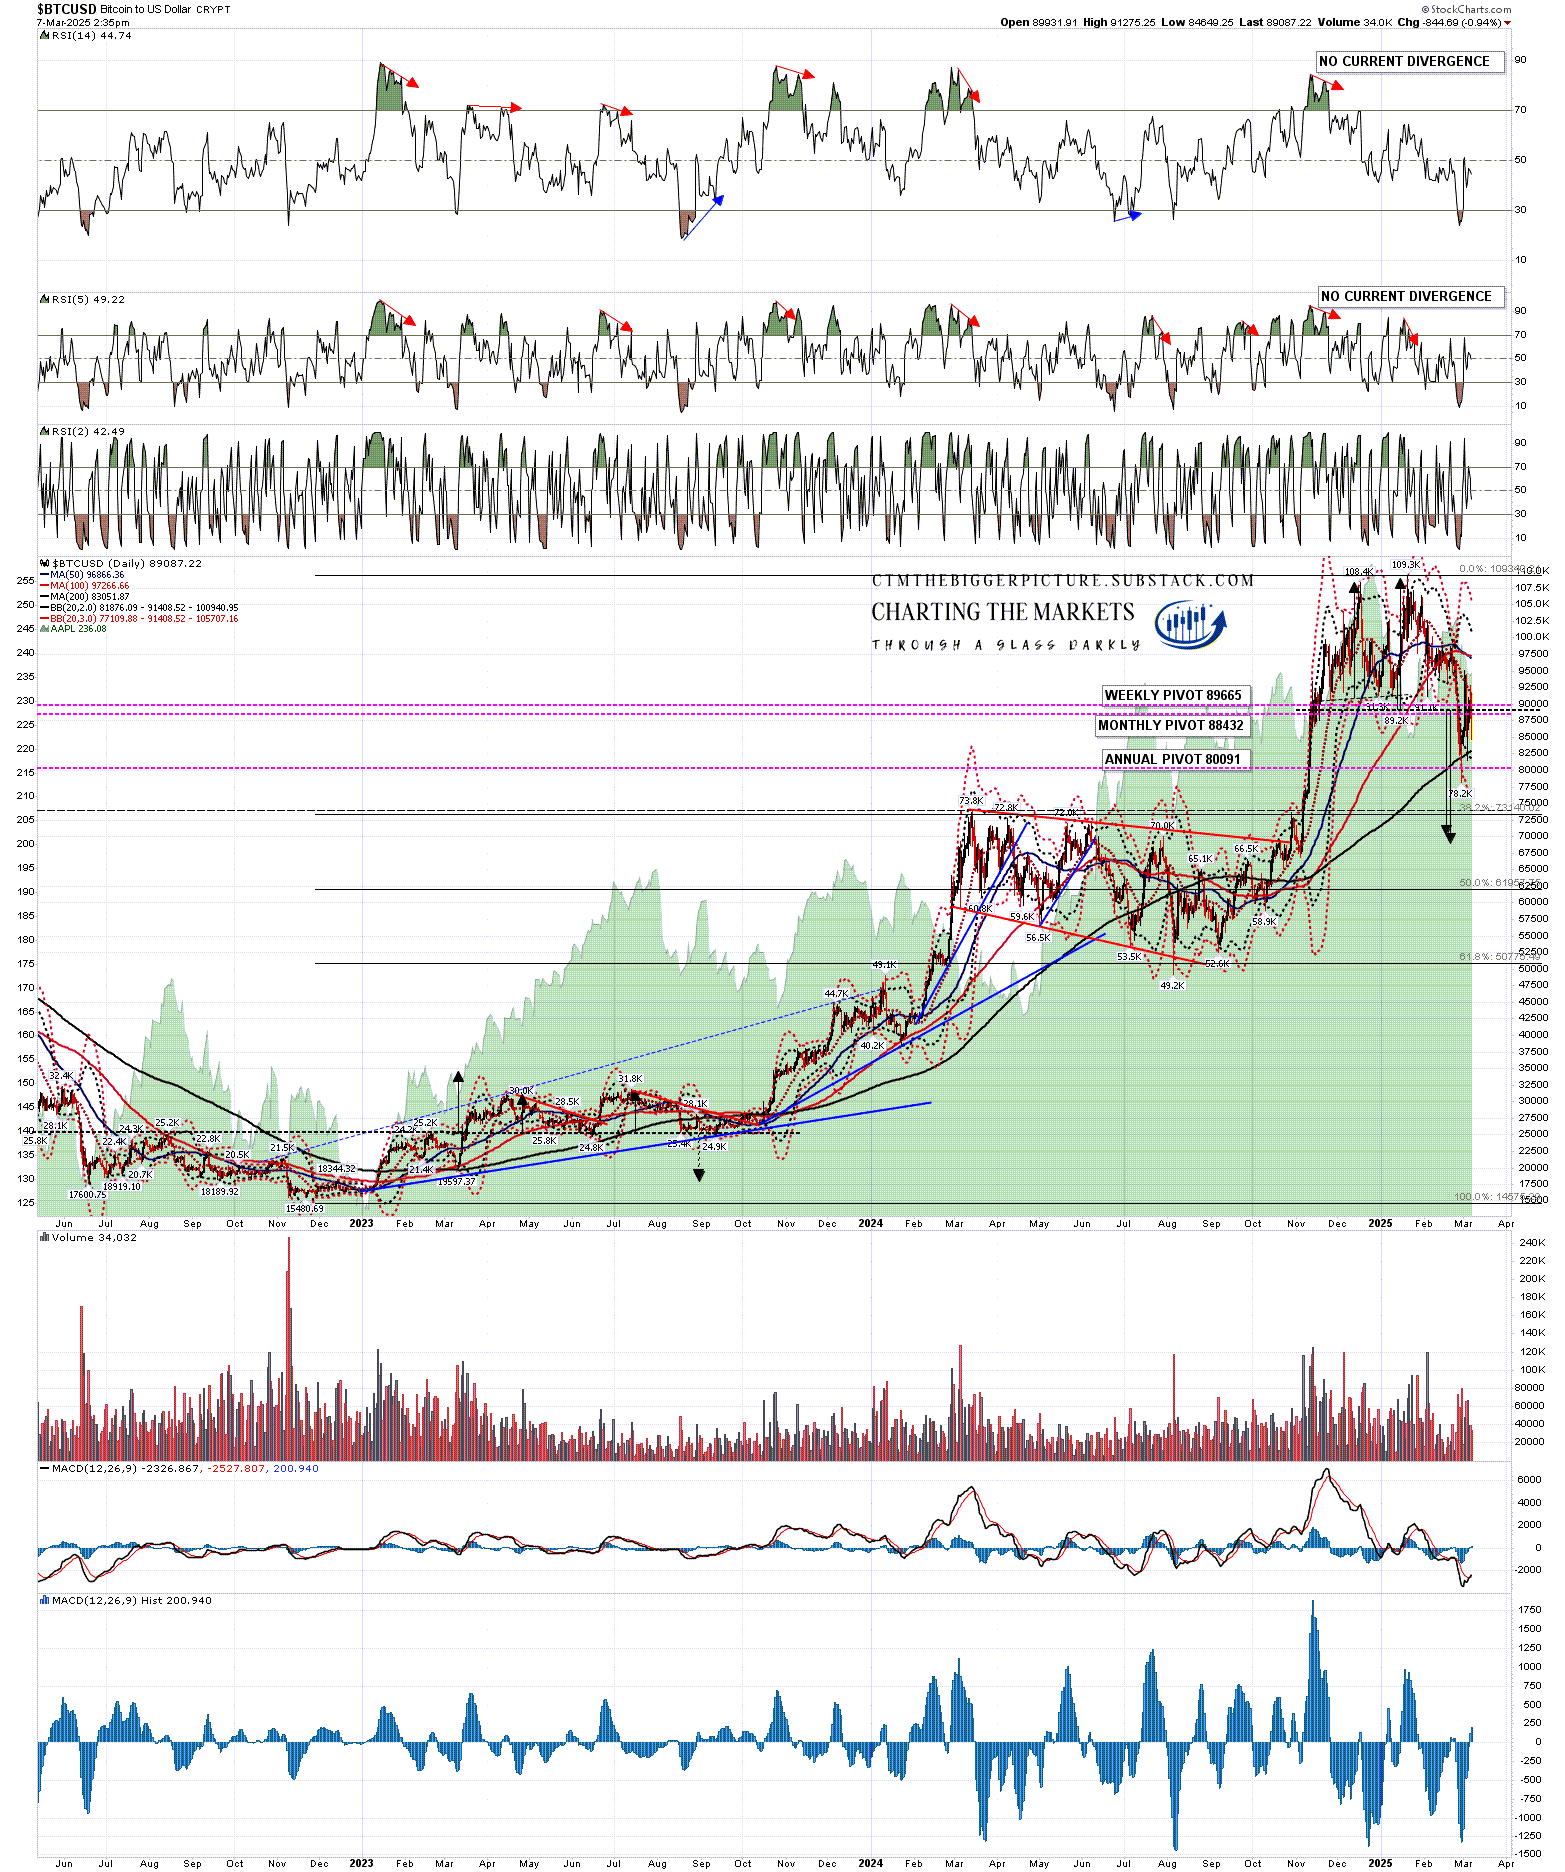
If Bitcoin can get back above the daily middle band, then there is another very attractive looking target area that could be reached if the pattern currently forming is a bear flag rather than a bear triangle.
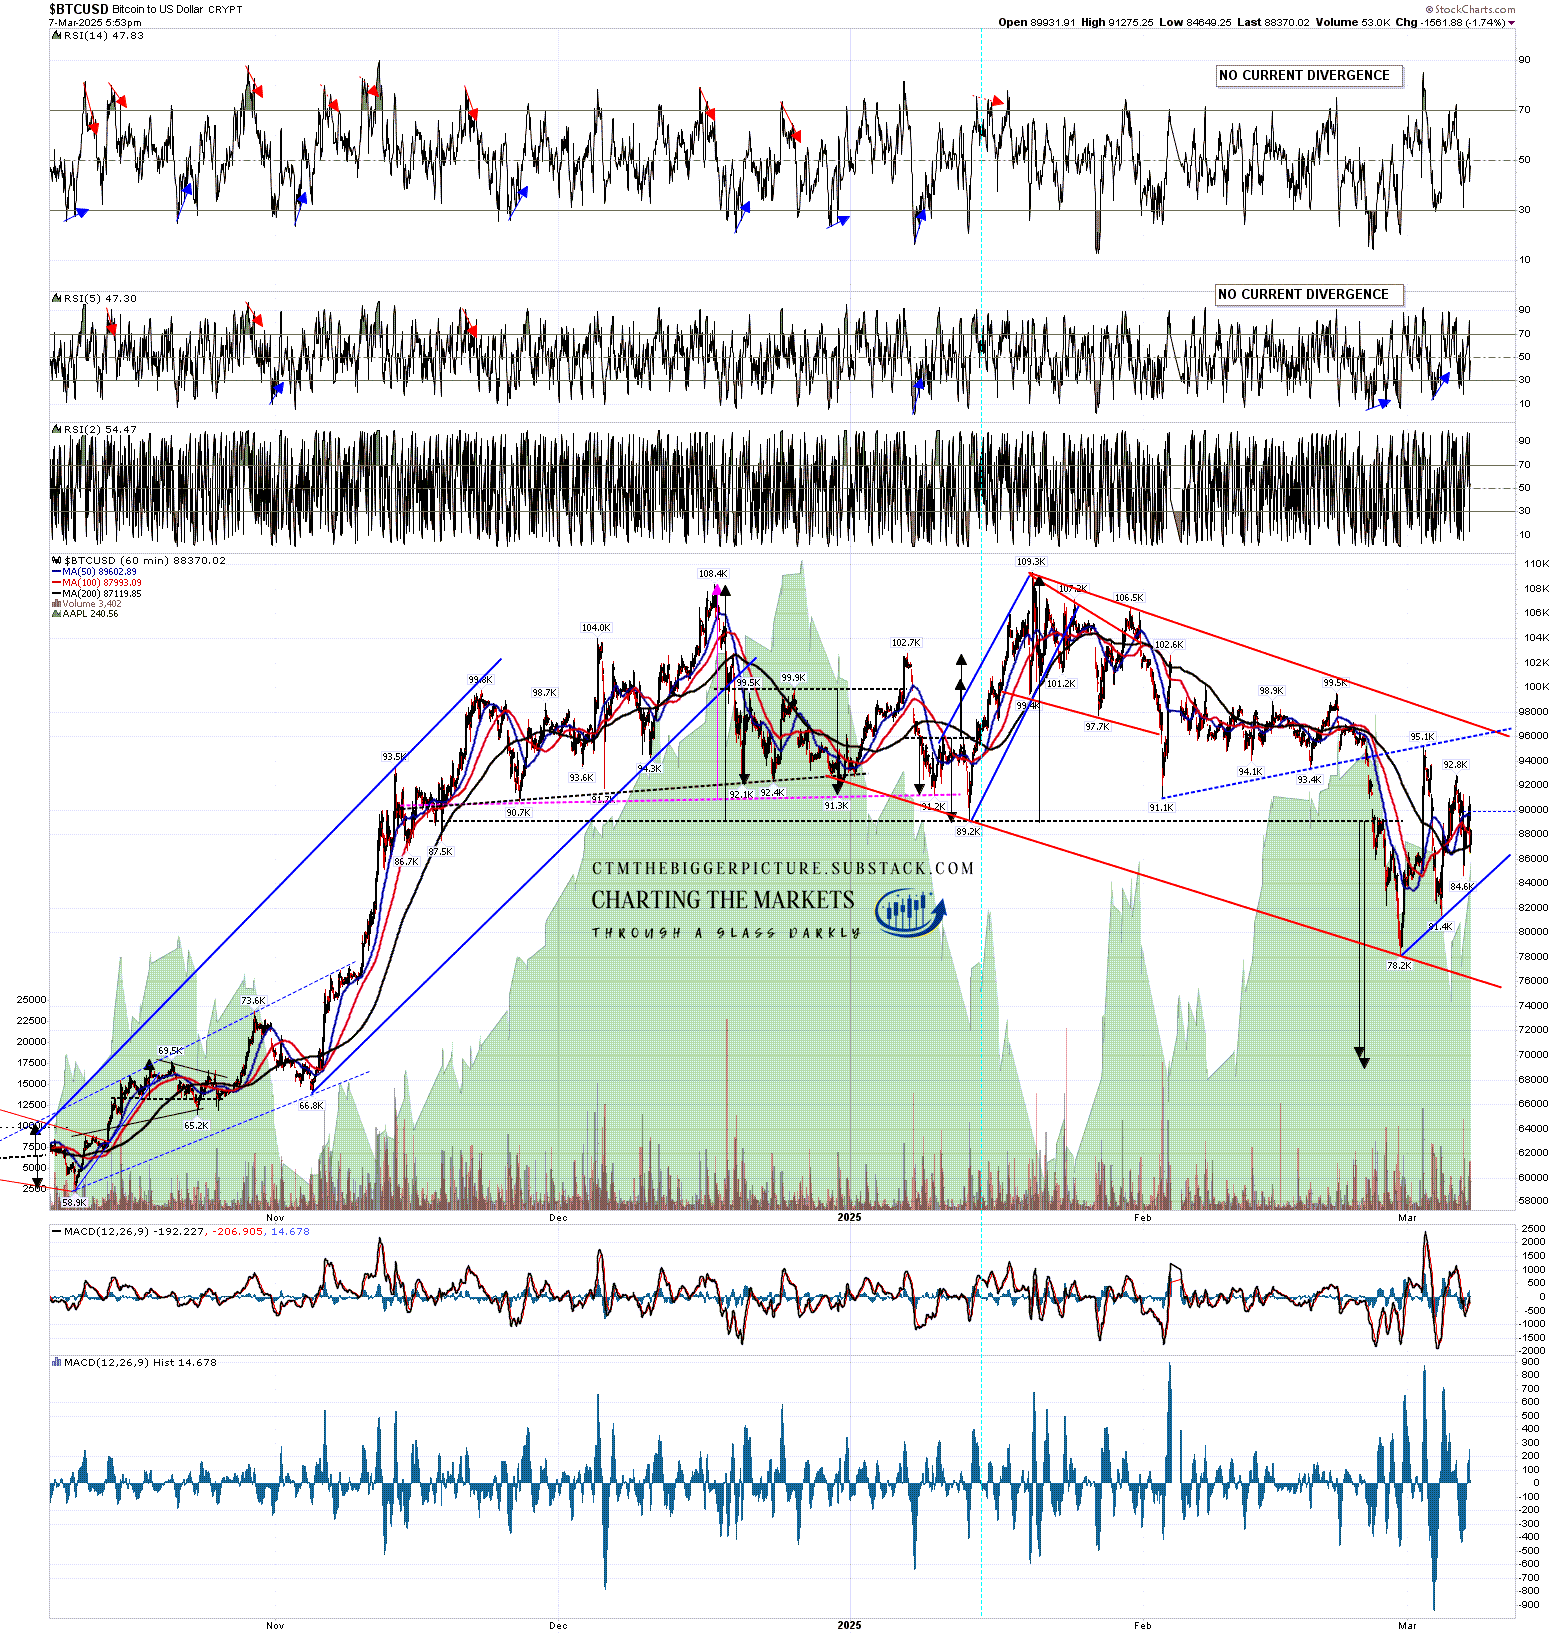
There is a very high quality resistance trendline that has formed that is currently in the 96k area and might be the resistance trendline on a high quality rising wedge bear flag. That is close to declining resistance from the ATH at 109.3k, currently in the 97.3k area and would intersect that in about a week. If a bear flag is forming here then that area would be the obvious next target before likely lower lows.
BTCUSD 60min chart:
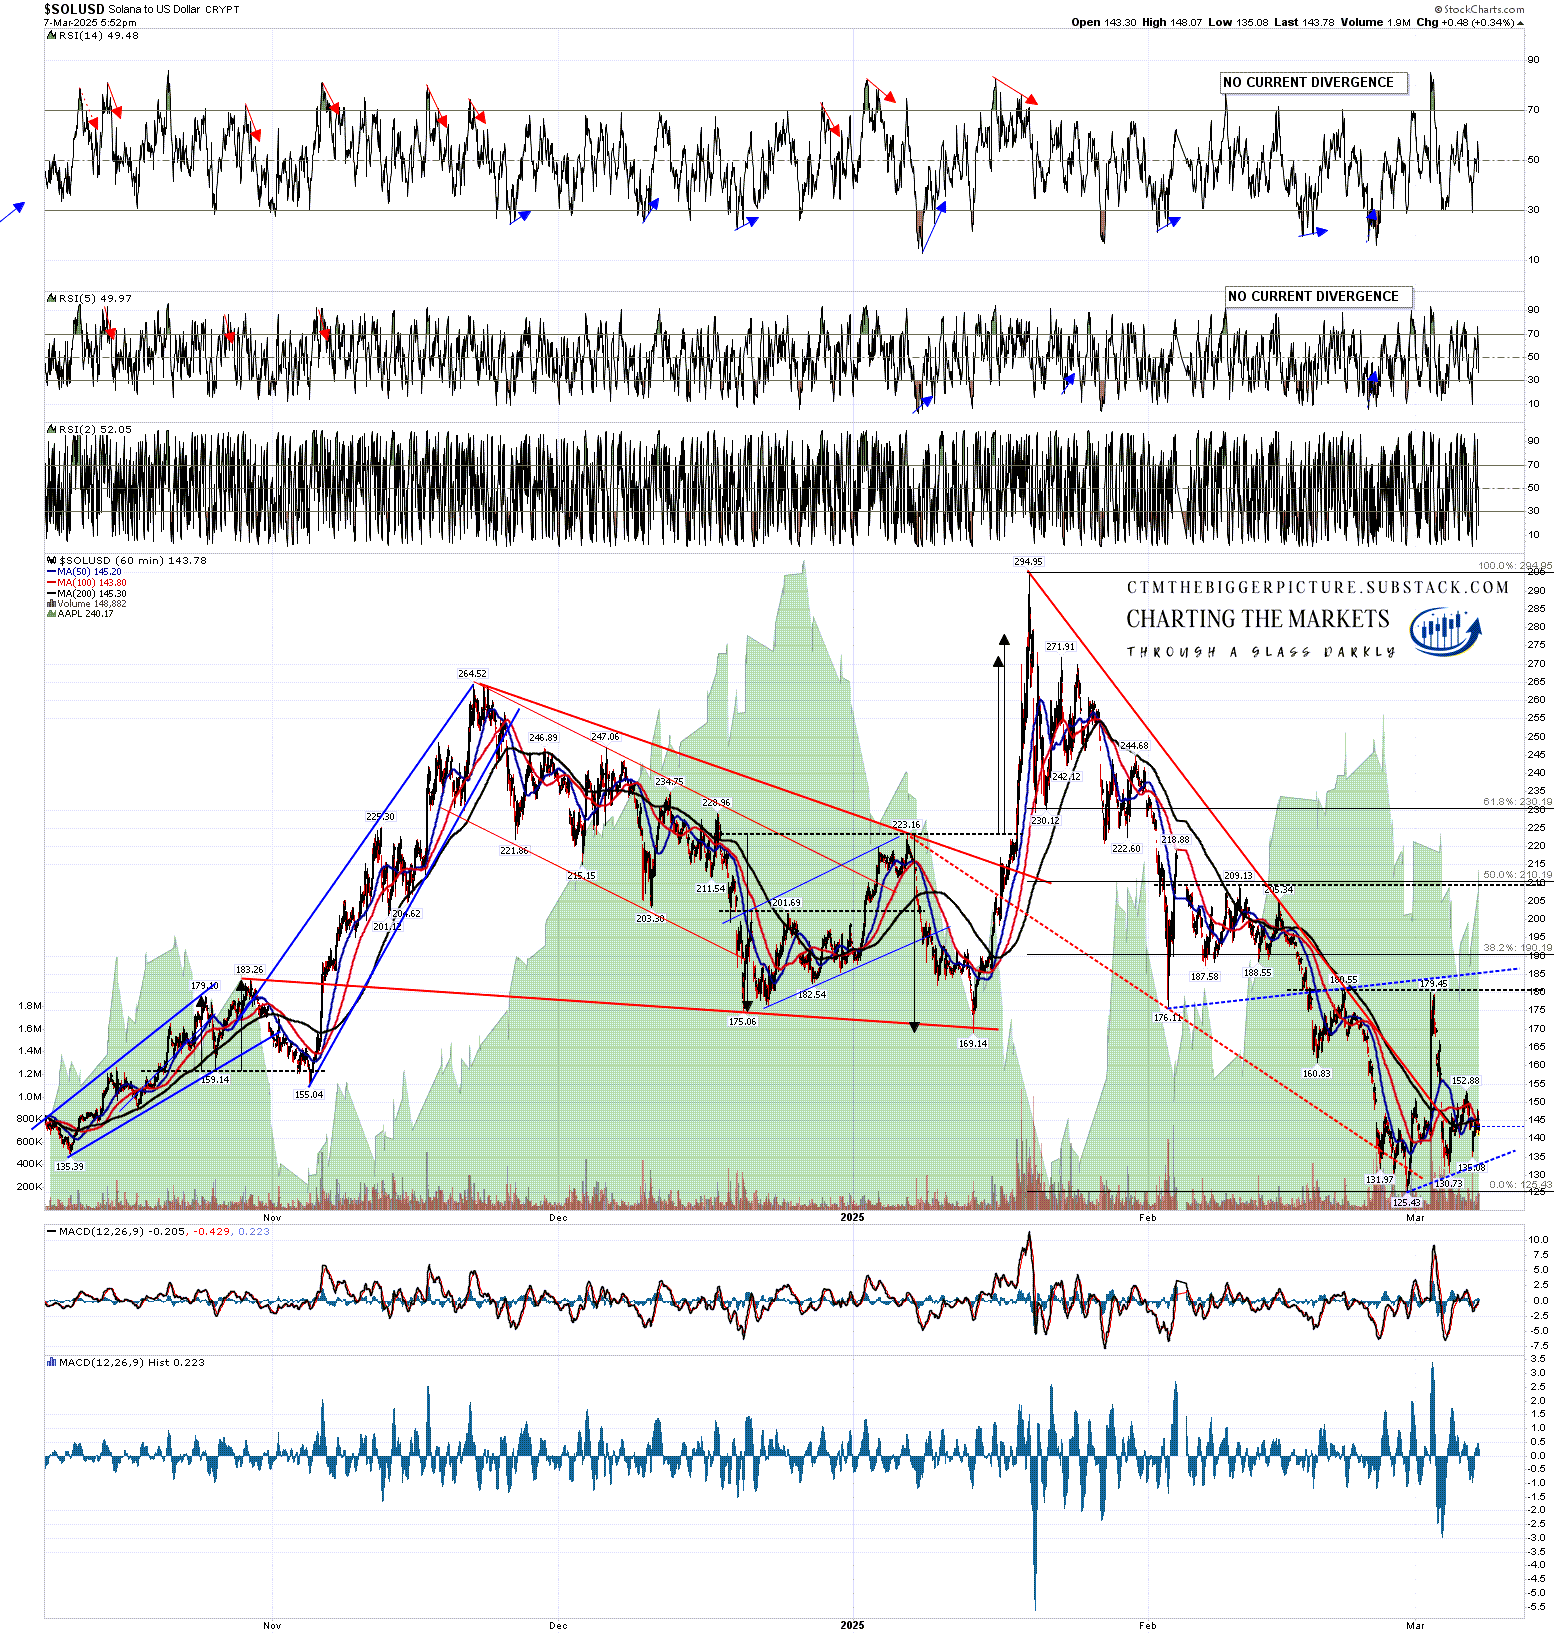
The setup on Solana isn’t as attractive but is decent, and there the ideal rising wedge bear flag would be in the 185 area.
SOLUSD 60min chart:
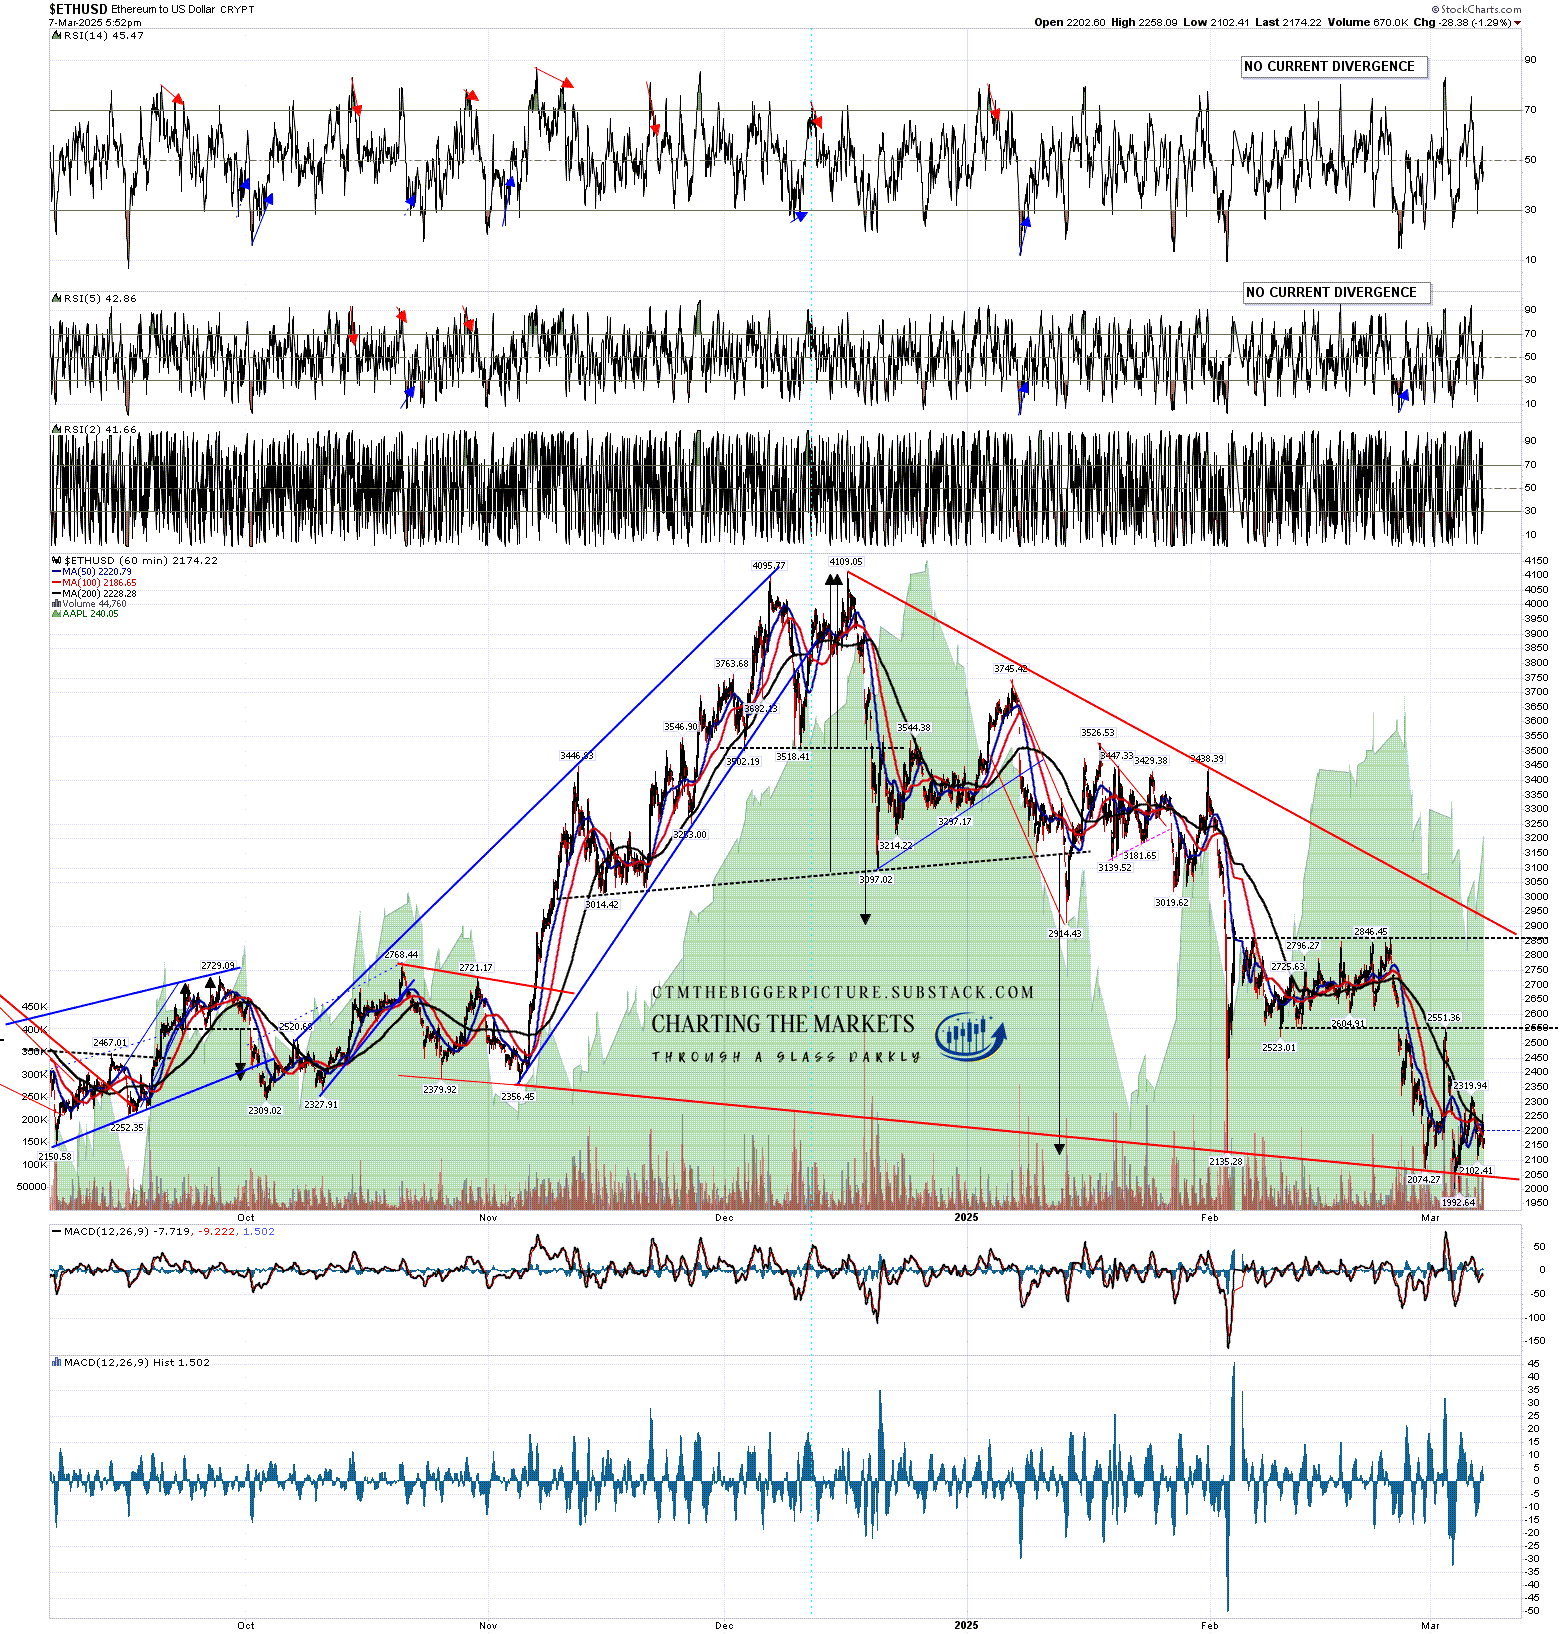
There is no obvious bear flag forming on Ethereum of any size, but a break over 2551.36 would look for a target in the 3025 area. Overall falling wedge resistance is currently in the 2925.
ETHUSD 60min chart:
What would really be helpful in terms of seeing this rally happen would be a strong rally here on equity indices. One may be starting here but, if so, is still just getting started. We’ll see. Everyone have a great weekend :-)
So far this year I have been and am still leaning towards seeing weakness in the first half of the year and renewed strength in the second half of 2025, with a very possible bull market high on Crypto pencilled in close to the end of the year. That scenario would be a good match with past Crypto bull markets. Is it possible that I am mistaken? Always, but we can only ever try to identify the higher probability paths in the future. Only time can show us the path that is actually taken. Still, I’m with Confucious who said ‘study the past, if you would divine the future’.
If you’d like to see more of these posts and the other Crypto videos and information I post, please subscribe for free to my Crypto substack. I also do a premarket video every day on Crypto at 9.05am EST. If you’d like to see those I post the links every morning on my twitter, and the videos are posted shortly afterwards on my Youtube channel.
I'm also to be found at Arion Partners, though as a student rather than as a teacher. I've been charting Crypto for some years now, but am learning to trade and invest in them directly, and Arion Partners are my guide around a space that might reasonably be compared to the Wild West in one of their rougher years.

No comments:
Post a Comment