
In my last post on Monday I was looking at a significant inflection point on equities which could either deliver a reversal higher, possibly into new all time highs, or fail lower into a larger inflection point at a retest and break of the November lows.
Any inflection point can always break either way and since then SPX, QQQ, DIA and IWM have all made lower lows. So what now?
The first thing to say is that we now have topping patterns that have broken down across all of SPX, QQQ, DIA and IWM.
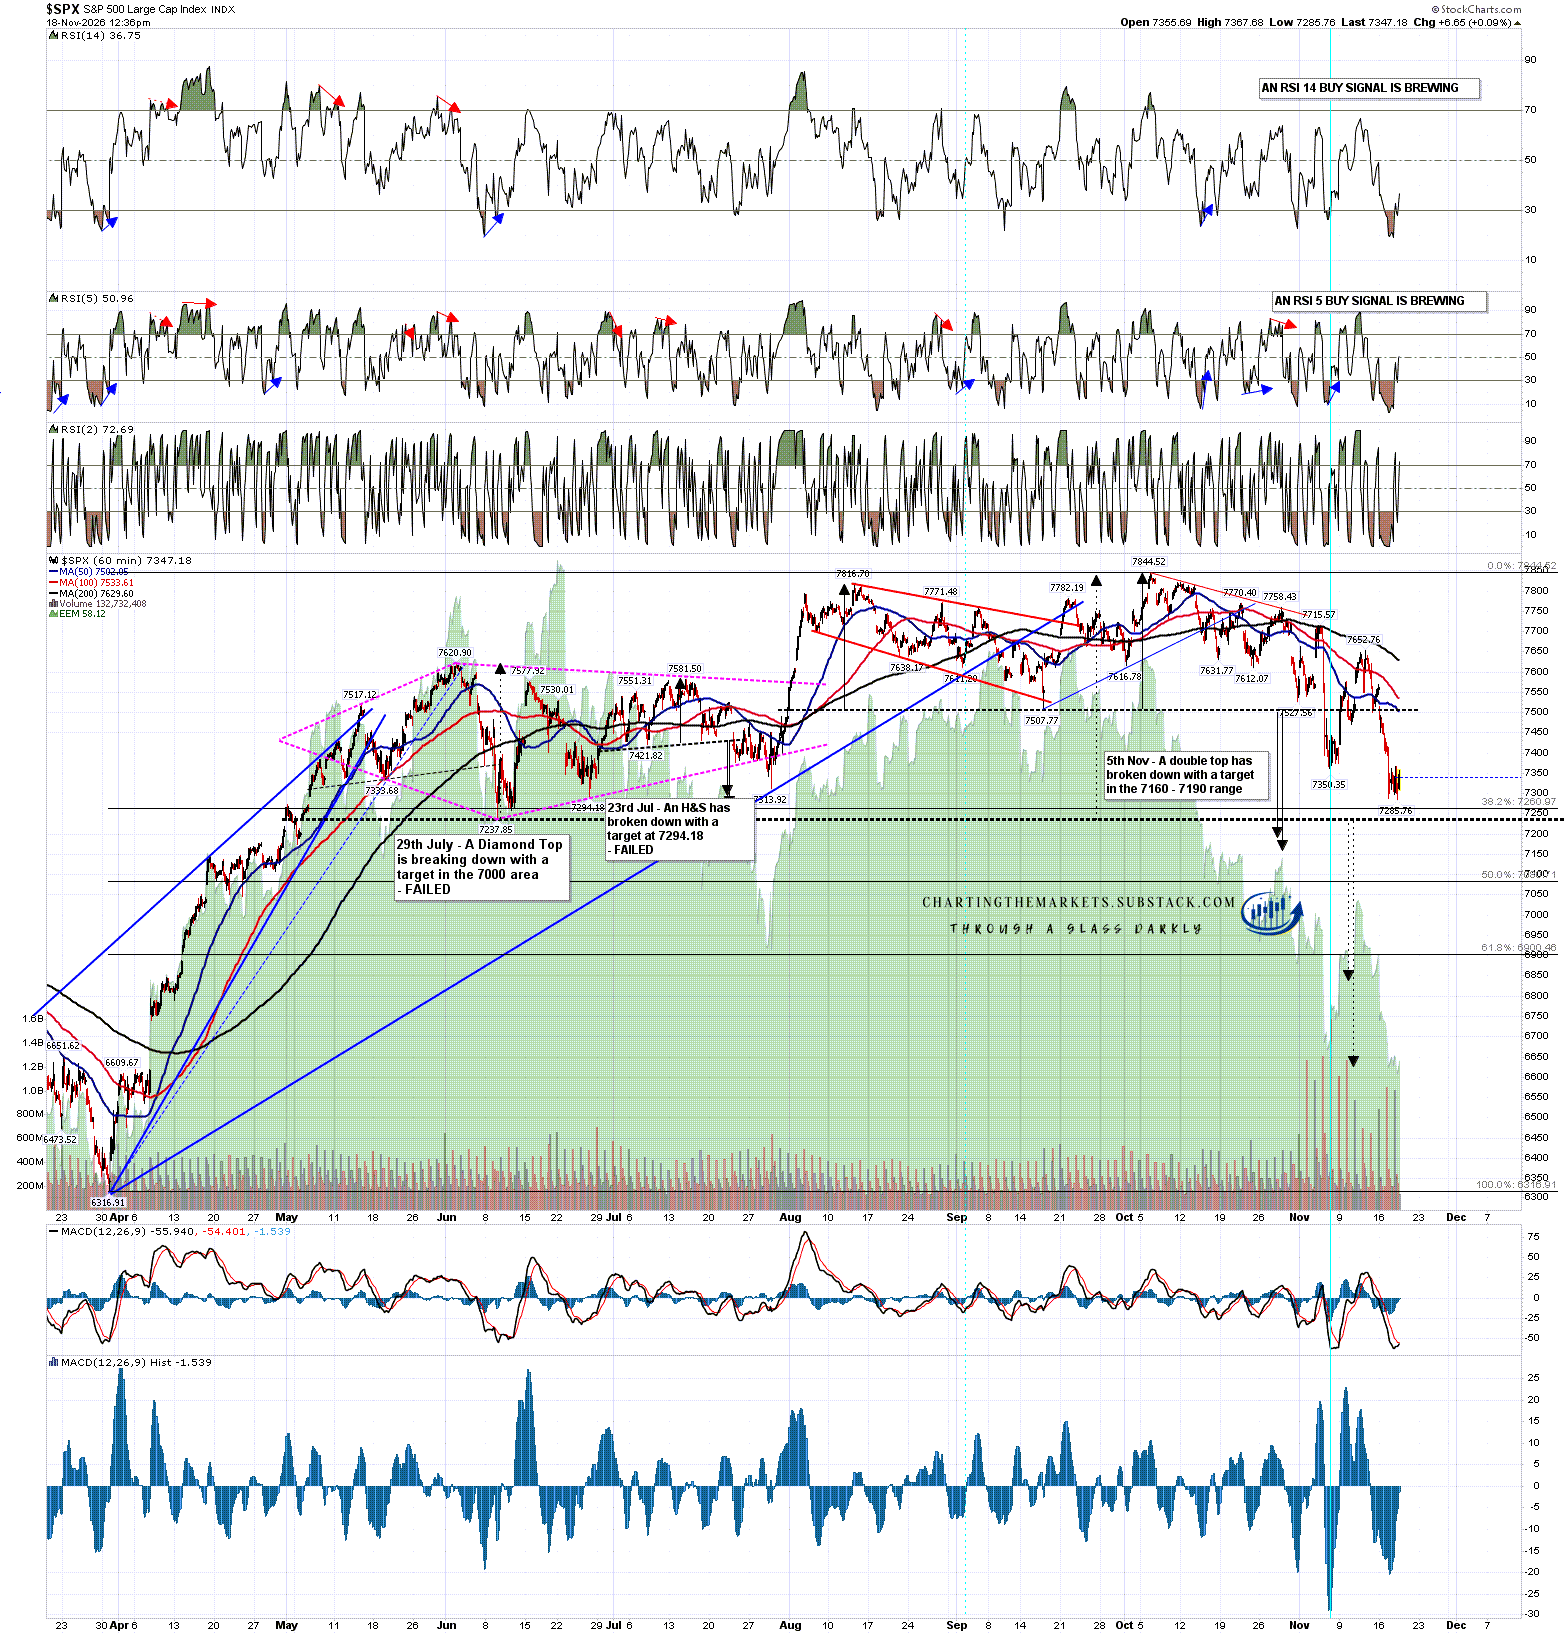
The topping pattern on SPX is the least ambitious and the closest to reaching target. That broke down on 5th November with a target in the 7160 to 7190 range and the low this morning was 7285.76.
It’s important to note though that this pattern is a degree smaller than the other patterns, and that the main topping pattern on SPX that would be on the same level as the others has not yet completed forming or broken down. The size degree of the ones that have already broken down on QQQ, DIA and IWM is the pattern that retraces most or all of the move up from the low in late March 2026.
That unfinished topping pattern on SPX is based around the June low at 7237.85, as there is a possible H&S pattern there. This could either resolve into an H&S pattern, in which case I’d be looking for a right shoulder bounce to start soon, and that could be starting now, or this could be an asymmetric double top, in which case on a sustained break below 7237.85 the double top target range would be in the 6625 to 6840 range.
In terms of bullish signs here there is no obvious short term bottoming pattern on SPX but there are hourly full RSI 14 and RSI 5 buy signals that have fixed as I’ve been writing this post. The lack of these on QQQ, DIA or IWM make these less significant however.
SPX 60min chart:
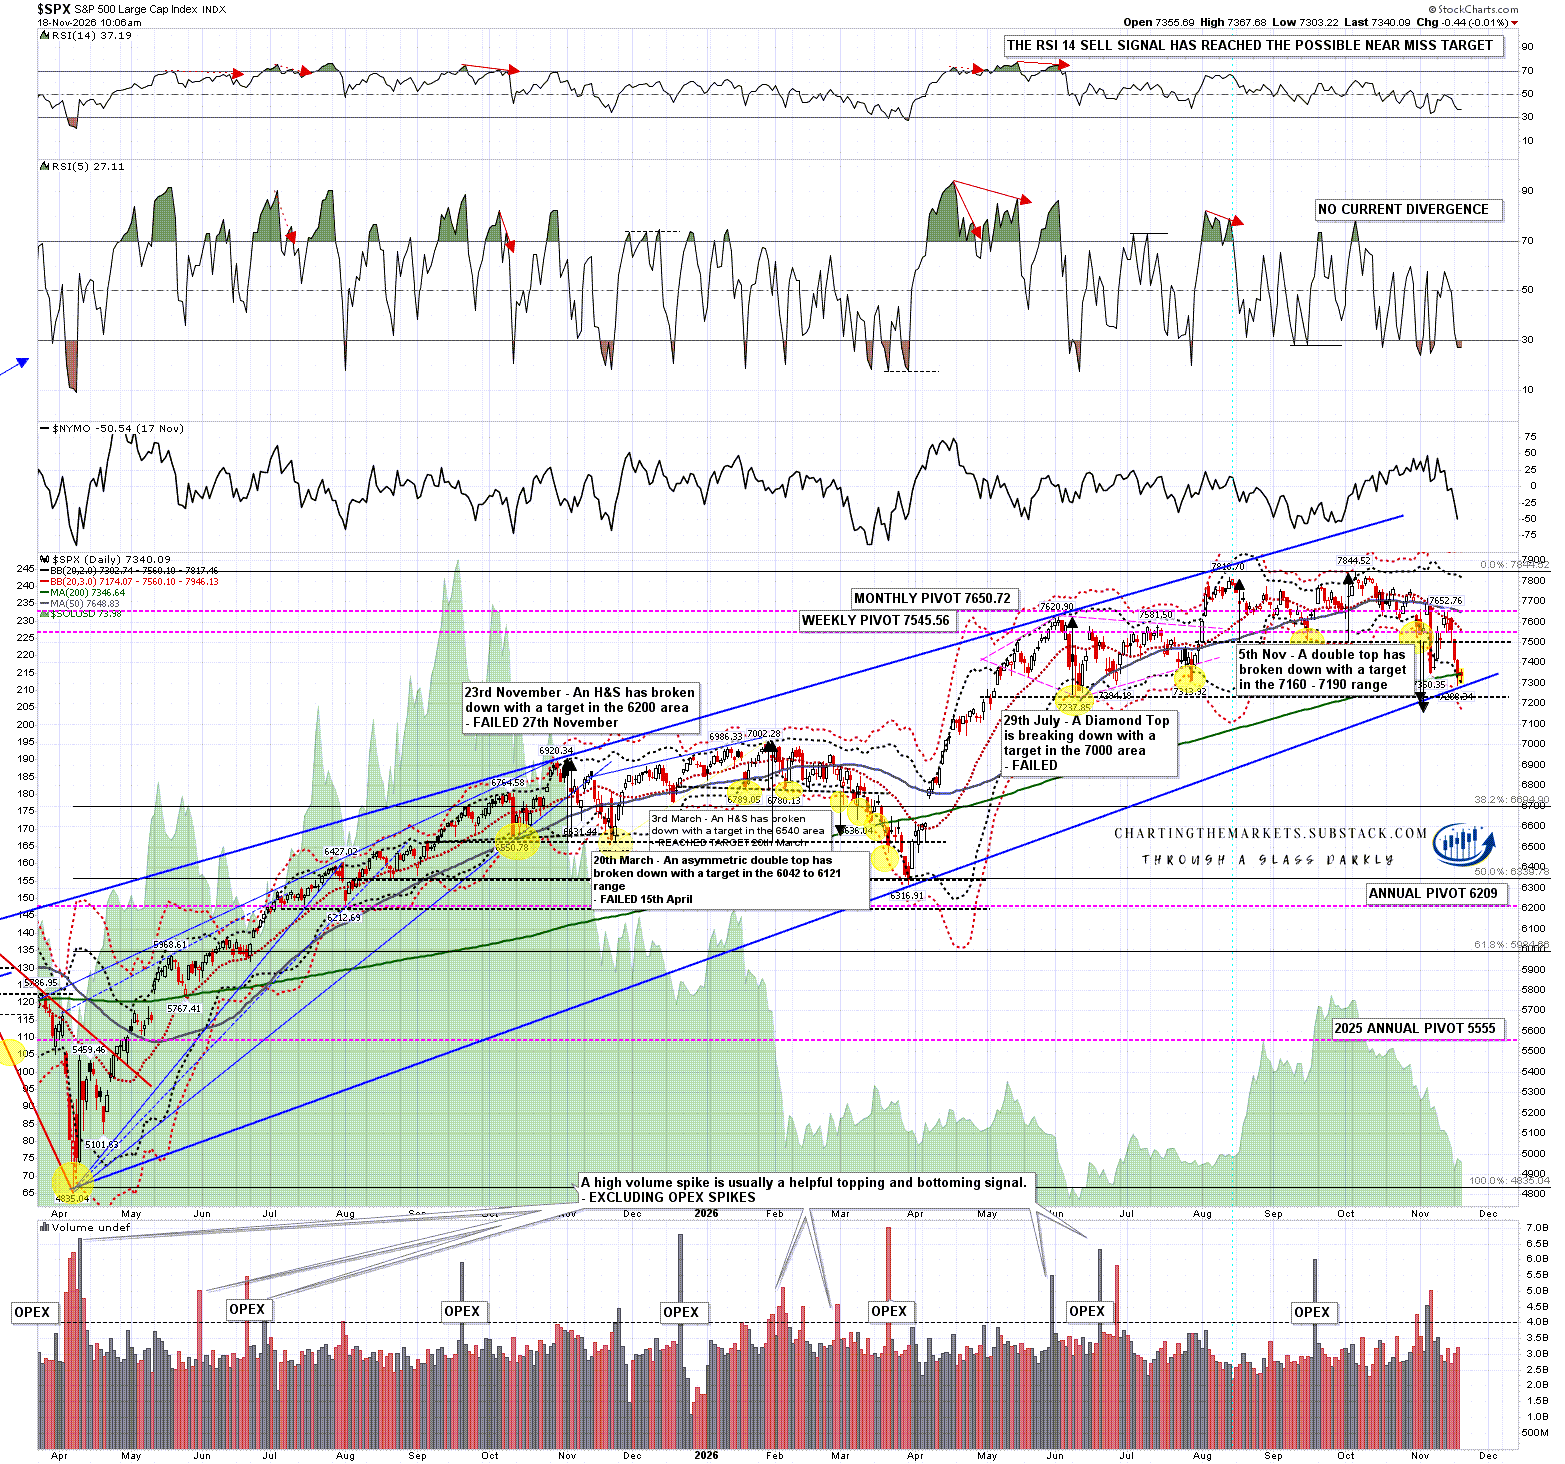
On the SPX daily chart I’d note that the three strong rallies since late October started at tests of the daily 3sd lower band. That was at 7174.07 this morning and will likely fall about 20 handles during today so the full SPX double top target should now be in range above the daily 3sd lower band by tomorrow.
I would also note that SPX is currently testing the rising wedge support trendline from the April 2025 low and this is the key support trendline that I am watching here. The corresponding support trendlines on QQQ, DIA and IWM have already broken down though in recent weeks, so I’m expecting this one to break down soon in any case.
SPX daily chart:
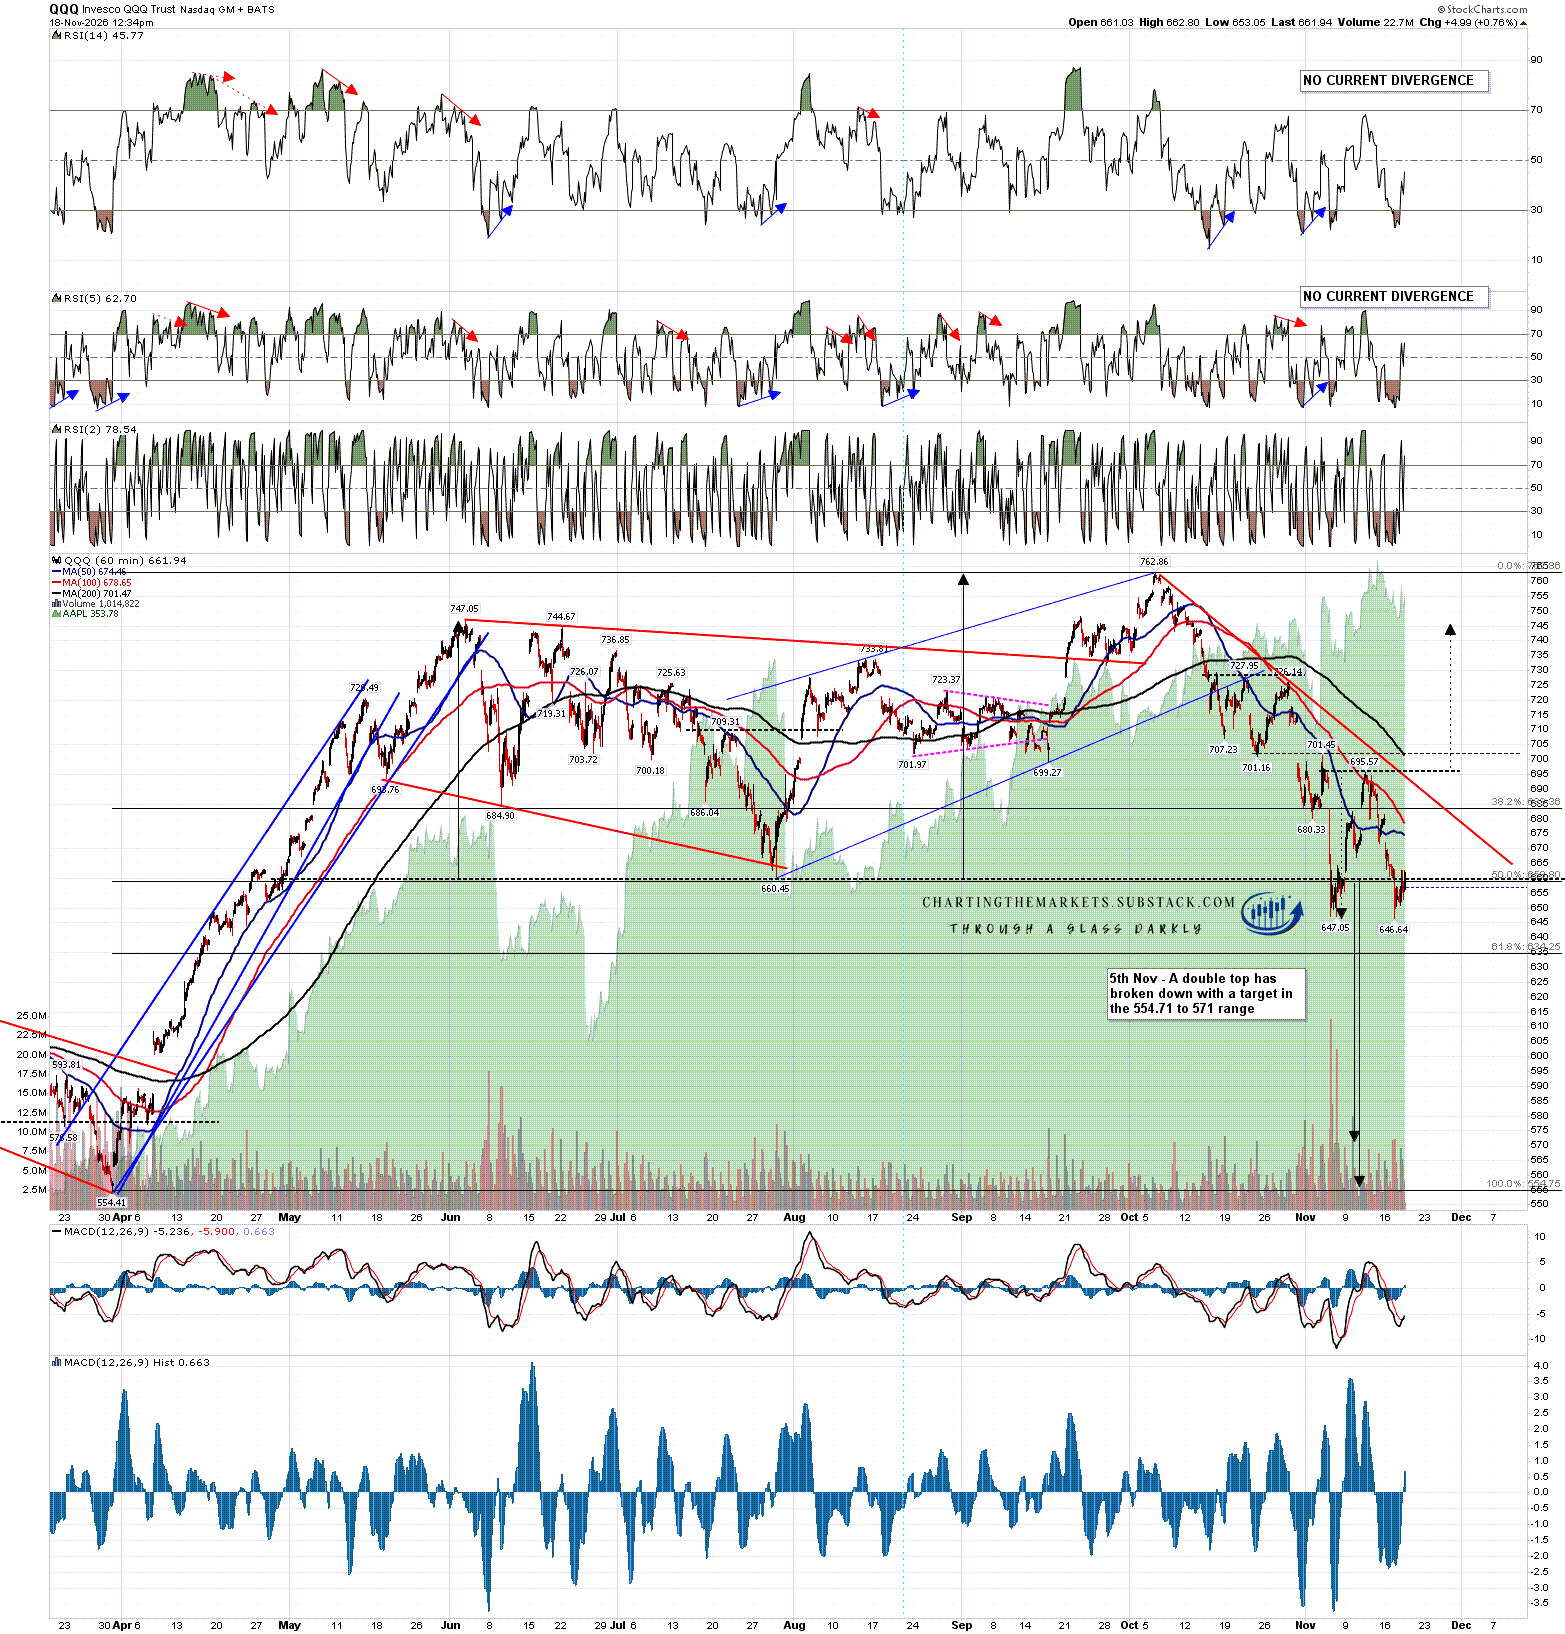
On QQQ the double top broke down on 5th November with a target in the 555 to 571 area and made a lower low under broken support yesterday, which leans bearish. Until QQQ continues significantly lower however, there is a possibility that this low retest made the second low of a small double bottom. If QQQ was to now make a sustained break above the last rally high and possible double bottom resistance at 685.57 then the double bottom target would be in the 746 area, most of the way back to the all time high at 762.86.
QQQ 60min chart:
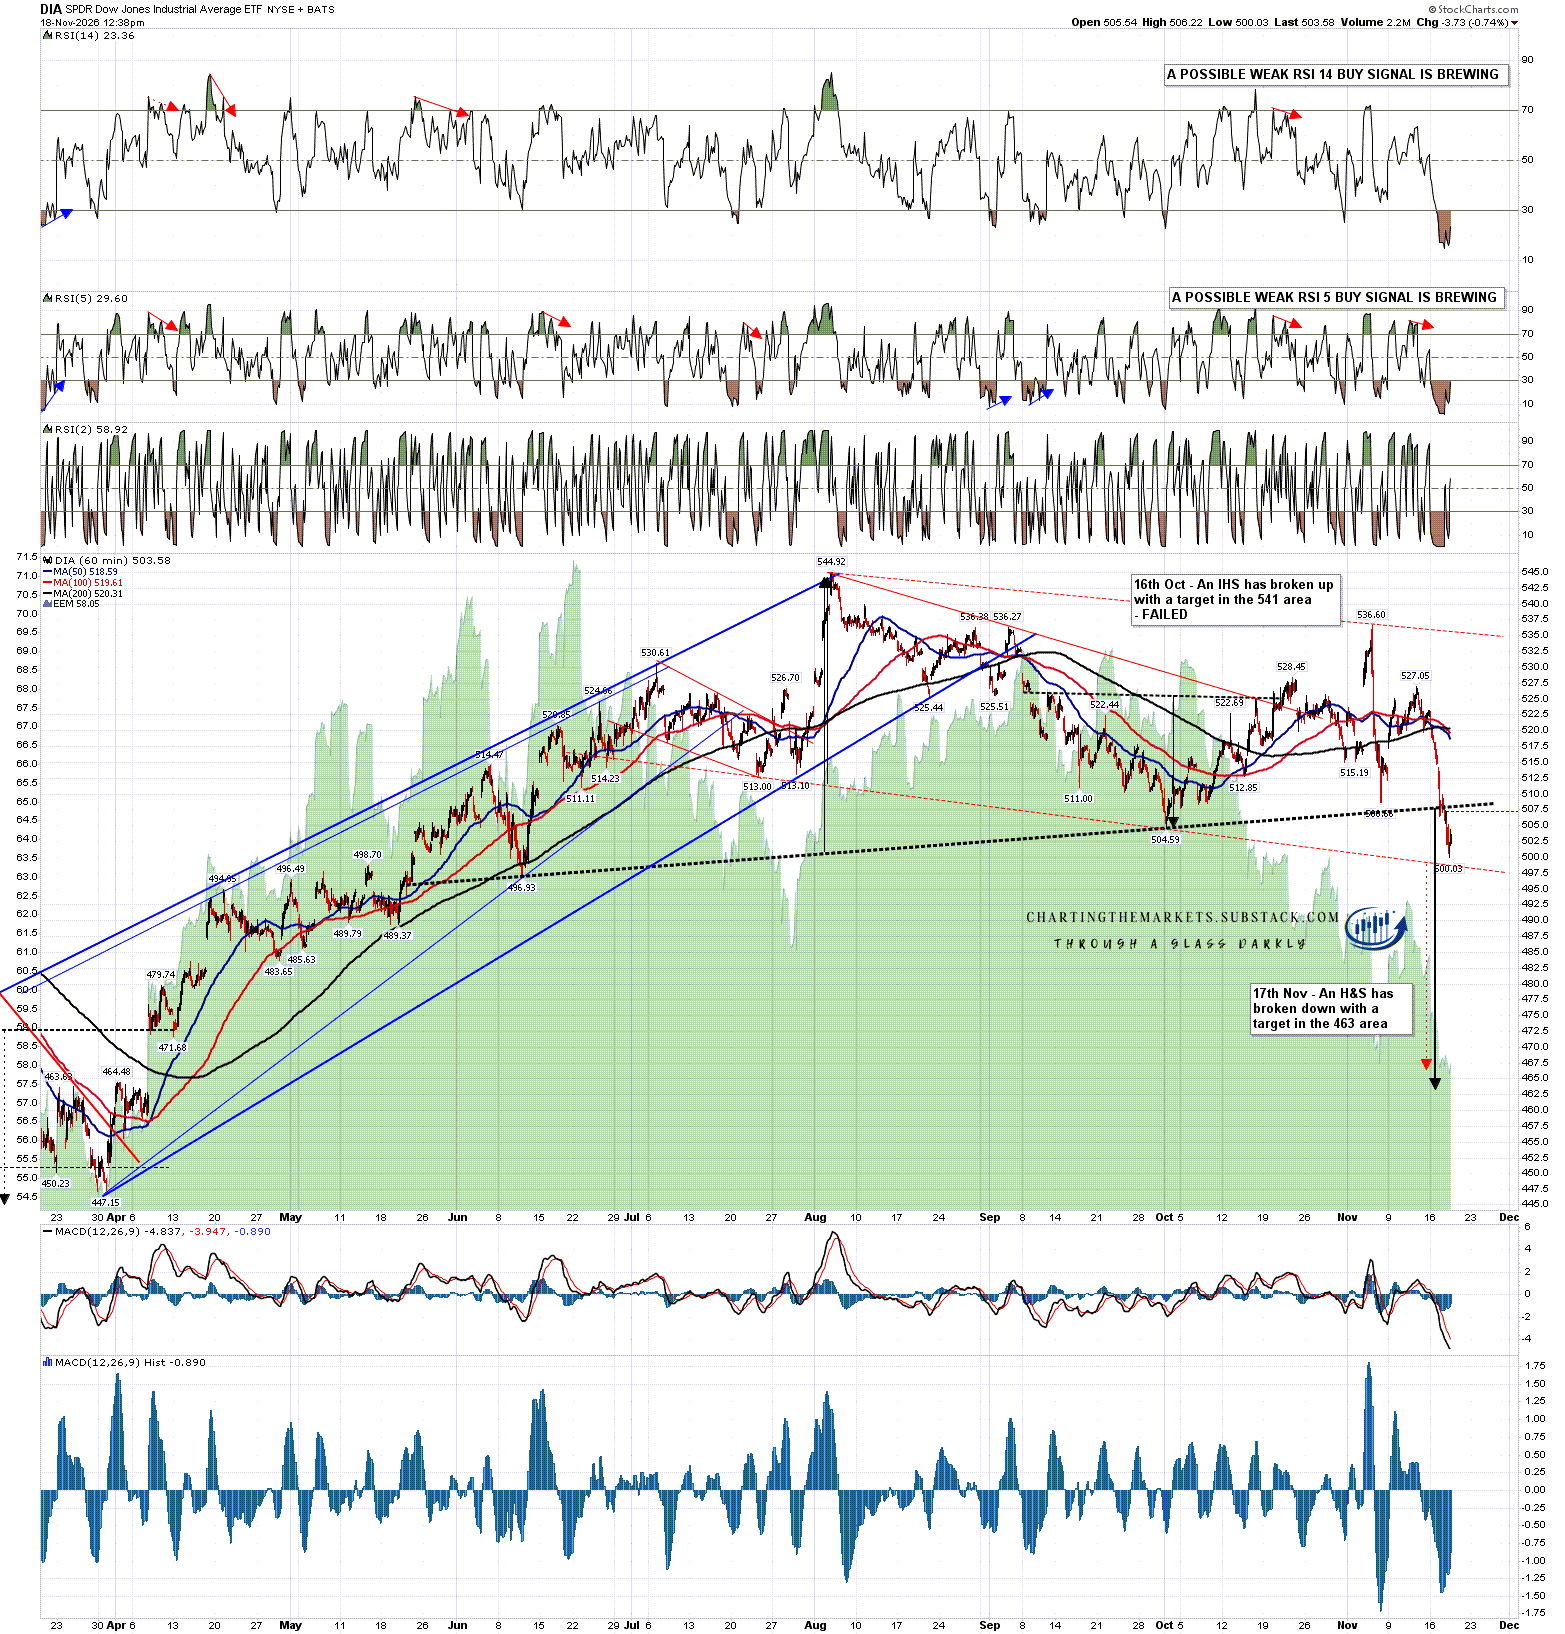
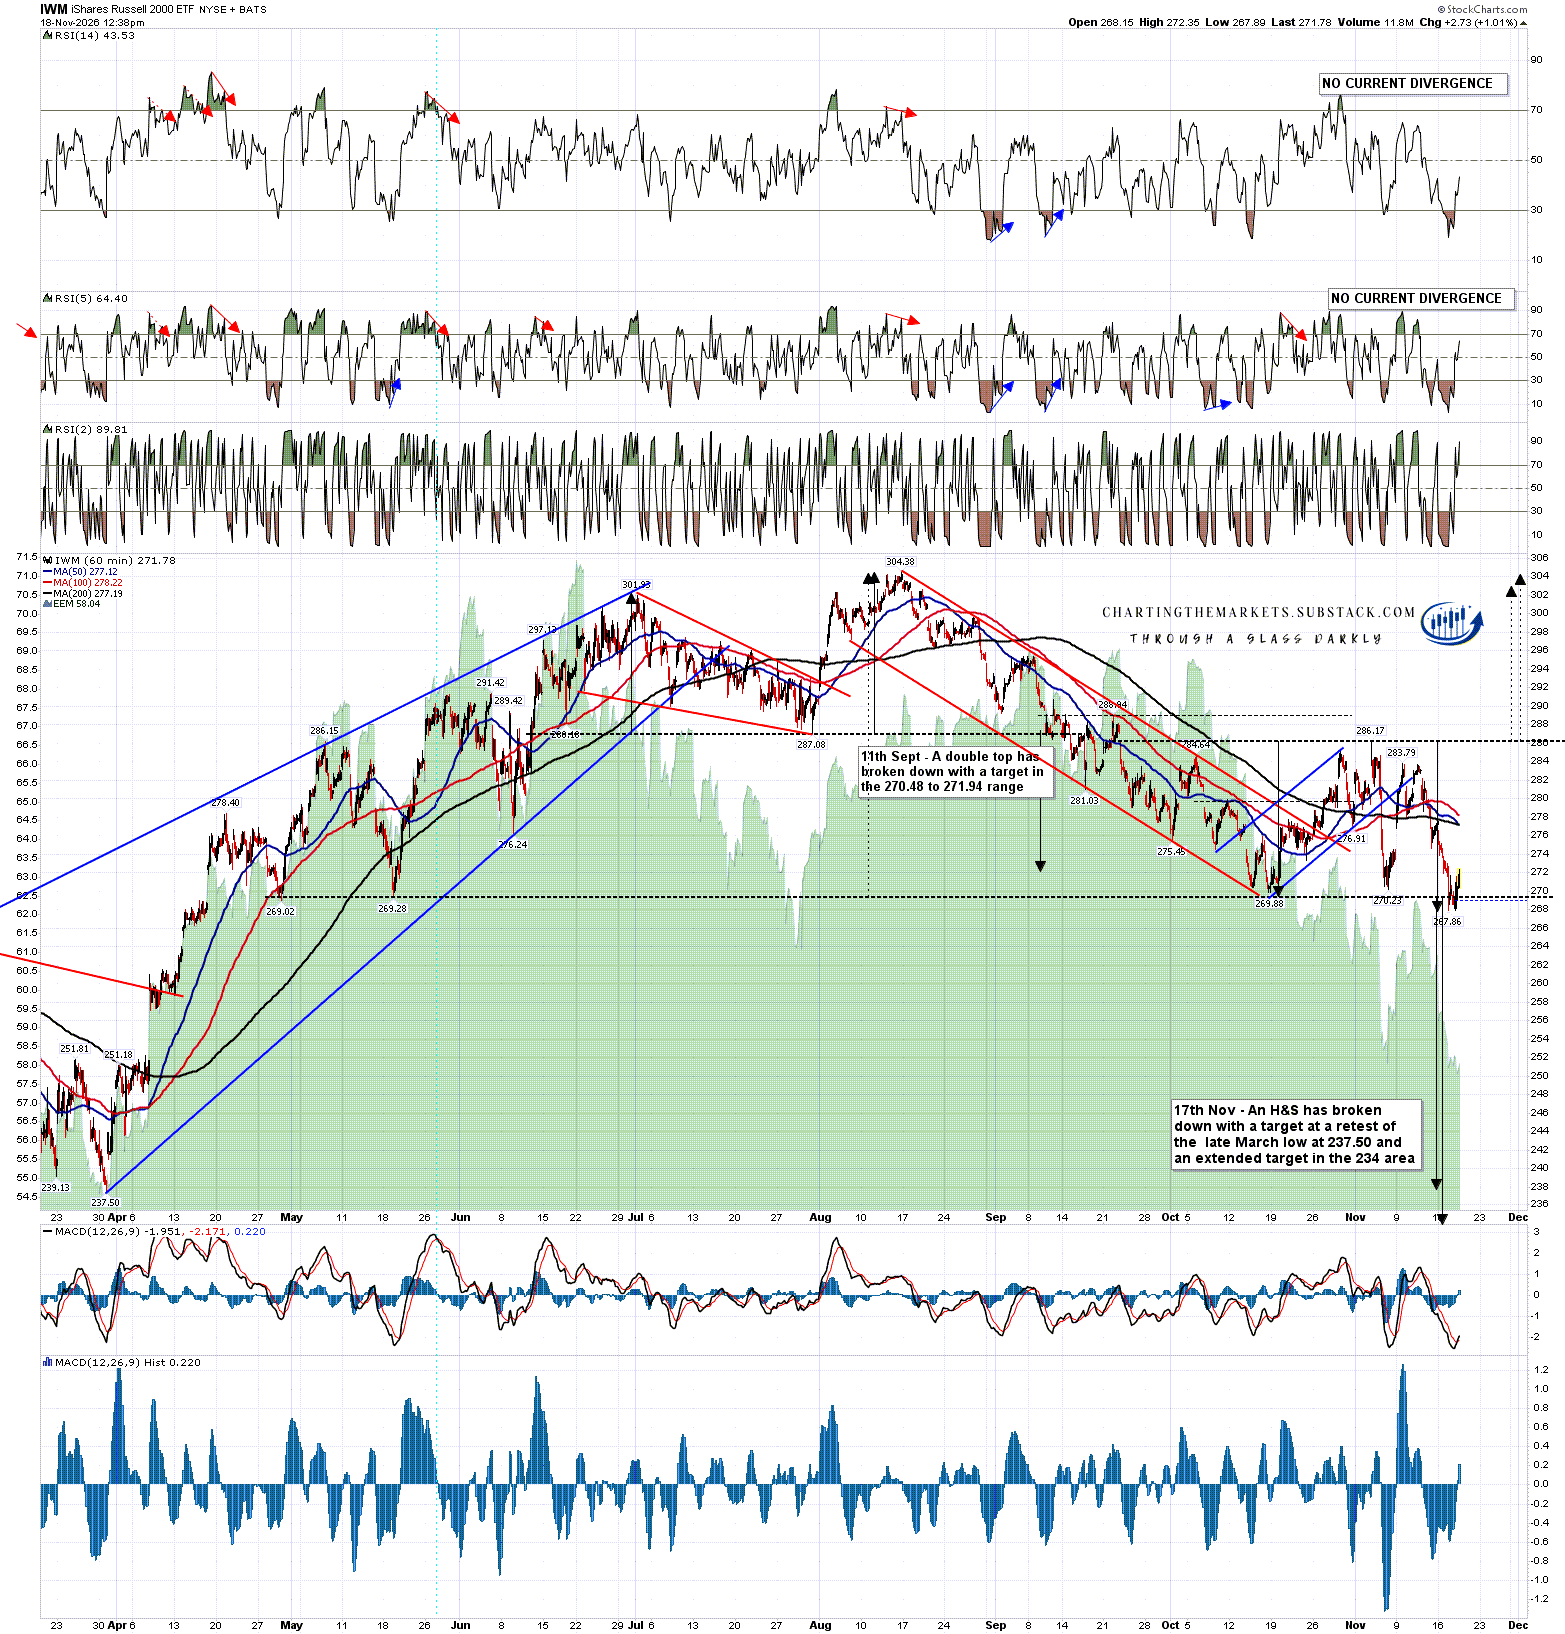
Big Head and Shoulder (H&S) patterns broke down on DIA and IWM yesterday. On DIA the decent quality H&S target is in the 463 area. There is some weak positive RSI divergence on the hourly chart but no current bottoming pattern:
DIA 60min chart:
On IWM the high quality H&S target is at a retest of the late March low at 237.50, with a possible extension target slightly lower in the 234 area. This is because when an H&S target is below the start of the trend move that it is reversing, the full reversal of that trend move is the main target. There is positive RSI divergence on the hourly chart, but as with QQQ, until IWM goes much lower there is a possible double bottom setup here that on a sustained break above the last rally high and possible double bottom resistance at 286.17 would have a target in the 303-4 area, most of the way back to the all time high at 304.38.
IWM 60min chart:
So what’s the bottom line here? Well the bear setup here looks great, there are major topping patterns across the board that have, apart from SPX, already broken down.
I was saying in my post on Monday that there would be a bullish case here, but it wouldn’t be as strong as it was then, and that’s still the case. Positive divergence is thin, we have decent bottoming patterns only forming on QQQ and IWM. Just on the pattern and divergence setup the advantage is to the bear side. The Anthropic IPO tomorrow may also be a trigger for a wave of selling. We’ve seen that happen in previous speculative bubbles.
There are concerns with that. This remains a strange period to see big declines in the weeks before Xmas, as it would be much more usual to see that in January. Opex is on Friday which tends to be calm, though on occasion there have been big declines at Opex, and there has been talk of a possible 0.5% increase in the Fed Funds rate at this meeting to combat rising inflation.
We also have two of the most bullish leaning weeks of the year coming up, the first of which is next week as the week of Thanksgiving, with Thursday closed and the other four days all leaning significantly bullish. The other similar week is still a few weeks away and is the week ending December 25th.
What I know though is that when the trend is strong enough, it will go through everything in the way, buy and sell signals, seasonality, news and support levels. This is the point where we see how strong this trend really is.
It’s a busy day, and I’ll be publishing a post on Anthropic’s doubtful future prospects this afternoon on my The Bigger Picture substack.
I’m doing a three part series on the (likely) AI bubble and published the first instalment late last week on my The Bigger Picture substack. If you missed it you can see that here. The second instalment in the AI bubble three part series should be posted on Friday.
If you like my analysis and would like to see more, please take a free subscription at my chartingthemarkets substack, where I publish these posts first. I also do a premarket video every day on equity indices, bonds, currencies, energies, precious commodities and other commodities at 8.45am EST, but only for paying subscribers. Other places to find me are my page on the platform previously known as twitter, and my YouTube channel.


No comments:
Post a Comment