- WE'RE JUST RANDOM SPECKS OF DUST IN A TORNADO TO THE MARKETS .......
- CHARTISTS MUST PUT ALL BIAS ASIDE AND LET THE CHARTS DO THE TALKING OR WE'LL SEE ONLY WHAT WE WANT TO SEE
- This blog has a copy of all header posts that I publish anywhere, so that those interested in seeing what my thoughts are on the markets can find them easily.
- I will be answering questions and responding to comments, so feel free to respond to any posts and I will see your comment even if it is not on the most recent post.
- If you're interested in seeing any intraday charts I post, I do that on twitter, and my twitter handle is @shjackcharts.
- The charts in the posts are as large as I can practically make them. if you would like to look at one more closely, click on it, and the link will take you to a larger version at screencast. If you click on that again, you will get a full page version, and can use the resizing function on your browser to enlarge parts of interest further.

Thursday, 26 June 2025

The Bigger Picture on ... the US Dollar

This is my first public post on the US Dollar possibly since 2012, so it will be lengthier than normal as it will also act as a reference post that I can refer back to every time I do an update on USD here in the future.

I’ve always really enjoyed doing the long term charts on the US Dollar. Longer term patterns can take decades to form, with the falling wedge that broke up in 2014 breaking a wedge resistance trendline coming from a high in 1985.

Even the shorter term patterns within these larger patterns can take many years to form. On the monthly chart below I was noting in April 2012 that the rising megaphone that formed in the 90’s took six years to form, and the current rising megaphone on USD has been forming since the big low in 2008, which was the lowest low going back as far as my data extends to the dying days of the gold standard in 1970.

What’s my point? Mainly that the larger trends on the US Dollar aren’t generally about short or even medium term news or policy, and on these timescales even individual presidential terms aren’t generally much more than a blip. I’ll be looking at the likely larger trend today, and the shorter term setup that will likely play out over the next few years, and the significant very short term inflection point that is being tested at the moment.

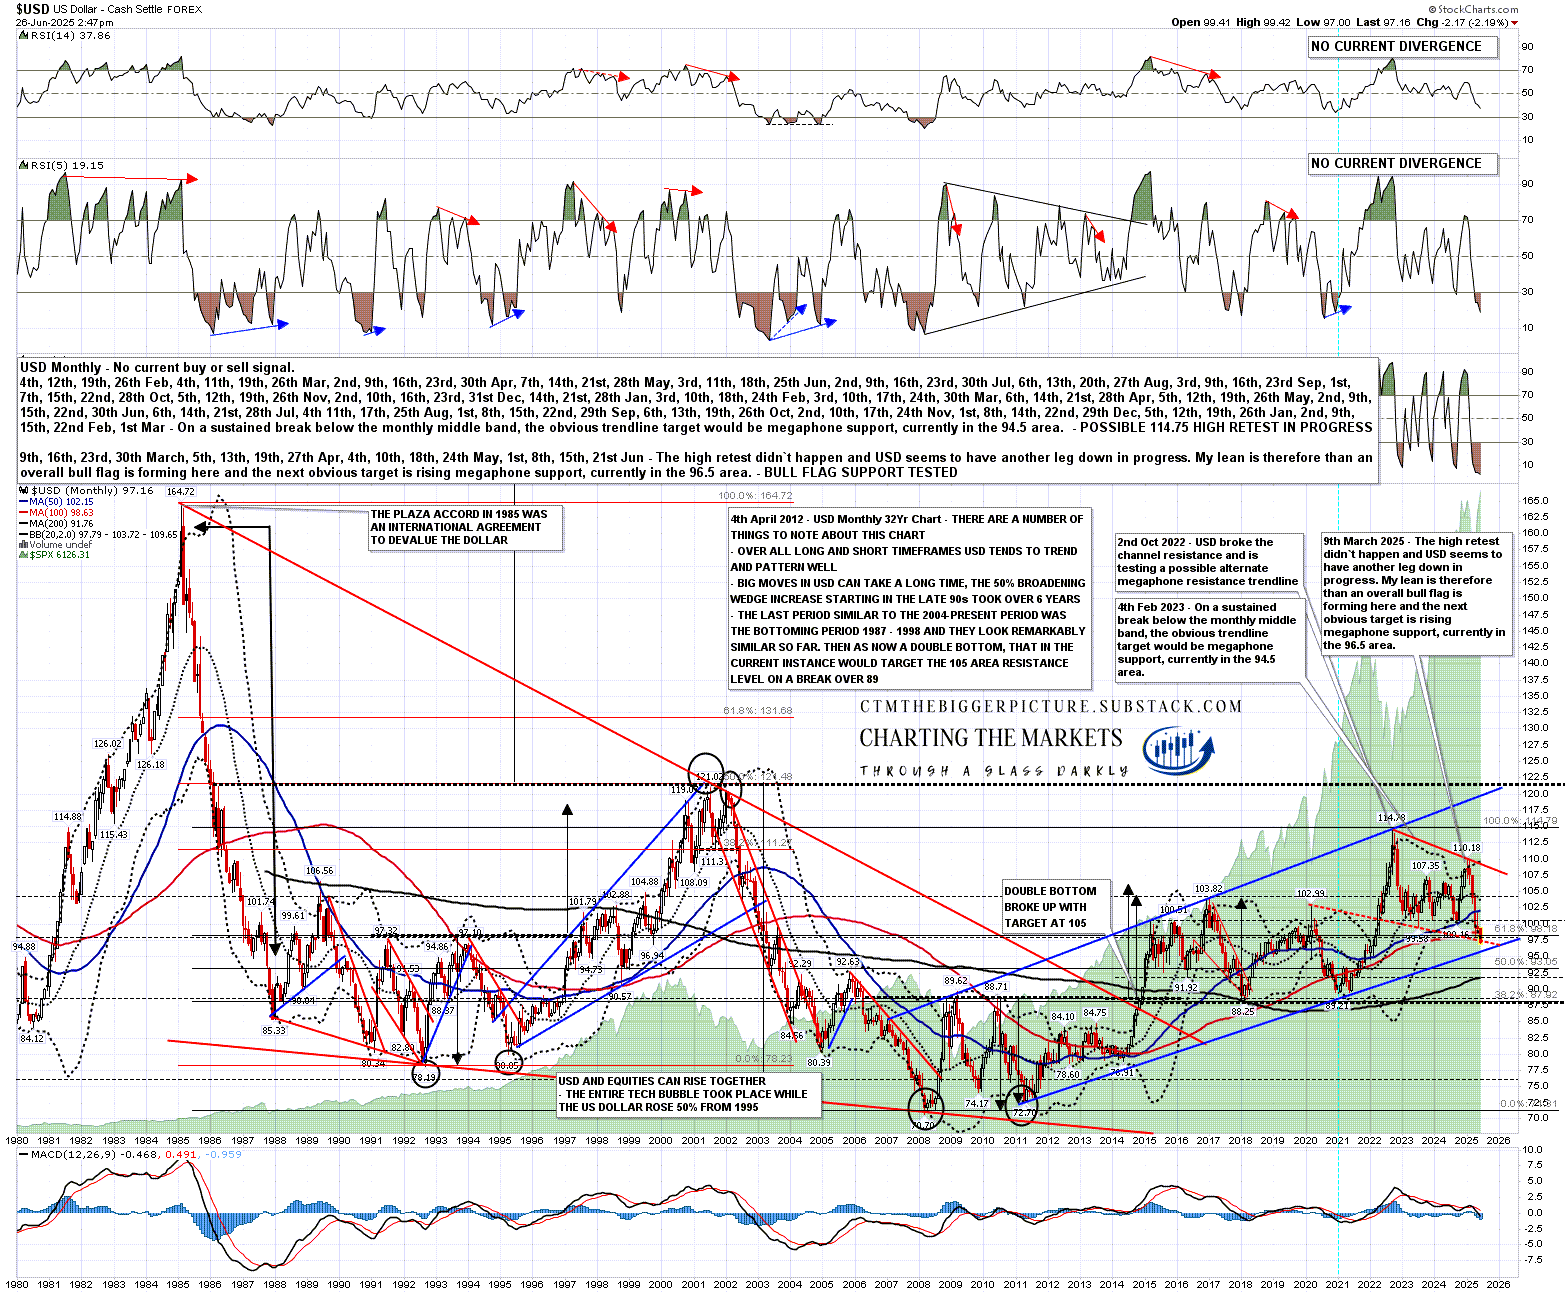
On the really big picture on the monthly chart below, the falling wedge starting in 1985 broke up in 2014, and then retraced slightly under 50% of that wedge decline into a high at 114.78 in 2022.

Was I thinking that USD might go higher? For sure, and I would note that I was particularly watching for a retest of the 2001 high at 121.02 as that was resistance on a possible double bottom that, on a sustained break over it, would have triggered a possible target at a retest of the 1985 high at 164.72. Given that the 1985 high was such an extreme outlier historically though, I was thinking that was a lower probability option.

As it happened the rally from the 2008 low started off as a likely rising channel which looked like a possible bear flag, and at the 2022 high at 114.78 USD broke rising channel resistance to establish an alternate rising megaphone resistance trendline that turned this pattern into a likely bear flag that, in due course, would likely break down towards a retest of the 2008 low at 70.70. I’ve put my contemporaneous comments on the chart below but at this point I started looking for a test of megaphone support, then at 94.5 and now in the 96.5 area.

Over the next two years USD traded above and below the monthly middle band and I was wondering about a possible retest of the high at 114.75 until the hard fail from the early 2025 high, after which I was looking once again at the test of rising megaphone support. I drew in a possible ideal shorter term bull flag falling wedge support trendline and was wondering whether both trendlines might be tested at the same level at the end of 2025.

USD monthly chart from 1980:

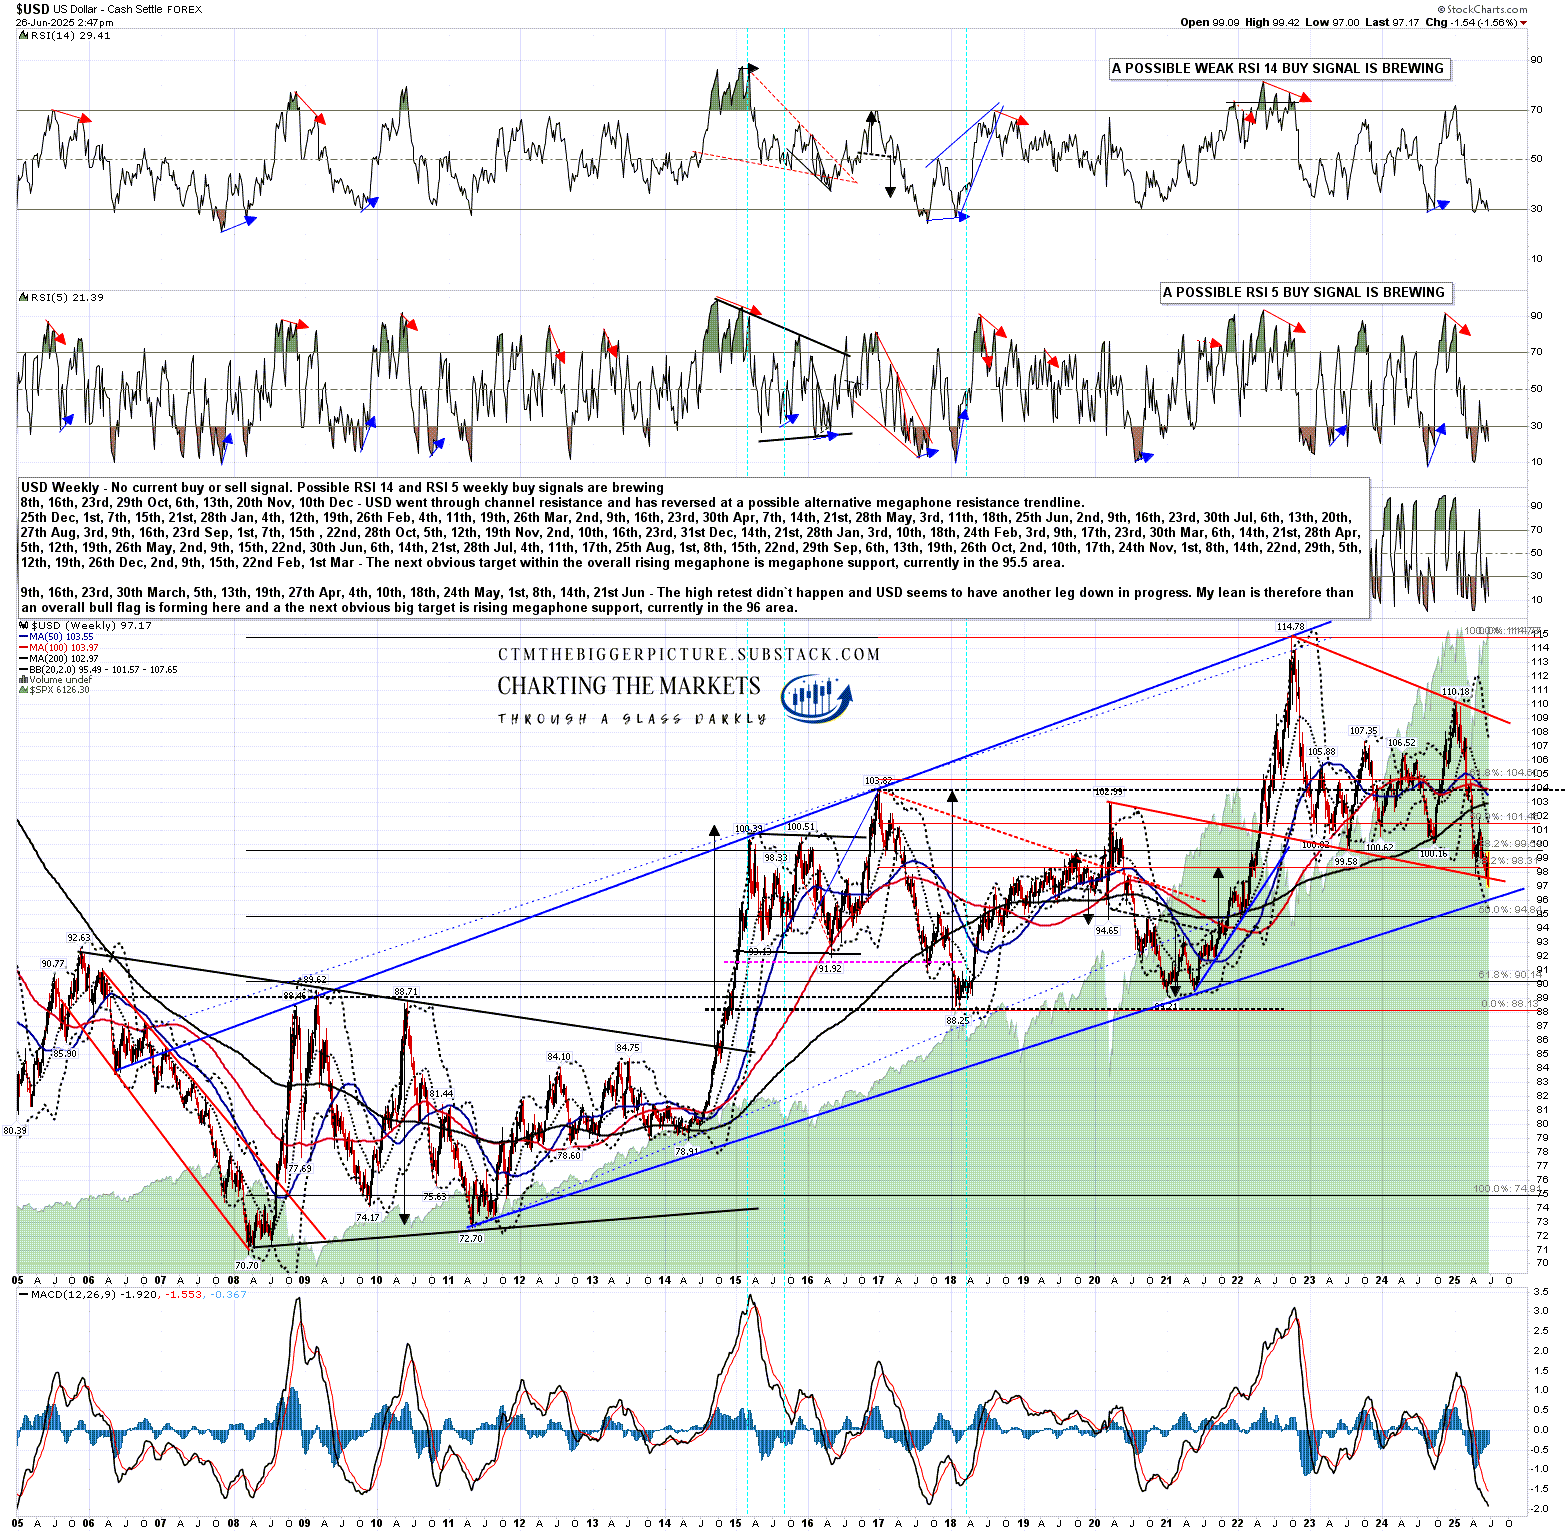
Not shown on the weekly chart below an H&S formed and broke down early March with a target with a target in the 102 area and, likely helped along by the tariff chaos, my ideal bull flag support was then perfectly tested at 97.92 in mid-April.

Now when a rising megaphone/wedge/channel tops out, a topping pattern will generally form, and the shorter term bull flag forming here would of course break up about 70% of the time with a target at a retest of the 2022 high at 114.78. That would likely then be the second high of a double top or break a little higher as a larger H&S formed.

There is another option for a topping pattern here though which is that the bull flag breaks down, as they do about 30% of the time, and on a sustained break down the bull flag itself then becomes the topping pattern, which in this case would have a target in about the 80 area.

Since flag support was tested I have been watching for signs that USD will reverse back up here, as my lean will always be that a bull flag will likely break up. USD rallied to 101.98 then retested the low ago early this month. This has set possible weekly RSI 14 and RSI 5 buy signals brewing that on a decent further move up would fix and support at least a substantial USD rally. The track record for these signals for the last twenty years on USD has been very good.

This low retest has also set up a possible double bottom, that on a sustained break back over 101.98 would look for a target in the 106-7 range and if that target was to be hit then the weekly buy signals should then have both fixed, and I’d be looking for a test of the bull flag resistance trendline, currently in the 109 area.

USD weekly chart:

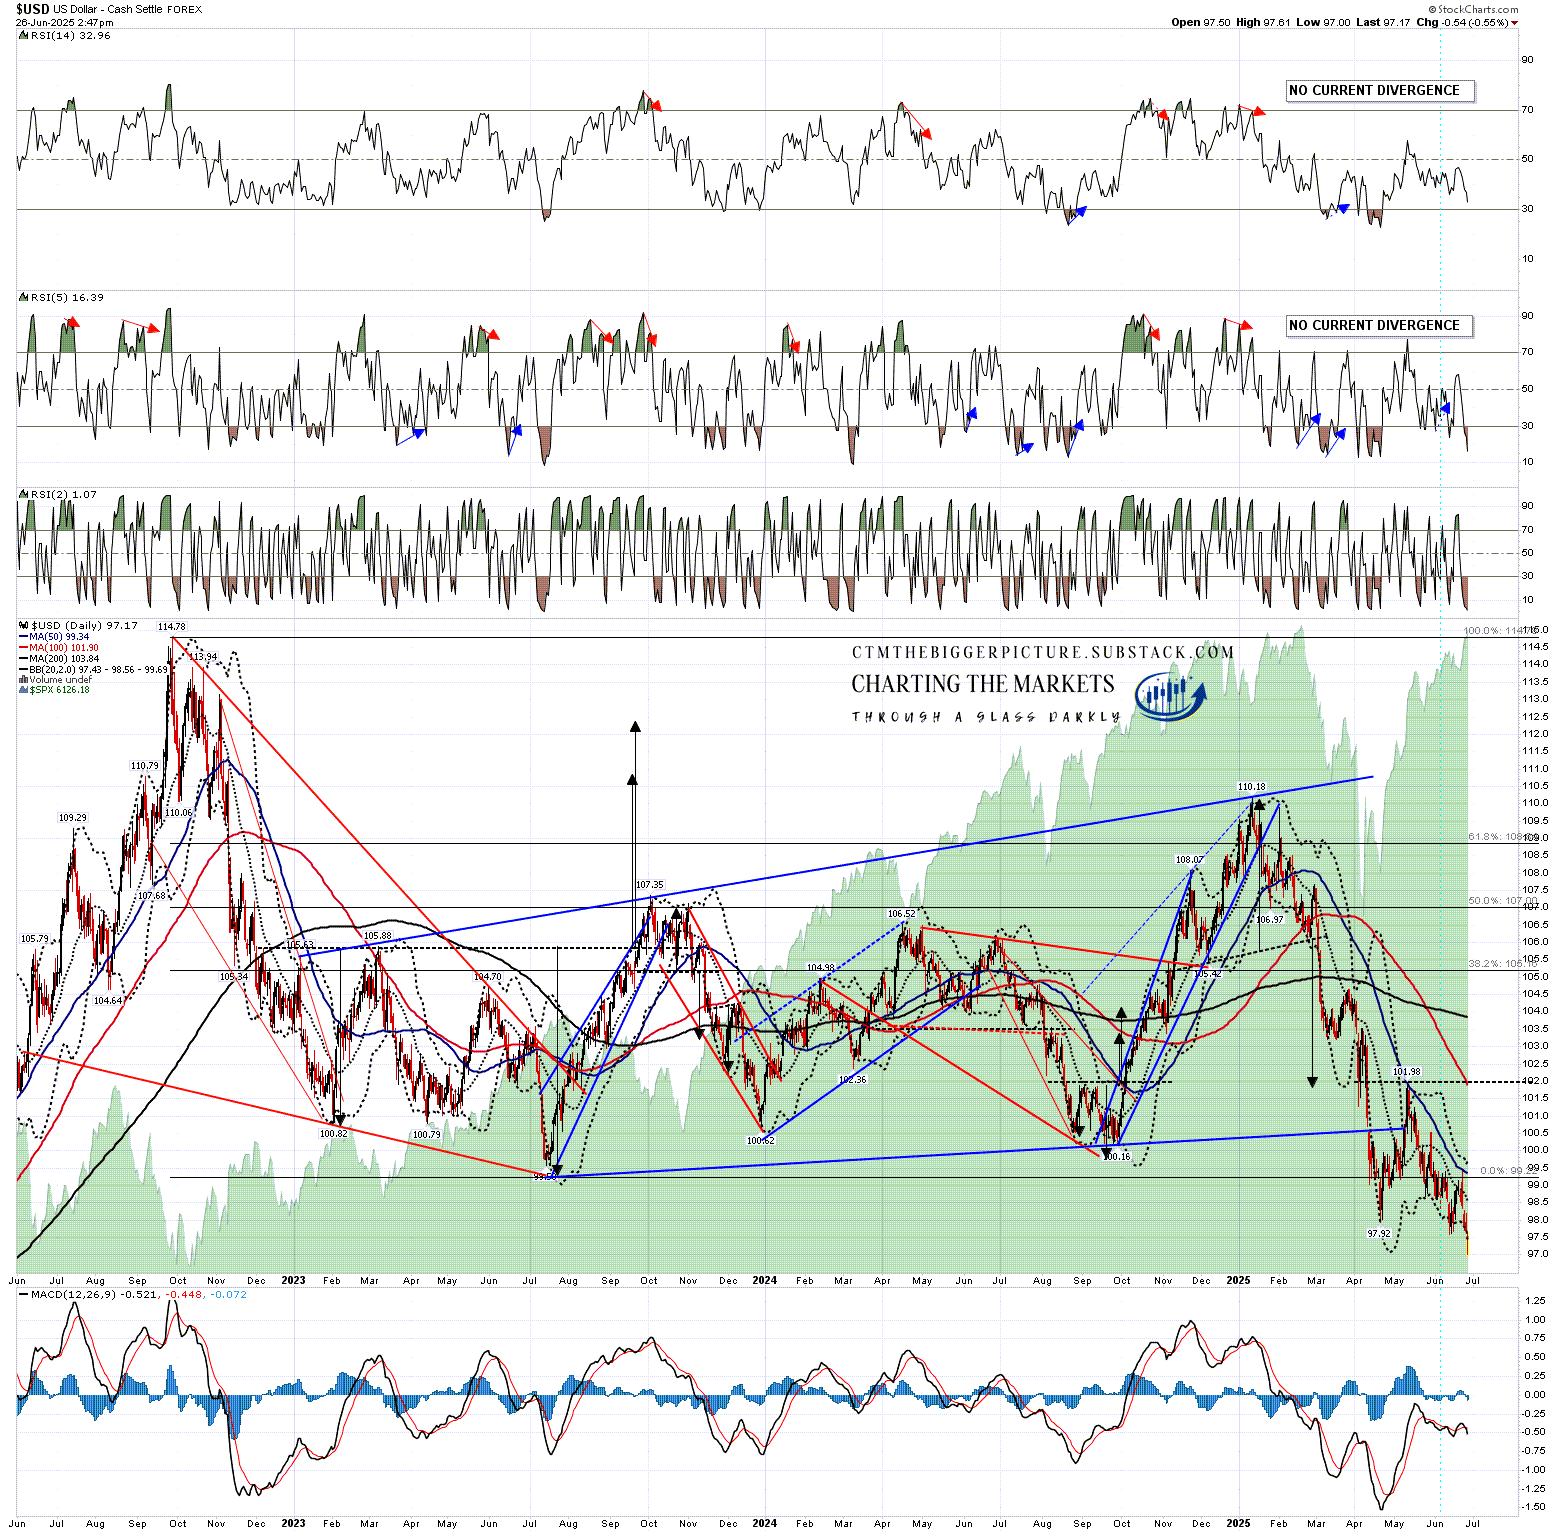
On the daily chart you can see that a high quality rising megaphone had been forming from the low in 2023 and this was always likely to break down in due course into lower lows so, while the Trump administration may have accelerated that sequence somewhat, it didn’t create it.

You can also see a smaller double bottom that may be forming at that on a sustained break over 99.42 would currently look for a target in the 101.2 to 101.8 area.

No current daily positive divergence, and in the last day USD has broken below bull flag support, so we are in the inflection point here and the next direction should be established soon. My lean would be higher, as this is an inherently bullish leaning setup, but it may break instead into continuation down. I think the odds of a break down are higher than normal in this instance due to US policies, but not enough for me to shift my overall lean towards a break down. Either way I’ll be looking for the next target areas either in the 115 area for the upside or 80 on the downside.

USD daily chart:

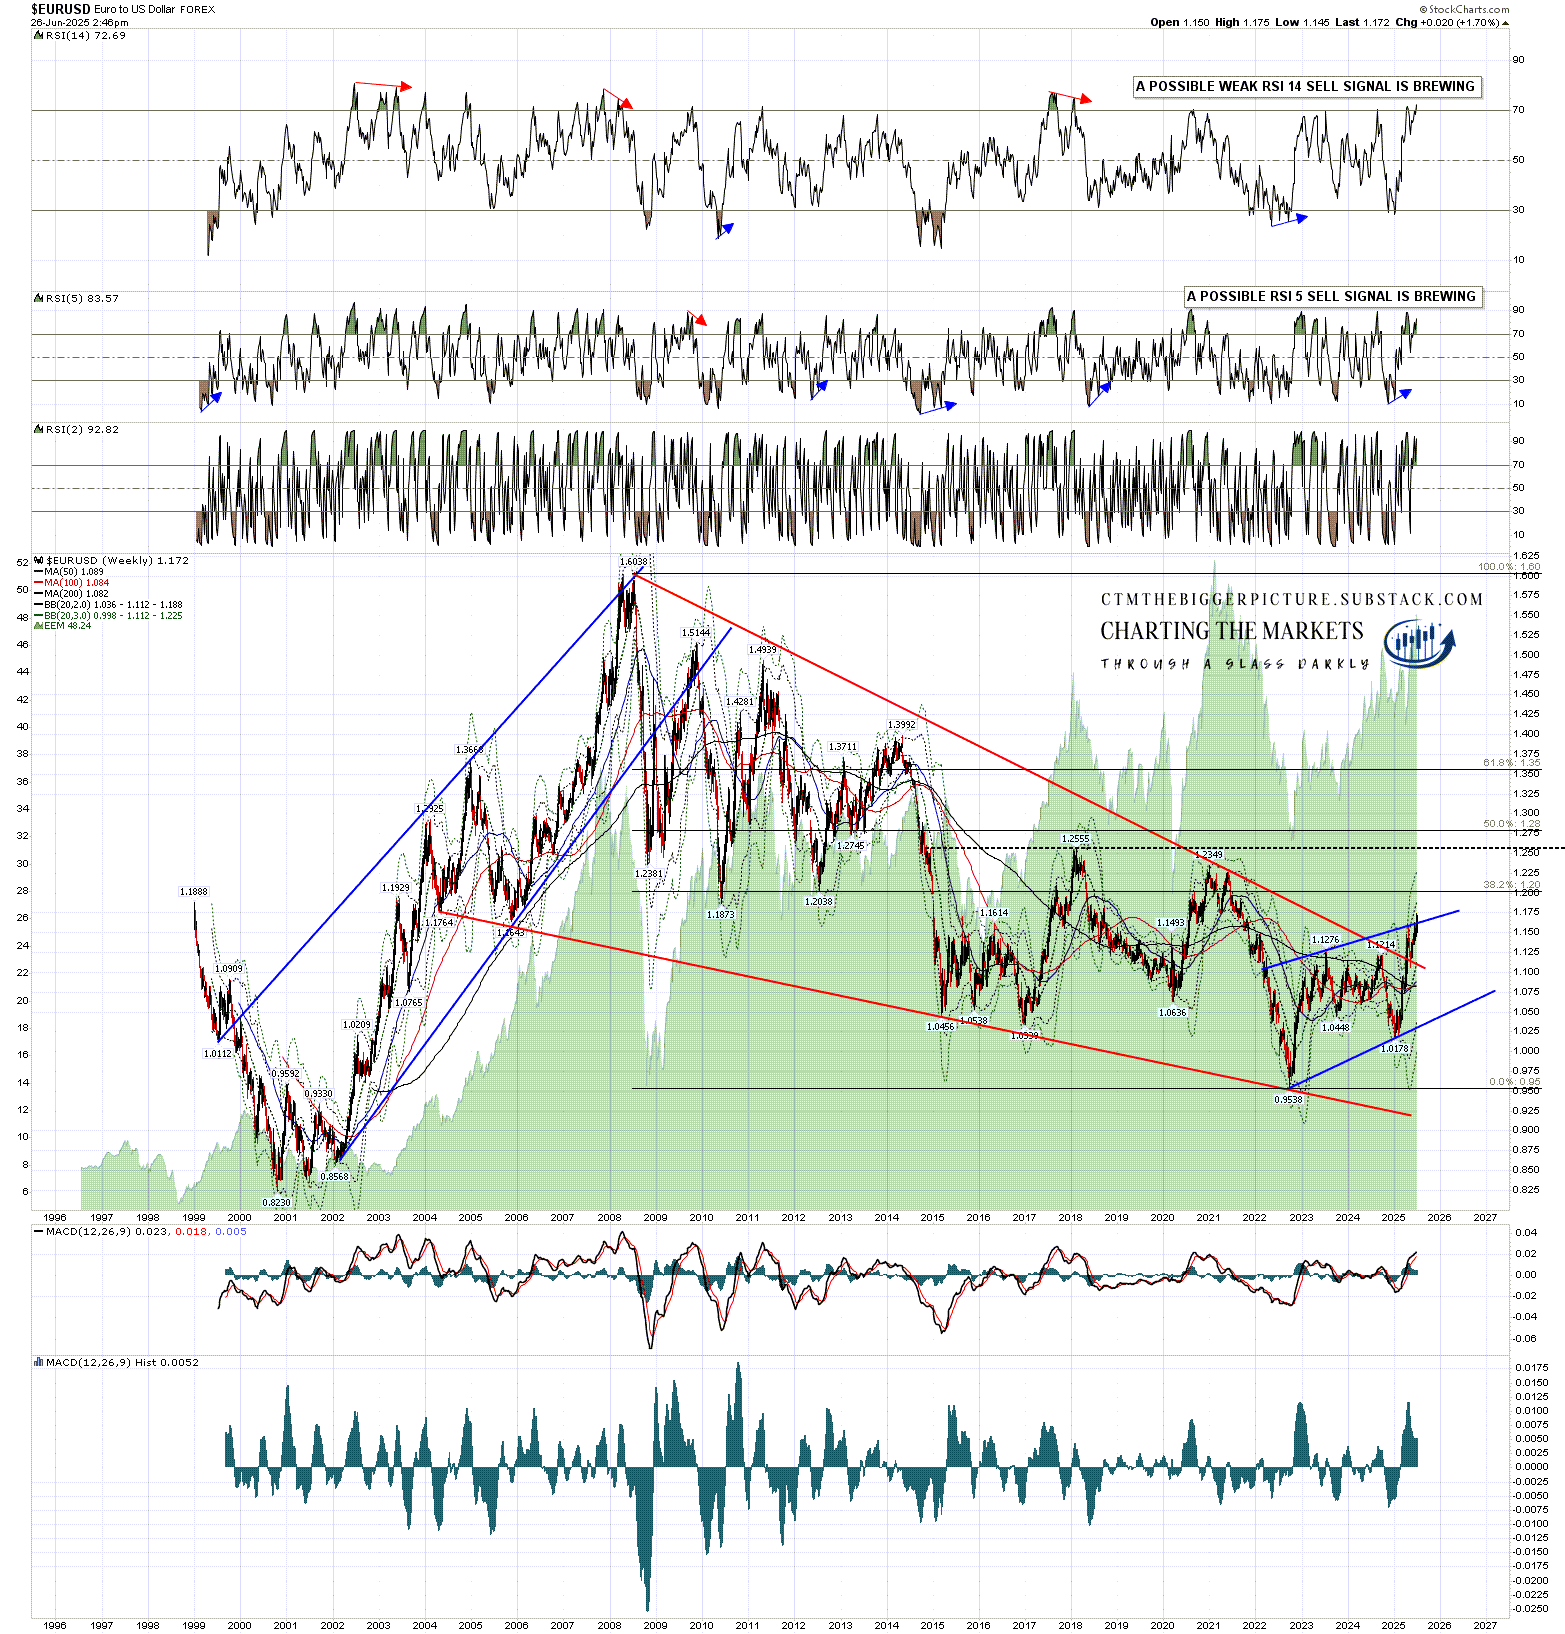
How well supported is this setup and inflection point on other currency pairs? Very well supported. The Euro is 57.6% of the US Dollar currency index and on the weekly chart below you can see the overall bullish setup (inverse to USD of course) with a falling wedge that has broken up and the bear flag wedge that has formed since the 2022 low.

The larger pattern is a falling wedge rather than the rising megaphone on USD, but otherwise this looks almost identical with EURUSD now breaking up over bear flag resistance in what is likely a bearish overthrow (~70% odds) or the start of a break up (~30% odds).

EURUSD weekly chart:

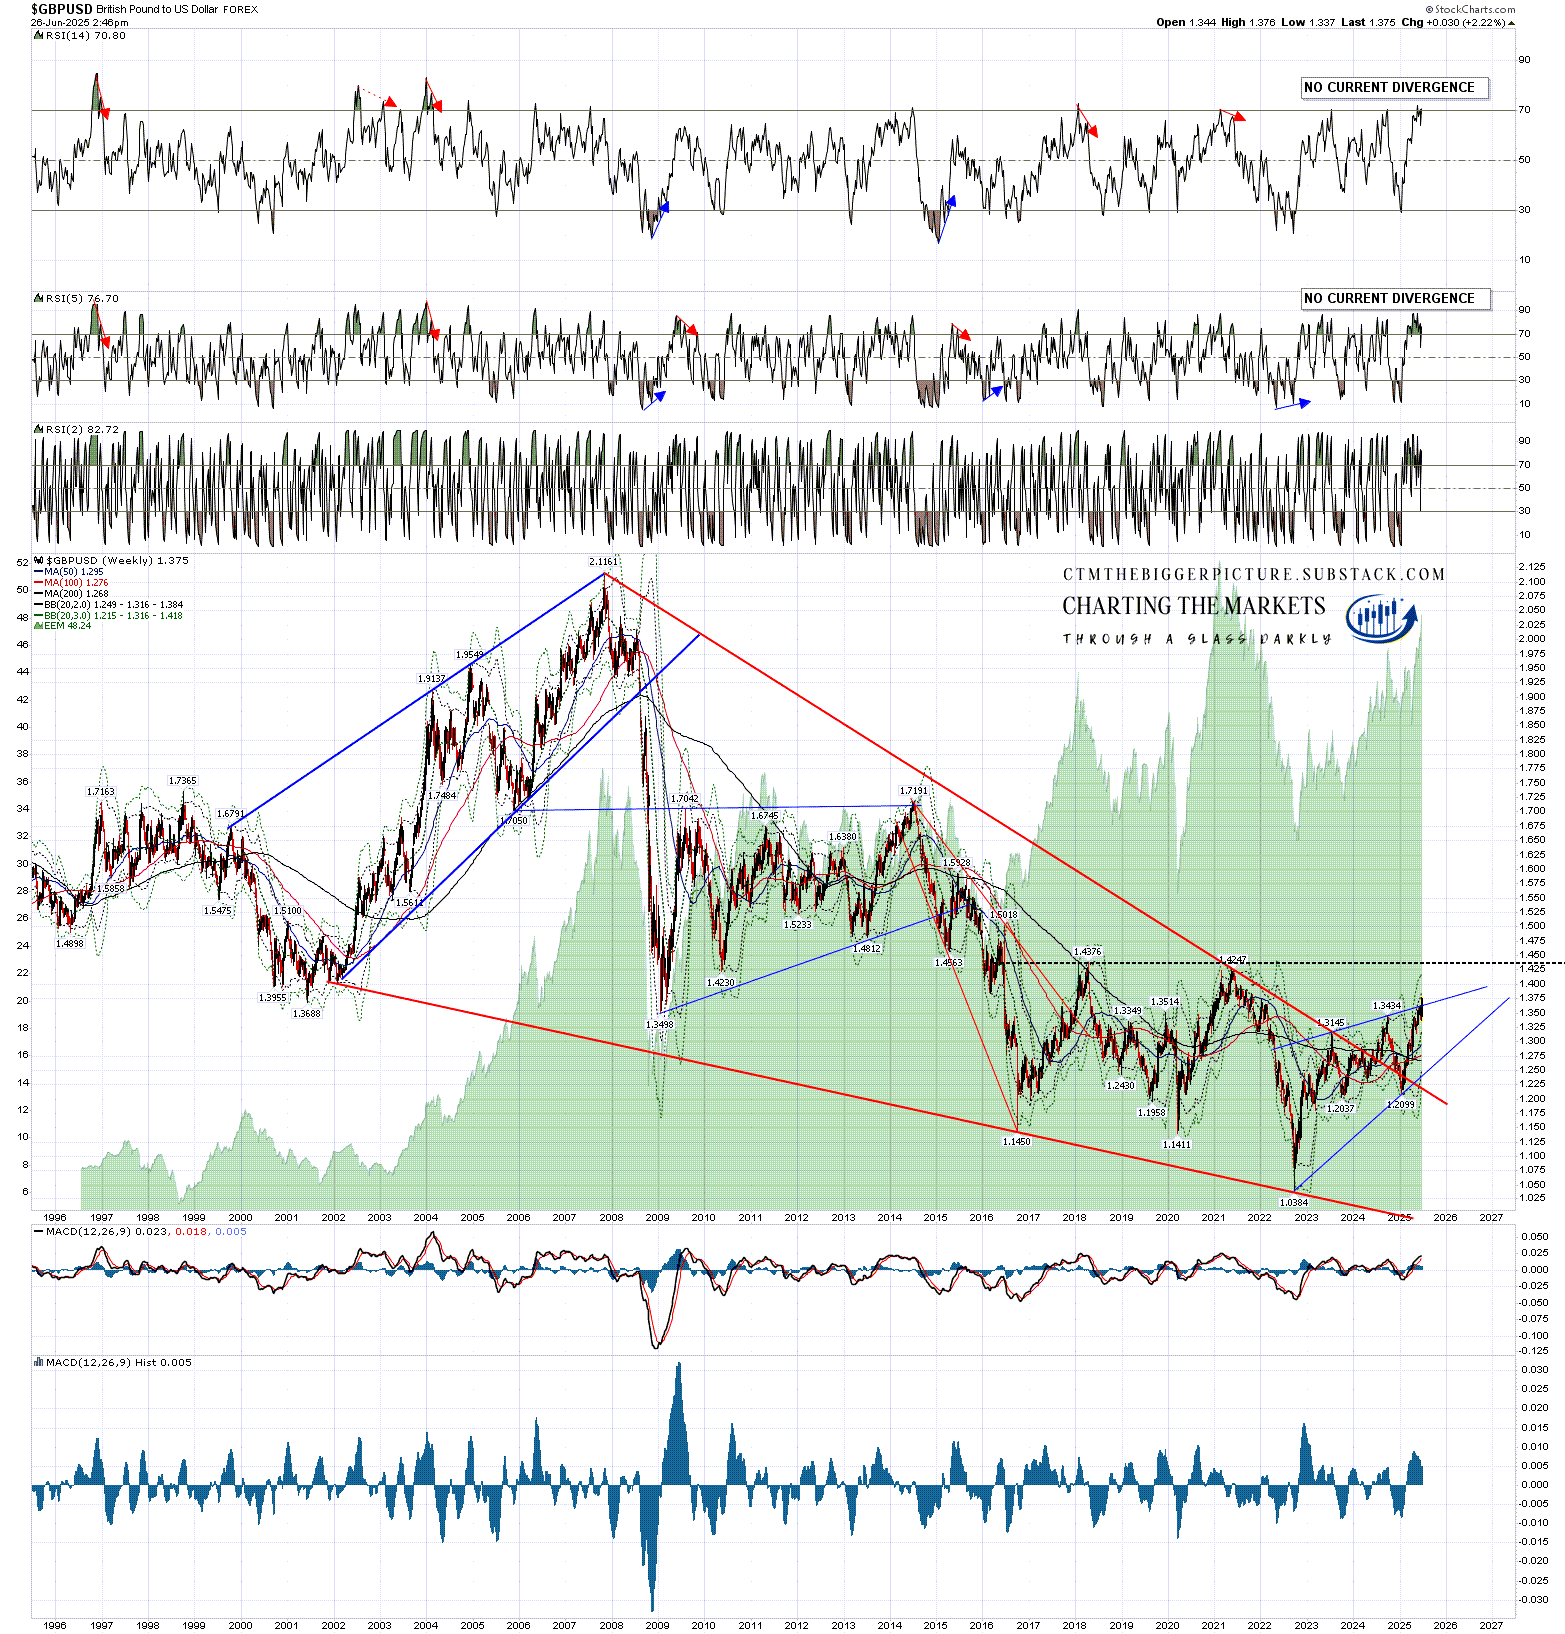
Pounds Sterling (GBP) is 11.9% of the USD index and with minor differences the setup on GBPUSD is almost identical to the setup on EURUSD.

GBPUSD weekly chart:

When I’m looking at USD direction I don’t usually pay much attention to US government policy, as apart from the obvious possible exception of the Plaza Accord in 1985 to devalue USD in the aftermath of the Latin American Debt Crisis in the early 1980s, I’ve never seen that make any real difference to the obvious longer term trends and targets, and I’m not seeing anything to suggest that current US government policies might change those either.

What I am wondering here though is whether US government policies might accelerate this process and send the US dollar down towards the obvious longer term target at a retest of the 2008 low at 70.70 earlier, and a lot faster, than would otherwise have been the case. We’ll see what happens at this current and very important inflection point.

If you like my analysis and would like to see more, please take a free subscription at my thebiggerpicture substack, where I publish these posts first and for members (from next week) also bi-weekly videos looking at equity indices, bonds, currencies and commodities. Those videos are posted on my Youtube channel after a four day delay. Links to all my posts from my charting substacks are also always posted on my twitter.

Tuesday, 24 June 2025

State of Confusion

In my posts on 3rd June and on 11th June I was putting the case for retests of the all time highs on SPX and QQQ, and potentially also on DIA and IWM. In the event that equity indices went higher from there I was also giving targets for that.

In my post on Friday 20th June I laid out a possible short term retracement scenario that I said I didn’t like but was potentially on the cards, and that didn’t happen, despite the US joining the war against Iran over the weekend.

Since the weekend that modest bearish scenario has collapsed, SPX and QQQ have made new highs for June, oil futures fell an amazing $14 from high to low yesterday as fears of an extended conflict in the Middle East receded.

This has been a very resilient market, all we have seen in recent weeks is a modest retracements preceding higher highs, and key short term support at the daily middle bands has held everywhere on these indices except on DIA, which traded under the middle band for a few days and is now back above it. The way is open for at least retests of the all time highs on SPX and QQQ, and those retests are the next obvious upside targets.

On the SPX daily chart the daily middle band has been support since it was broken and converted to support after the April low and that was tested again yesterday morning and held again. Until that is broken and converted to resistance this market is leaning higher.

SPX daily chart:

Is there a case for going significantly higher than a retest of the all time highs on SPX and QQQ? Yes, though it is only really based on a large IHS on the IWM daily chart, and this IHS could of course fail.

Until that fails though, this is a high quality IHS on IWM that has broken up with a target at the retest of the all time high at 243.04. This is a high quality pattern and would only fail on a break back below the IHS right shoulder low at 199.10. IWM also held support at the daily middle band yesterday and there’s no current sign that this IHS might fail.

If the IHS reaches target then that would imply that while that was happening, SPX, QQQ and DIA would likely go significantly higher, and I was laying out the possible targets for those moves in my posts on 3rd June and on 11th June.

IWM daily chart:

Looking short term the highest quality H&S that I was looking at on Friday was on IWM. That H&S broke down slightly and then failed this morning with a break over the right shoulder high. I’d expect at least a test of the June high after this and we may well see extension higher as the rising wedge shown on the chart below evolves into a larger uptrend pattern.

IWM 15min chart:

As with QQQ, SPX has now retested the June high and this could be a short term double top, though there nothing currently to suggest that is likely. If instead we see a move to retest the all time high at 6147.43, with the high so far today at 6078.71, that is less than 70 handles away.

SPX 15min chart:

The setup on QQQ is the same. If we see a move to retest the all time high at 539.80, with the high so far today at 538.18, that is even closer.

QQQ 15min chart:

This has been a strange and very news-heavy year, but the charts have still been pointing the way reliably. In my post on 19th February I laid out all the topping pattern on these four US indices that then all played out. I called the case for a decent rally in my post on 18th March, and the likely top on that rally on 26th March. In my post on 11th April I was talking about the possibility that the rally that had just started might deliver retests of the all time highs on at least SPX and QQQ. There are more examples but my point is that most of the reversals this year, large and small, have been signalled by the charts beforehand despite the high density of news.

My point with my post title today is that while there has been, and remains, a lot of confusion in the US this year, the charts have been the best guide to what is coming next in the US so far, and will likely remain the best guide to what happens over the rest of this year and beyond. My focus remains there.

I’ve been saying the following on all my posts so far this year:

As I have been since the start of 2025 I’m still leaning on the bigger picture towards a weak first half of 2025 and new all time highs later in the year, very possibly as a topping process for a much more significant high. One way or another I think we’ll be seeing lower soon and I’m not expecting this to be a good year for US equities, not least because both of the last two years have been banner years for US equities. A third straight year of these kinds of gains looks like a big stretch. I could of course however be mistaken.

If you like my analysis and would like to see more, please take a free subscription at my chartingthemarkets substack, where I publish these posts first. I also do a premarket video every day on equity indices, bonds, currencies, energies, precious commodities and other commodities at 8.45am EST, but only for paying subscribers. Other places to find me are my twitter, and my Youtube channel.

Monday, 23 June 2025

Candidate Low on Crypto

In my post on Tuesday 17th June I was looking at an inflection point on Crypto that might break down, and gave targets for that move. That setup started breaking down on Friday and two out of three of those downside target areas, on Bitcoin (BTCUSD) and Ethereum (ETHUSD) were reached over the weekend.

The target that has not been reached was on Solana (SOLUSD) but there is a decent case for all three making a significant low at the weekend lows.

Back in my post on Monday 12th May I was laying out a scenario where possible large large IHS patterns were forming on Solana and Ethereum and I gave the ideal right shoulder targets at 125.43 on Solana and 2135.28 on Ethereum. The weekend lows were at 126.09 and 2113.65 respectively.

Are these possible IHS patterns still in play? Well the IHS necklines have moved a bit, and making the right shoulders took longer than expected but yes, they are both still in play.

Looking at Solana first on the hourly chart the possible IHS is a bit long in the right shoulder, but the shoulder lows are at similar levels and this is still a decent quality IHS. On a sustained break above the neckline, currently in the 192 area, the target would be in the 282 area, and that would likely extend into a retest of the all time high at 294.95.

SOLUSD 60min chart:

Looking at the Ethereum hourly chart the possible IHS is also a bit long in the right shoulder, but the shoulder lows are at similar levels and this is also a decent quality IHS. On a sustained break above the neckline, currently at 2880, the target would be at a retest of the 2024 high at 4109.05, with an extension target in the 4350 area. That might then continue into a test of the all time high at 4865.94.

In my last post I gave the target area for Ethereum in the 2000 to 2200 area, mainly with this IHS in mind, but I should note that a small asymmetric double top has broken down with a target in the 1900 to 2000 area, and if we do see more downside then that is still an open target area.

ETHUSD 60min chart:

In my last post I was looking at a possible bull flag forming on BTCUSD and that reached the 100k target and overshot it slightly, in what currently looks like a bullish underthrow before the break up into the all time high retest.

BTCUSD 60min chart:

So what’s next? Well this is a nice looking low, and the touches of the 3sd daily lower bands on all three suggest at least a bounce here, but in order to deliver Bitcoin now needs to break back up over declining resistance at the monthly pivot, 50dma and daily middle band, all currently in the 103345, 104978 and 105098 areas respectively, and convert them to support.

BTCUSD daily chart:

Solana has a larger mountain of resistance levels to climb, with the daily middle band, 50dma and then the 200dma, all currently in the 148, 160 and 170 areas respectively. The 200dma in particular has held as resistance since February and is the key resistance above that must be converted to support to open the upside.

SOLUSD daily chart:

Ethereum has a smaller but still significant mountain of resistance levels to climb, with the daily middle band, 50dma and then the 200dma, all currently in the 2517, 2490 and 2586 areas respectively. The 200dma in particular has held as resistance six times since February and is the key resistance above that must be converted to support to open the upside.

ETHUSD daily chart:

I like this scenario a lot but we really need some Crypto bulls to turn up and do some damage to the upside here and soon. If not then there are still open targets below at the retest of the 2025 low at 95.24 on Solana and in the 1900 to 2000 area on Ethereum. There is a parallel though much less bullish scenario on equities here to run alongside this, as long as Crypto and equities remain positively correlated, and in my view, if both need to play out together, that would be much best done in the next two or three months.

So far this year I have been and am still leaning towards seeing weakness in the first half of the year and renewed strength in the second half of 2025, with a very possible bull market high on Crypto pencilled in close to the end of the year. That scenario would be a good match with past Crypto bull markets. Is it possible that I am mistaken? Always, but we can only ever try to identify the higher probability paths in the future. Only time can show us the path that is actually taken. Still, I’m with Confucious who said ‘study the past, if you would divine the future’. - 22nd May 2025 - IDEALLY THE PATH FROM HERE TAKES CRYPTO INTO A BULL MARKET HIGH IN OR CLOSE TO DECEMBER 2025

If you’d like to see more of these posts and the other Crypto videos and information I post, please subscribe for free to my Crypto substack. I also do a premarket video every day on Crypto at 9.05am EST. If you’d like to see those I post the links every morning on my twitter, and the videos are posted shortly afterwards on my Youtube channel.

I'm also to be found at Arion Partners, though as a student rather than as a teacher. I've been charting Crypto for some years now, but am learning to trade and invest in them directly, and Arion Partners are my guide around a space that might reasonably be compared to the Wild West in one of their rougher years.

Tuesday, 17 June 2025

A Perfect Inflection Point on Crypto


In my last post on Monday 9th June I was looking at the bull setup on Crypto and that was looking very promising, and still looks promising, but I did note that Solana still needed to break back over the 50dma daily middle band and the daily middle band and convert them to support to open the upside.

That didn’t happen, with a closing break over the middle band that rejected the next day. From there Solana made a slightly lower low in the 140-3 support area. Solana then retested the daily middle band again yesterday, and so far is failing there again.

The short term bull case depends on all of Bitcoin (BTCUSD) , Solana (SOLUSD) and Ethereum (ETHUSD) converting and holding their daily middle bands as support and, at the time of writing, all are currently below their respective middle bands.

SOLUSD daily chart:

So is there an obvious bear scenario on Crypto here? Yes, and I was talking about that on my daily premarket videos as Solana was testing the daily middle band last week.

That bear scenario is clearest on Solana, which is the reason I am leading with that today. My concern last week was that if Solana was to fail hard at the daily middle band, then that might complete an H&S pattern that on a subsequent sustained break below 140 would look for a target at a retest of the June low at 95.24. That H&S pattern is now fully formed, but has not yet broken down.

If that H&S breaks down and makes target I’d be leaning towards that retest making the second low of a large double bottom.

SOLUSD 60min chart:

Bitcoin is also currently under the daily middle band, currently at 105858. I would also note though that since the break up from the April lows, the 50dma, currently at 104090 has been main support, and that is currently still holding. A clear closing break below would be a good indication that this short term bear scenario on Crypto may well be playing out.

BTCUSD daily chart:

So what would be the target for a down move on Bitcoin here? Well I’ve drawn in a part-formed bull flag falling wedge on the chart below and I have flag support in the 100k area. That’s the level I’d be watching.

BTCUSD 60min chart:

Ethereum has delivered some very strong tests of double resistance at the daily middle band, currently at 2579, and the 200dma slightly higher currently at 2625, but is currently back below both. It is still currently holding above 50dma support, currently at 2425, and if that breaks, that would again be a good indication that this short term bear scenario on Crypto may well be playing out.

ETHUSD daily chart:

So what would the target on a break down on Ethereum be? Well on this scenario I would be thinking that an alternate right shoulder on the larger IHS would be forming, with an ideal target in the 2000-2200 area.

ETHUSD 60min chart:

If this bear scenario plays out, all the target areas I have mentioned would be consistent with the larger bull scenario that I laid out last week as long as those target levels were not broken with confidence.

There is another point to consider here of course, namely that Crypto is still very positively correlated with equities, and consequently that the bull scenario on Crypto hasn’t been playing out so far in part because equities are also still pinned to an inflection point area here. If we do see this bear scenario play out on Crypto then I’d expect that to happen as equities declined as well, though more on the scale of Bitcoin than Solana of course. We’ll see.

So far this year I have been and am still leaning towards seeing weakness in the first half of the year and renewed strength in the second half of 2025, with a very possible bull market high on Crypto pencilled in close to the end of the year. That scenario would be a good match with past Crypto bull markets. Is it possible that I am mistaken? Always, but we can only ever try to identify the higher probability paths in the future. Only time can show us the path that is actually taken. Still, I’m with Confucious who said ‘study the past, if you would divine the future’. - 22nd May 2025 - IDEALLY THE PATH FROM HERE TAKES CRYPTO INTO A BULL MARKET HIGH IN OR CLOSE TO DECEMBER 2025

If you’d like to see more of these posts and the other Crypto videos and information I post, please subscribe for free to my Crypto substack. I also do a premarket video every day on Crypto at 9.05am EST. If you’d like to see those I post the links every morning on my twitter, and the videos are posted shortly afterwards on my Youtube channel.

I'm also to be found at Arion Partners, though as a student rather than as a teacher. I've been charting Crypto for some years now, but am learning to trade and invest in them directly, and Arion Partners are my guide around a space that might reasonably be compared to the Wild West in one of their rougher years.

Wednesday, 11 June 2025

Nice Smile and Impressive Beard

In my post on Sunday 1st June I was looking at the historically bearish leaning stats over four of the next six trading days and looking for a modest retracement that we then saw. I also mentioned that the last of those bearish leaning days was today, and that tomorrow through Monday 16th lean strongly bullish. Wednesday and Friday next week are the day before and after the holiday on Thursday 19th June, and lean neutral to slightly bullish historically, and we would often see modest volume and trading ranges, particularly as Friday is also quad witching June opex.

This is the start of a bullish opportunity window that may last for the next month or so particularly as the very important case on the legality of most of Trump’s tariffs being reviewed by the Supreme Court has been delayed until the end of July, and the 90 day window that delayed most of those tariffs in April is currently scheduled to expire on July 9th, with a general 50% tariff on all important from the EU also scheduled to start that day. I am wondering whether we might see a further 30 day delay of that July 9th window into August to land after that key Supreme Court decision.

What might we see in this bullish opportunity window? In my last post on Tuesday 3rd June I was laying out a bullish scenario for the next few weeks that would likely deliver new all time highs on SPX and QQQ, maybe on DIA and potentially even on IWM as well.

Looking at SPX there is now well established uptrend support first at the daily middle band, currently at 5934, then the 200dma, currently at 5802.

On the SPX daily chart I’m looking first for a retest of the all time high at 6147.83, but if the bullish setup on IWM further down in this post delivers, then this may run quite a bit higher.

SPX daily chart:

On the SPX weekly chart there is slightly lower double uptrend support at the weekly middle band, currently at 5755, supported by the 50 week MA, currently at 5760. On the bigger picture I am seeing the April low as possible double top or H&S neckline support.

Looking at the bigger picture I have a likely rising wedge from the 2020 low and the wedge resistance on that pattern is currently in the 6500 area. That trendline would in fact be the obvious next target within this overall pattern. If my IWM setup delivers then that trendline would likely be hit and we might see a bullish overthrow that goes above it.

SPX weekly chart:

Looking at the NDX (index for the QQQ ETF) weekly chart I don’t have an obvious resistance trendline target from the 2020 low, but I do have a resistance trendline from the late 2022 lows and I have that in the 24,500 to 25,000 area. That would be the obvious target and, as with SPX, we might see a break above in a bearish overthrow.

NDX weekly chart:

Looking at the INDU chart (index for the DIA ETF) I have a clear rising wedge from the 2020, but in this case wedge resistance has already overthrown and rising wedge support was broken in the move down into the April low. Here I’d ideally just be looking for a retest of the all time high and a fail. However the IWM bullish scenario might also push this over that target, in which case I’d be wondering whether the initial rising wedge might be expanding into a larger rising wedge. If so I have drawn in a possible alternate wedge resistance trendline currently in the 45500 area that would be the obvious target.

INDU weekly chart:

The IWM chart is very different to the other three, as IWM only managed to slightly beat the 2021 all time high in late 2024. IWM is the star of the current bull setup show here however as a high quality IHS has broken up with a minimum target at a retest of the all time high at 243.71, and a possible extension target in the 251 area. I’m not currently seeing any reason to think that this might deliver much more than a new all time high.

IWM weekly chart:

What is the thinking behind the post title above? Well I’ve had a few comments this year about my comments on US politics and economic policy and as a lifelong fiscal conservative and strongly classical leaning economist I must admit that I have not much cared for any US administration so far this millennium as I thought they were all very fiscally irresponsible. I remember being asked if I could think of anything complimentary to say about the Obama Administration back in about 2010 and I replied that Obama had a nice smile. If asked the same about the current Trump Administration I would reply that JD Vance has an impressive beard.

Why do I think that every US administration this millennium has been fiscally irresponsible? The chart below shows the reason for that very eloquently. Watching this entirely avoidable train wreck in slow motion over the last 25 years has been dispiriting, and has not improved my already low opinion of politicians generally.

I said in my last post that:

Does this mean that I think good things are happening under the surface in the US economy? Not at all, but I’ve noted before that changes in the economy, good and bad, tend to take a few months to feed through into the numbers. I’m seeing this as a misplaced optimism window in which we could see new all time highs that might make a last major bull market high, and set up possible large topping patterns that might then play out over the next year or two.

That remains the case so in the absence of any major policy changes by the current Administration I’m thinking that the months and perhaps years after the next big high is made, likely in the next few weeks, may well deliver very impressive bear markets on both US equity and bond markets. We’ll see.

I’ve been saying the following on all my posts so far this year:

As I have been since the start of 2025 I’m still leaning on the bigger picture towards a weak first half of 2025 and new all time highs later in the year, very possibly as a topping process for a much more significant high. One way or another I think we’ll be seeing lower soon and I’m not expecting this to be a good year for US equities, not least because both of the last two years have been banner years for US equities. A third straight year of these kinds of gains looks like a big stretch. I could of course however be mistaken.

If you like my analysis and would like to see more, please take a free subscription at my chartingthemarkets substack, where I publish these posts first. I also do a premarket video every day on equity indices, bonds, currencies, energies, precious commodities and other commodities at 8.45am EST, but only for paying subscribers. Other places to find me are my twitter, and my Youtube channel.

Monday, 9 June 2025

The Setup For A Bull Run on Crypto

In my last posts on In Monday 12th May and Thursday 22nd May I was looking at the possible setup for a retracement on Crypto that might then set up a substantial bull run on Crypto after that retracement was complete. That retracement is not yet necessarily complete, but I think it may well be, so today I want to look at that retracement, explain why I think that may be ending a bit early, and look at the large bullish IHS patterns forming on Solana (SOLUSD) and Ethereum (ETHUSD) that may deliver major high retests on both while Bitcoin (BTCUSD) makes substantial new all time highs.

Looking at the daily chart Bitcoin broke below the daily middle band into a test of the lower band, the 50dma and the 100k level. They held as support and Bitcoin is trying to break back over the daily middle band. The daily RSI 5 sell signal reached the full target. If the daily middle band is successfully converted back to support then this retracement is likely complete.

BTCUSD daily chart:

On the hourly chart a decent quality H&S formed and broke down with a target in the 93750 area. I was doubtful on my daily premarket videos about that making target and that failed last night as Bitcoin broke back over declining resistance from the all time high. The next obvious target is a retest of that all time high.

BTCUSD 60min chart:

On the daily chart Solana broke back below the daily middle band, then the 50dma, and went on a seven day daily lower band ride which ended on Saturday. The daily RSI 14 sell signal has reached the possible near miss target and the weak RSI 5 sell signal reached the full target. Resistance above is at the 50dma, currently at 160.02, and the daily middle band, currently at 162.82. A solid break back over both should confirm that this retracement is over.

Solana would still need to break and convert main resistance at the 200dma, currently at 176.58, which held as resistance twice in May. A break over that is a break over the last serious resistance blocking a strong move higher.

SOLUSD daily chart:

On the hourly chart a high quality double top broke down with a target in the 131-4 area and the retracement has reached 141.57 so far. That could be it, with the pattern next failing back into a retest of the May high at 187.67.

Back on 12th May I drew in a possible IHS right shoulder that I was thinking might form, and I have left in the arrows I drew then. What we have seen since makes an acceptable right shoulder and if Solana heads a bit lower then that would also be ok as long as Solana respects the March low at 112.19. The next obvious step in this sequence would be to return to the IHS neckline, currently in the 190 area.

On a sustained break over 190, the IHS target would be in the 270-5 area, and would likely run further to retest the all time high at 294.95.

SOLUSD 60min chart:

Ethereum saw a more modest retracement than the one on Solana, though it did briefly test the daily 3sd lower band on the currently very compressed daily bands. A full daily RSI 14 and a weak daily RSI 5 sell signal fixed and the RSI 5 sell signal has reached target. I am doubtful about the daily RSI 14 sell signal making target on this retracement though it may do later from a higher level.

Ethereum has failed at the 200dma, currently at 2657, four times since the start of May and that needs to be broken to open the upside, as is also the case with Solana.

ETHUSD daily chart:

On the hourly chart on 12th May I also drew in a possible path to form a large IHS right shoulder, and have left that on the chart. A modest but acceptable right shoulder has formed.

A small double top setup formed but never broke down, and at this point I’m not expecting it to do so.

This IHS has arguably already broken up with a target at a retest of the December high at 4109.05, and that would be my preferred draw at this point. A sustained break back over the may high at 2788.28 Looks for that retest.

ETHUSD 60min chart:

So what are the takeaways here? The bull market in Crypto demonstrably didn’t end in January and likely isn’t ending here either. There is a strong bullish setup in place that may support a big move up in all three of these instruments overall in the next few months.

I have mentioned in posts regularly this year that Crypto may decouple from equity prices this year as trouble grows in the US Treasuries markets, and Crypto becomes more attractive as a flight to safety destination. This may mean that a bull move on Crypto could take place without a corresponding move on equity markets, but that might not be necessary, as I have a decent looking bullish setup on US equity indices here as well.

So far this year I have been and am still leaning towards seeing weakness in the first half of the year and renewed strength in the second half of 2025, with a very possible bull market high on Crypto pencilled in close to the end of the year. That scenario would be a good match with past Crypto bull markets. Is it possible that I am mistaken? Always, but we can only ever try to identify the higher probability paths in the future. Only time can show us the path that is actually taken. Still, I’m with Confucious who said ‘study the past, if you would divine the future’. - 22nd May 2025 - IDEALLY THE PATH FROM HERE TAKES CRYPTO INTO A BULL MARKET HIGH IN OR CLOSE TO DECEMBER 2025

If you’d like to see more of these posts and the other Crypto videos and information I post, please subscribe for free to my Crypto substack. I also do a premarket video every day on Crypto at 9.05am EST. If you’d like to see those I post the links every morning on my twitter, and the videos are posted shortly afterwards on my Youtube channel.

I'm also to be found at Arion Partners, though as a student rather than as a teacher. I've been charting Crypto for some years now, but am learning to trade and invest in them directly, and Arion Partners are my guide around a space that might reasonably be compared to the Wild West in one of their rougher years.

Tuesday, 3 June 2025

A Modest Proposal

In my last post on Sunday 1st June I was looking at the bullish leaning stats for yesterday and today and that’s been delivering. I was leaning towards seeing a retest of the May highs on ES and NQ at 6008 and 21858 respectively and we may still see those today but ……. there is another possibility that I’m considering if those highs aren’t retested today.

Of the next six days four of them lean significantly bearish historically and there is a window there for some more consolidation and possible retracement and, while these stats are just a loose guideline, I am wondering if we might see that. We’ll see. I would note though that the window closes after that, with the subsequent three days all leaning bullish.

That’s not what this post is about though. I’ve been talking all year about seeing weakness in the first half of the year and then new all time highs in the second half of the year, and while the initial weakness was faster and harder than I was expecting, I am still expecting that follow through into new all time highs, and I want to lay out my preferred as well as my most bullish scenario for seeing that over coming weeks.

Does this mean that I think good things are happening under the surface in the US economy? Not at all, but I’ve noted before that changes in the economy, good and bad, tend to take a few months to feed through into the numbers. I’m seeing this as a misplaced optimism window in which we could see new all time highs that might make a last major bull market high, and set up possible large topping patterns that might then play out over the next year or two.

Might I be mistaken? Of course and as always, but this is how I think this might play out.

Back in my post on Friday 16th May I was looking at the daily RSI 5 spike over 90 on SPX and noted that this would generally deliver at least two weeks of retracement/consolidation, and that a good target for any retracement would be a backtest of the 200dma on SPX. We saw both, with the low at an almost perfect backtest of the 200dma.

‘From here this means that SPX likely at least consolidates without going much higher for two weeks and then we could see a larger retracement but without any strong expectation of a big decline. I am wondering though about a possible backtest of the 200dma, currently in the 5760 area.‘

So far this is a bullish backtest that is pointing higher soon, and short term uptrend support is clearly at the daily middle band, currently at 5849. I would ideally prefer not to see a daily close below that on SPX, QQQ, DIA or IWM in the next few days though, if seen, that wouldn’t invalidate the scenario for the next few months that I’m laying out below.

SPX daily chart:

So what would be my ideal upside target on SPX if we see a move from here that retests the all time high and runs on a bit further? Well on the weekly chart SPX didn’t reach the obvious resistance trendline at the highs in February, and I’m wondering if that might be corrected now. You can see on the chart below that SPX didn’t quite reach the rising support trendline from the 2020 low, instead reversing a little higher at the backtest of the early 2022 all time high, so the next obvious target within the obvious overall pattern remains that trendline.

If that target trendline was to be hit in the next two or three months, then I’d be looking for a hit in the 6450-6500 area.

SPX weekly chart:

On the NDX weekly chart there is no obvious resistance trendline for a pattern from the 2020 lows, but I’m looking at the resistance trendline for the pattern from the 2022 lows, which may still be resistance if that possibly broken pattern was just expanding in the decline into the April low.

If that target trendline was to be hit in the next two or three months, then I’d be looking for a hit in the 24000-24500 area.

NDX weekly chart:

On DIA, which is significantly further away from the highs, I’d just be looking for a retest of the all time high, possibly to make the second high of a much larger double top than the one that finished forming in February. There is a possible IHS forming on DIA, though I haven’t marked it up as I think it is too large to be valid, but there is a clear support/resistance level in the 427-30 area and, if DIA can break over that, there should then be a clear run to retest the all time high.

DIA daily chart:

IWM also has a possible IHS forming here but in this case it would not be too large to be valid. I’ve drawn in the neckline and the main and extended target arrows in blue on the chart below if IWM can deliver a sustained break back over the strong support/resistance area 210-3.

This is the most bullish pattern on the equity index charts and if this pattern delivers then that would strongly support all the other targets I have outlined above. It would also deliver new all time highs on all four of these main US equity indices which would make a solid finish for the 2020-5 bull market.

IWM daily chart:

Are there any potential bumps in the road that could derail this bullish scenario for the next few weeks and months? Frankly, there are so many that I could barely start to list them in the space available here, but equity markets have recovered this far, and bull runs as large or larger than the one above have already been playing out on numerous equity markets outside the US. I think this scenario has a decent shot, news permitting.

There is at minimum a very attractive technical scenario for seeing this happen, and over many years I have seen a lot of wild high retests on many trading instruments even when the economic or market fundamentals were strongly suggesting that a high retest was unlikely. A good example on SPX would be the high retest in 2007 that made the final high and the second high of the double top for that bull market. Time will tell, as always.

I’ve been saying the following on all my posts so far this year:

As I have been since the start of 2025 I’m still leaning on the bigger picture towards a weak first half of 2025 and new all time highs later in the year, very possibly as a topping process for a much more significant high. One way or another I think we’ll be seeing lower soon and I’m not expecting this to be a good year for US equities, not least because both of the last two years have been banner years for US equities. A third straight year of these kinds of gains looks like a big stretch. I could of course however be mistaken. UPDATE 11th March 2025 - I am wondering if this may be a bear market that dominates the whole of 2025.

If you like my analysis and would like to see more, please take a free subscription at my chartingthemarkets substack, where I publish these posts first. I also do a premarket video every day on equity indices, bonds, currencies, energies, precious commodities and other commodities at 8.45am EST, but only for paying subscribers. Other places to find me are my twitter, and my Youtube channel.