
In my last post on Sunday 1st June I was looking at the bullish leaning stats for yesterday and today and that’s been delivering. I was leaning towards seeing a retest of the May highs on ES and NQ at 6008 and 21858 respectively and we may still see those today but ……. there is another possibility that I’m considering if those highs aren’t retested today.
Of the next six days four of them lean significantly bearish historically and there is a window there for some more consolidation and possible retracement and, while these stats are just a loose guideline, I am wondering if we might see that. We’ll see. I would note though that the window closes after that, with the subsequent three days all leaning bullish.
That’s not what this post is about though. I’ve been talking all year about seeing weakness in the first half of the year and then new all time highs in the second half of the year, and while the initial weakness was faster and harder than I was expecting, I am still expecting that follow through into new all time highs, and I want to lay out my preferred as well as my most bullish scenario for seeing that over coming weeks.
Does this mean that I think good things are happening under the surface in the US economy? Not at all, but I’ve noted before that changes in the economy, good and bad, tend to take a few months to feed through into the numbers. I’m seeing this as a misplaced optimism window in which we could see new all time highs that might make a last major bull market high, and set up possible large topping patterns that might then play out over the next year or two.
Might I be mistaken? Of course and as always, but this is how I think this might play out.
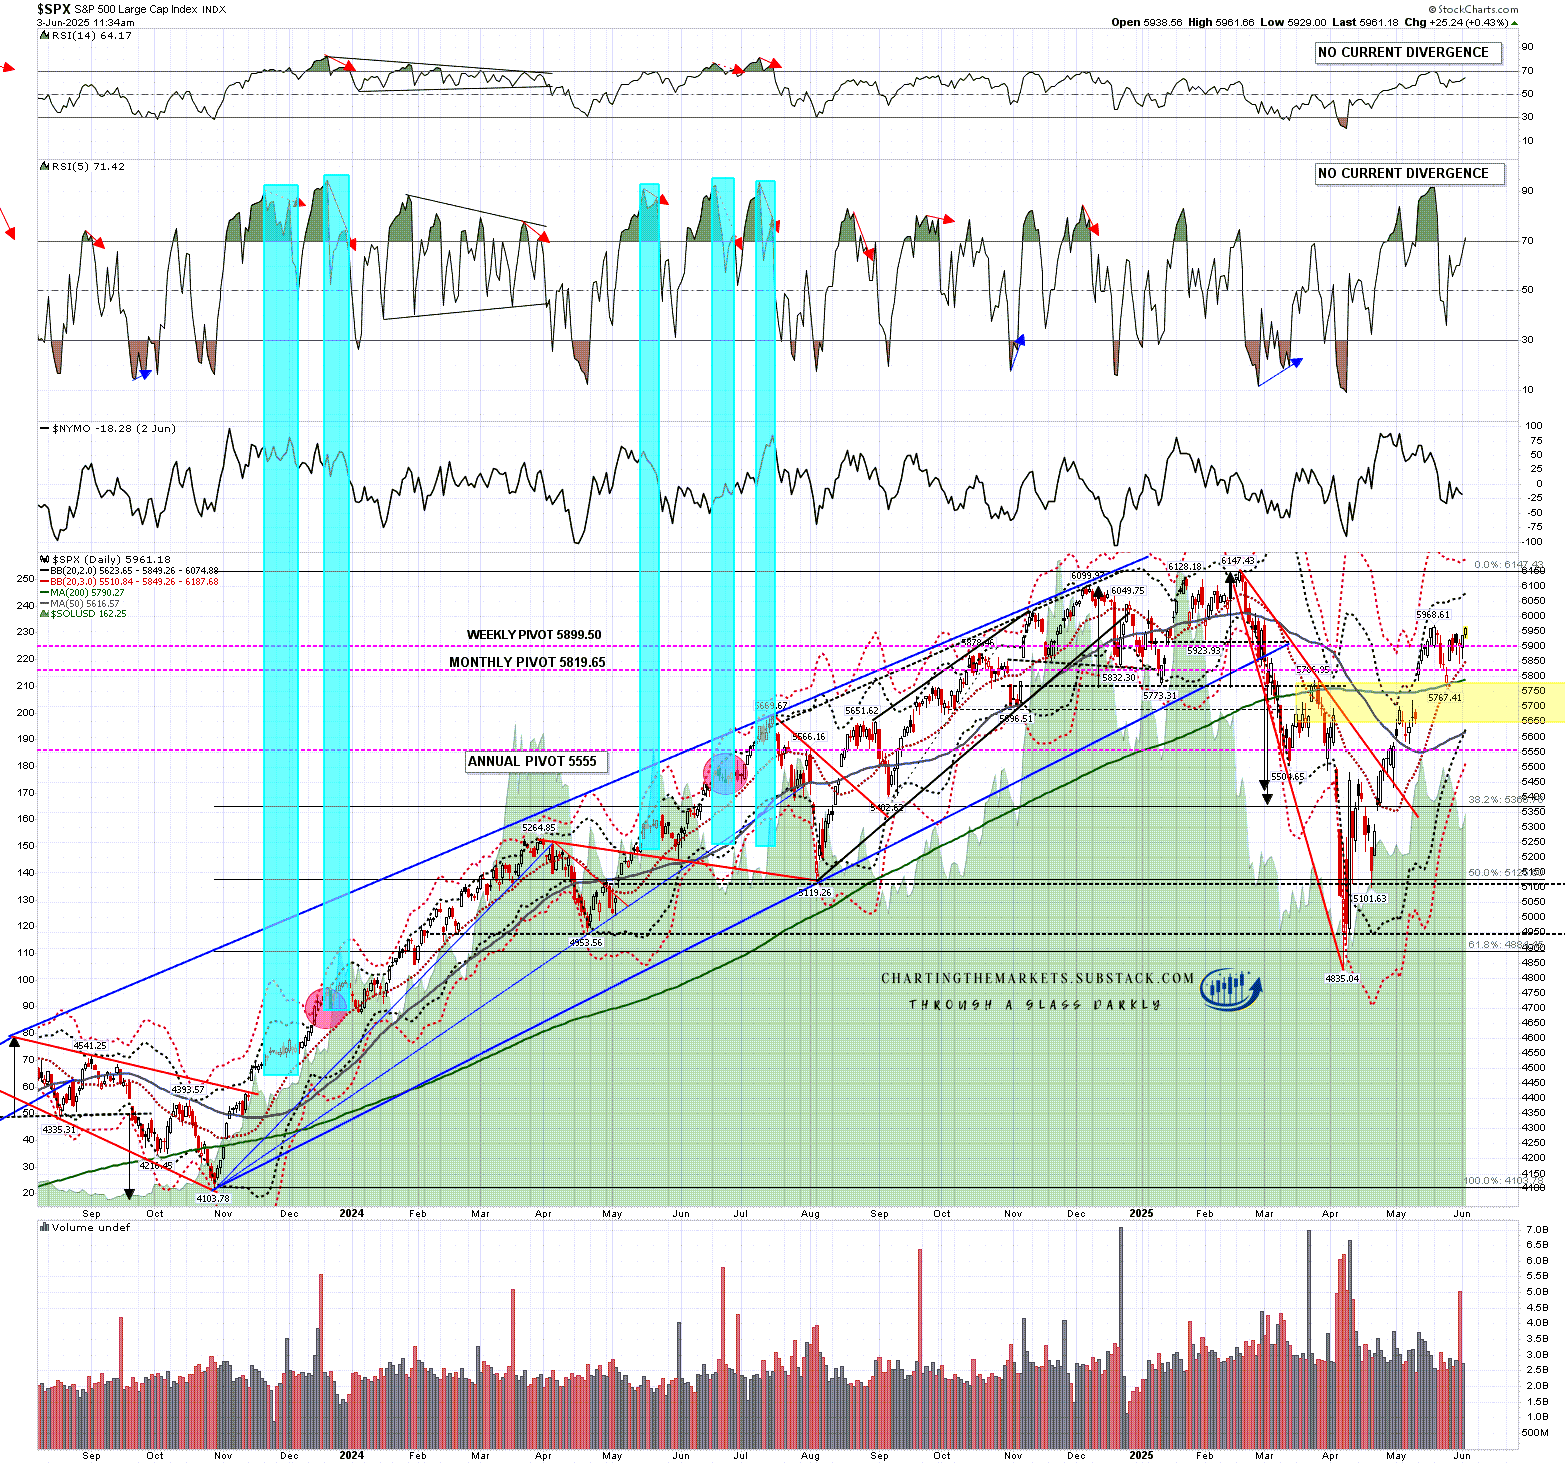
Back in my post on Friday 16th May I was looking at the daily RSI 5 spike over 90 on SPX and noted that this would generally deliver at least two weeks of retracement/consolidation, and that a good target for any retracement would be a backtest of the 200dma on SPX. We saw both, with the low at an almost perfect backtest of the 200dma.
‘From here this means that SPX likely at least consolidates without going much higher for two weeks and then we could see a larger retracement but without any strong expectation of a big decline. I am wondering though about a possible backtest of the 200dma, currently in the 5760 area.‘
So far this is a bullish backtest that is pointing higher soon, and short term uptrend support is clearly at the daily middle band, currently at 5849. I would ideally prefer not to see a daily close below that on SPX, QQQ, DIA or IWM in the next few days though, if seen, that wouldn’t invalidate the scenario for the next few months that I’m laying out below.
SPX daily chart:
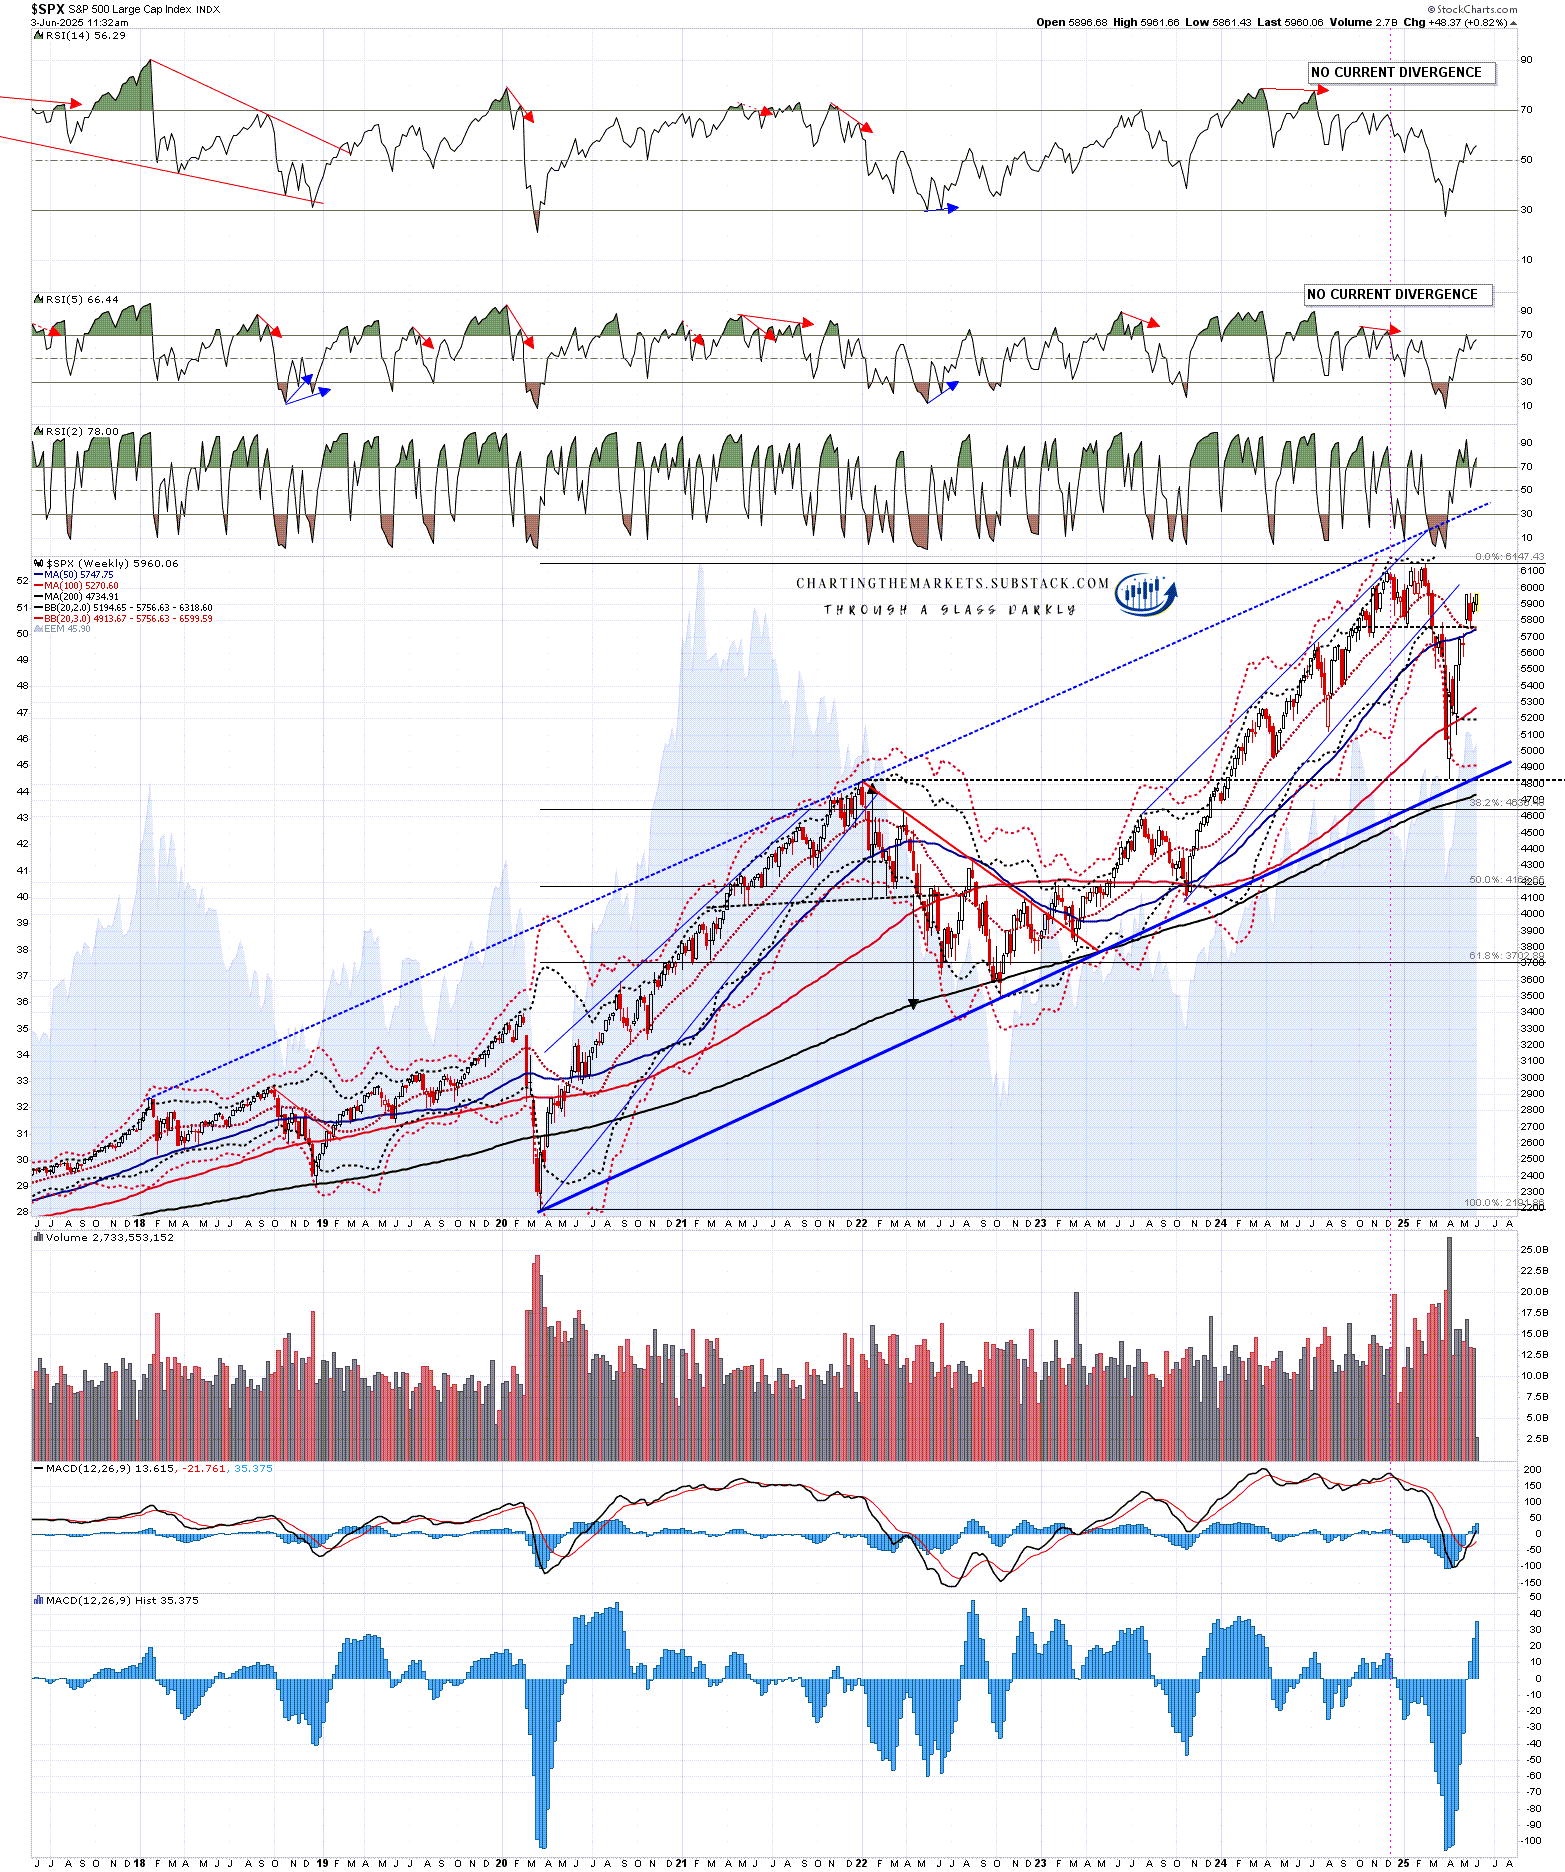
So what would be my ideal upside target on SPX if we see a move from here that retests the all time high and runs on a bit further? Well on the weekly chart SPX didn’t reach the obvious resistance trendline at the highs in February, and I’m wondering if that might be corrected now. You can see on the chart below that SPX didn’t quite reach the rising support trendline from the 2020 low, instead reversing a little higher at the backtest of the early 2022 all time high, so the next obvious target within the obvious overall pattern remains that trendline.
If that target trendline was to be hit in the next two or three months, then I’d be looking for a hit in the 6450-6500 area.
SPX weekly chart:
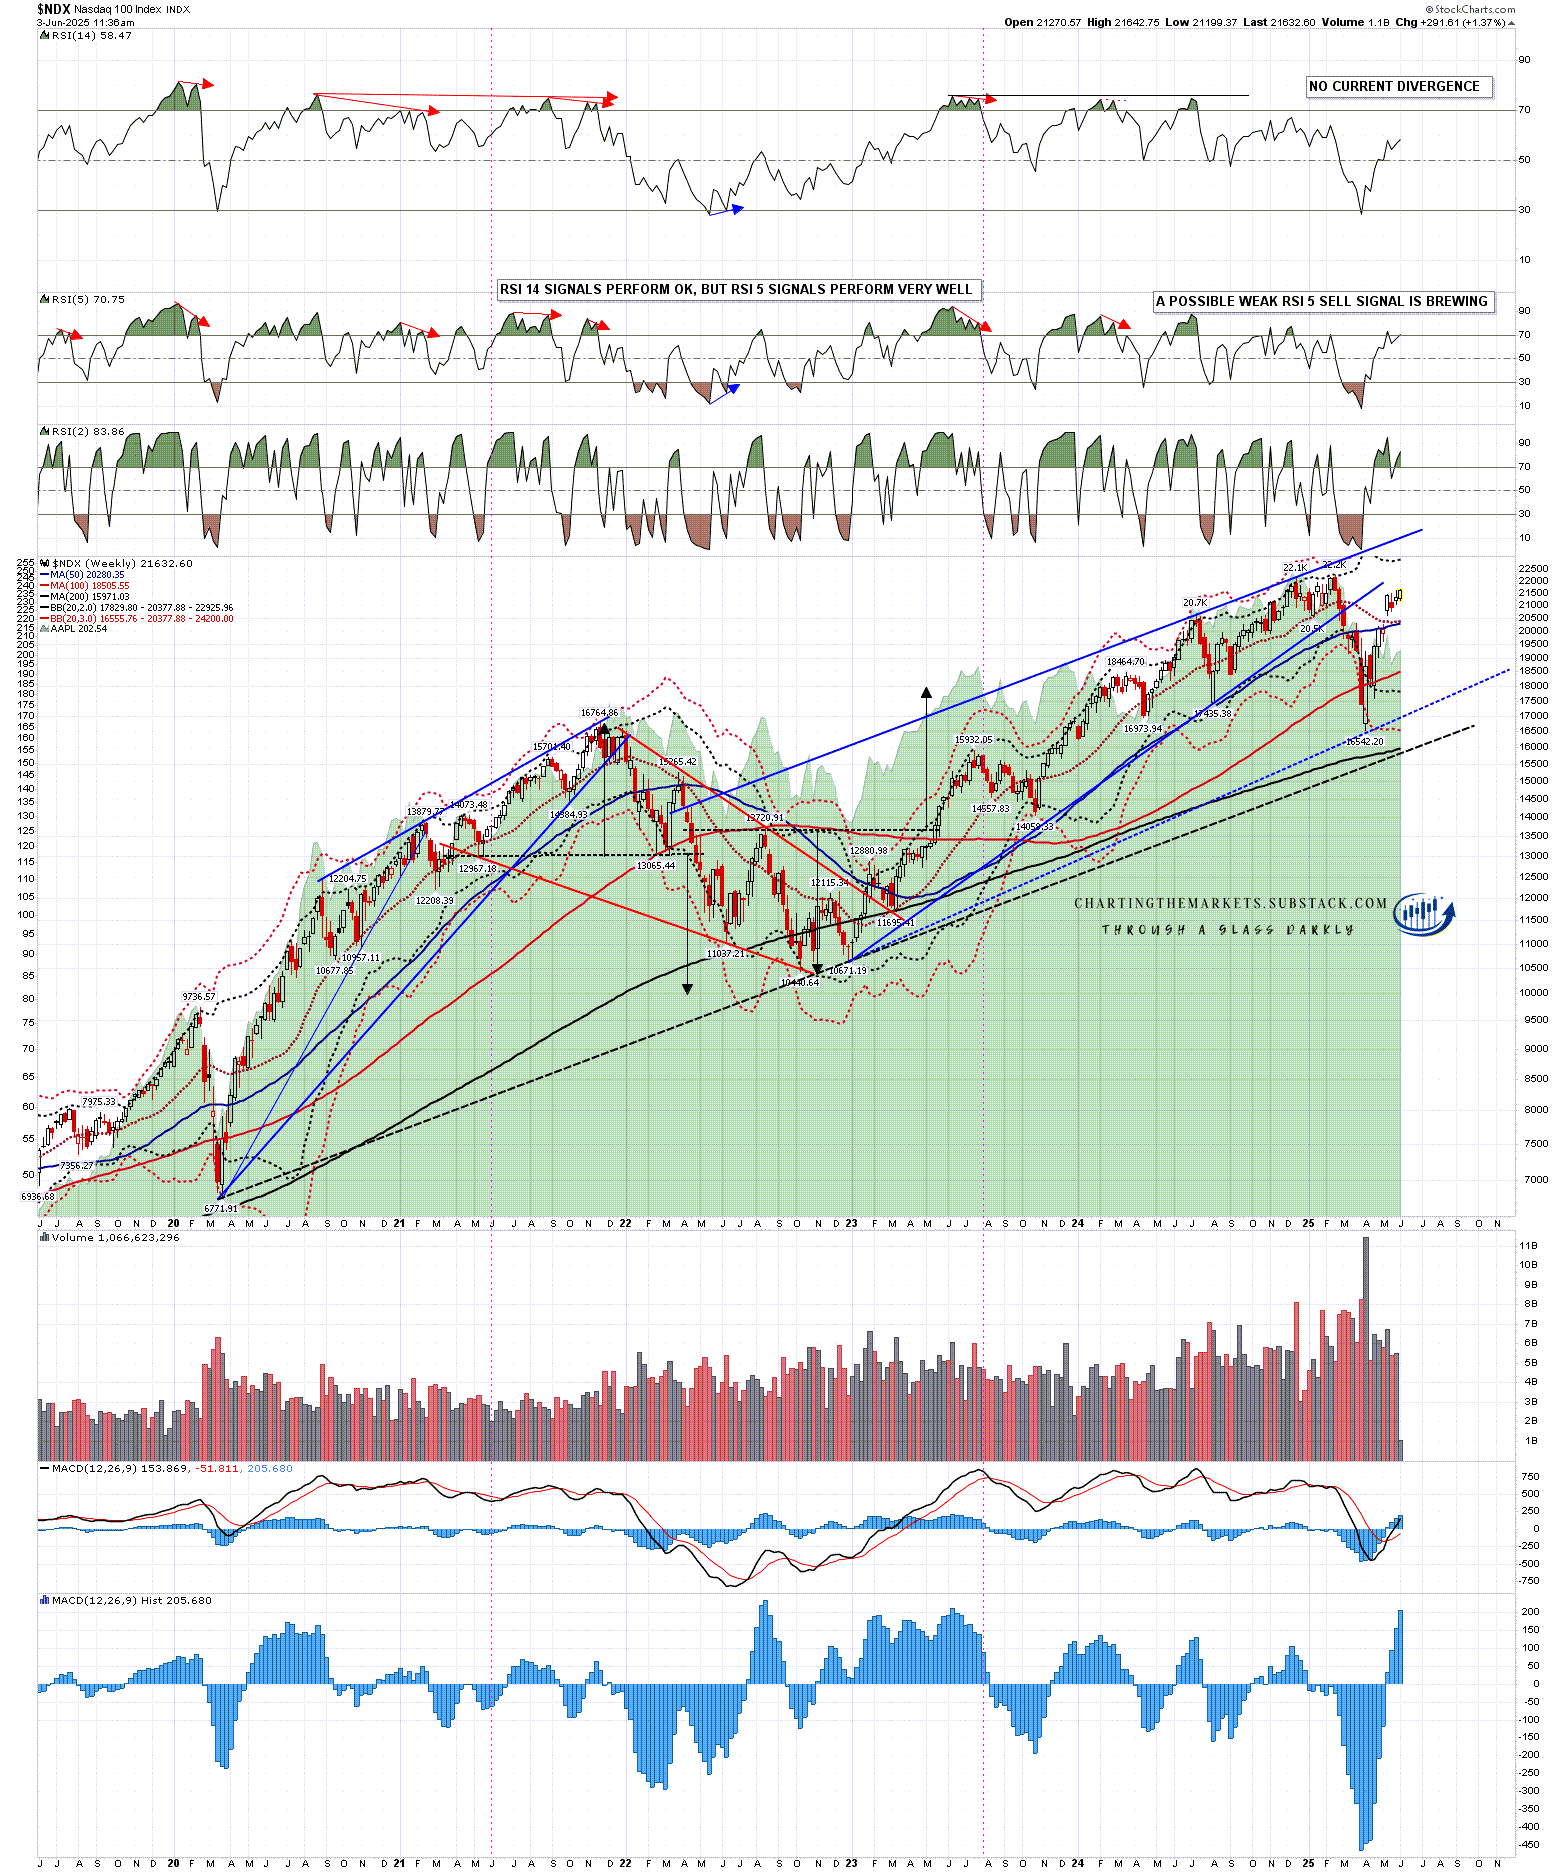
On the NDX weekly chart there is no obvious resistance trendline for a pattern from the 2020 lows, but I’m looking at the resistance trendline for the pattern from the 2022 lows, which may still be resistance if that possibly broken pattern was just expanding in the decline into the April low.
If that target trendline was to be hit in the next two or three months, then I’d be looking for a hit in the 24000-24500 area.
NDX weekly chart:
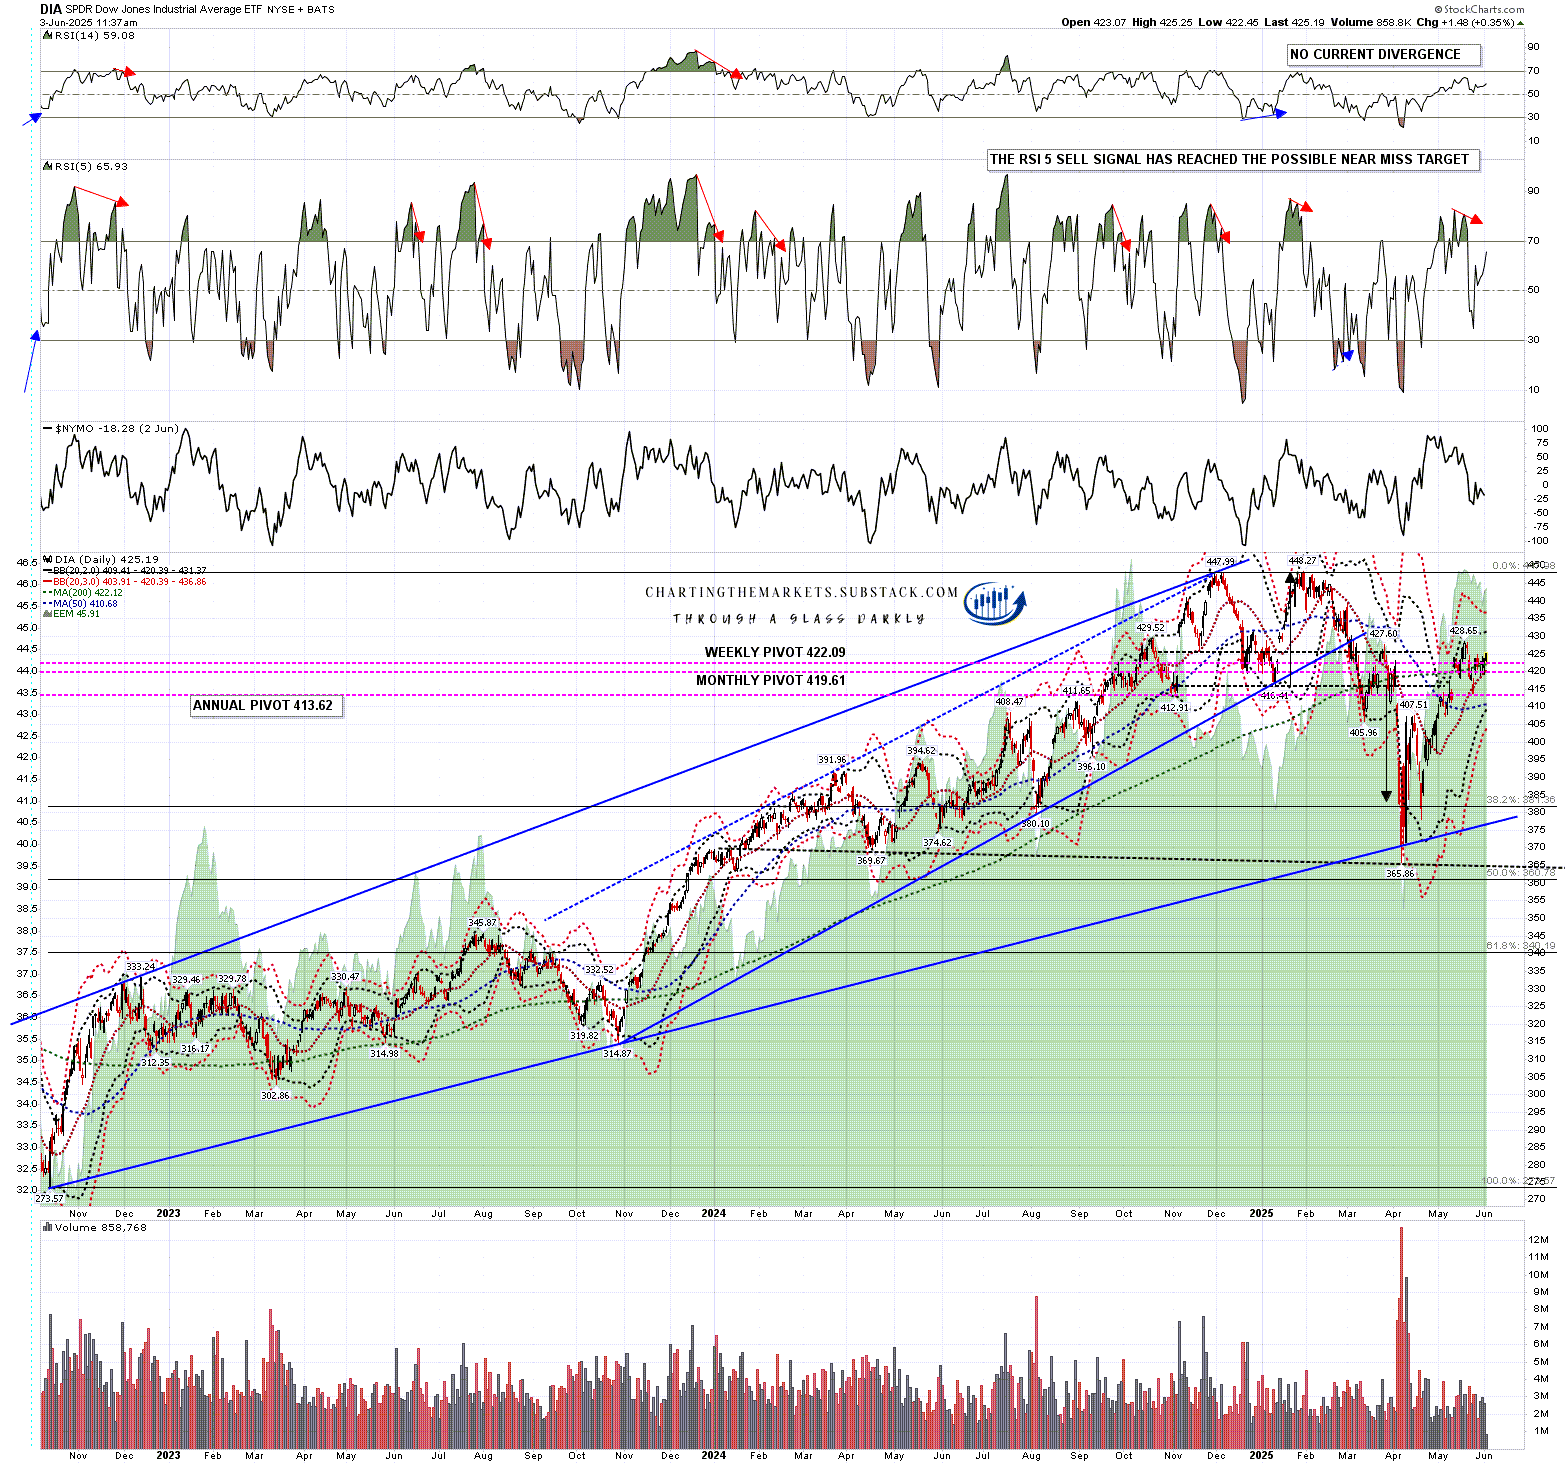
On DIA, which is significantly further away from the highs, I’d just be looking for a retest of the all time high, possibly to make the second high of a much larger double top than the one that finished forming in February. There is a possible IHS forming on DIA, though I haven’t marked it up as I think it is too large to be valid, but there is a clear support/resistance level in the 427-30 area and, if DIA can break over that, there should then be a clear run to retest the all time high.
DIA daily chart:
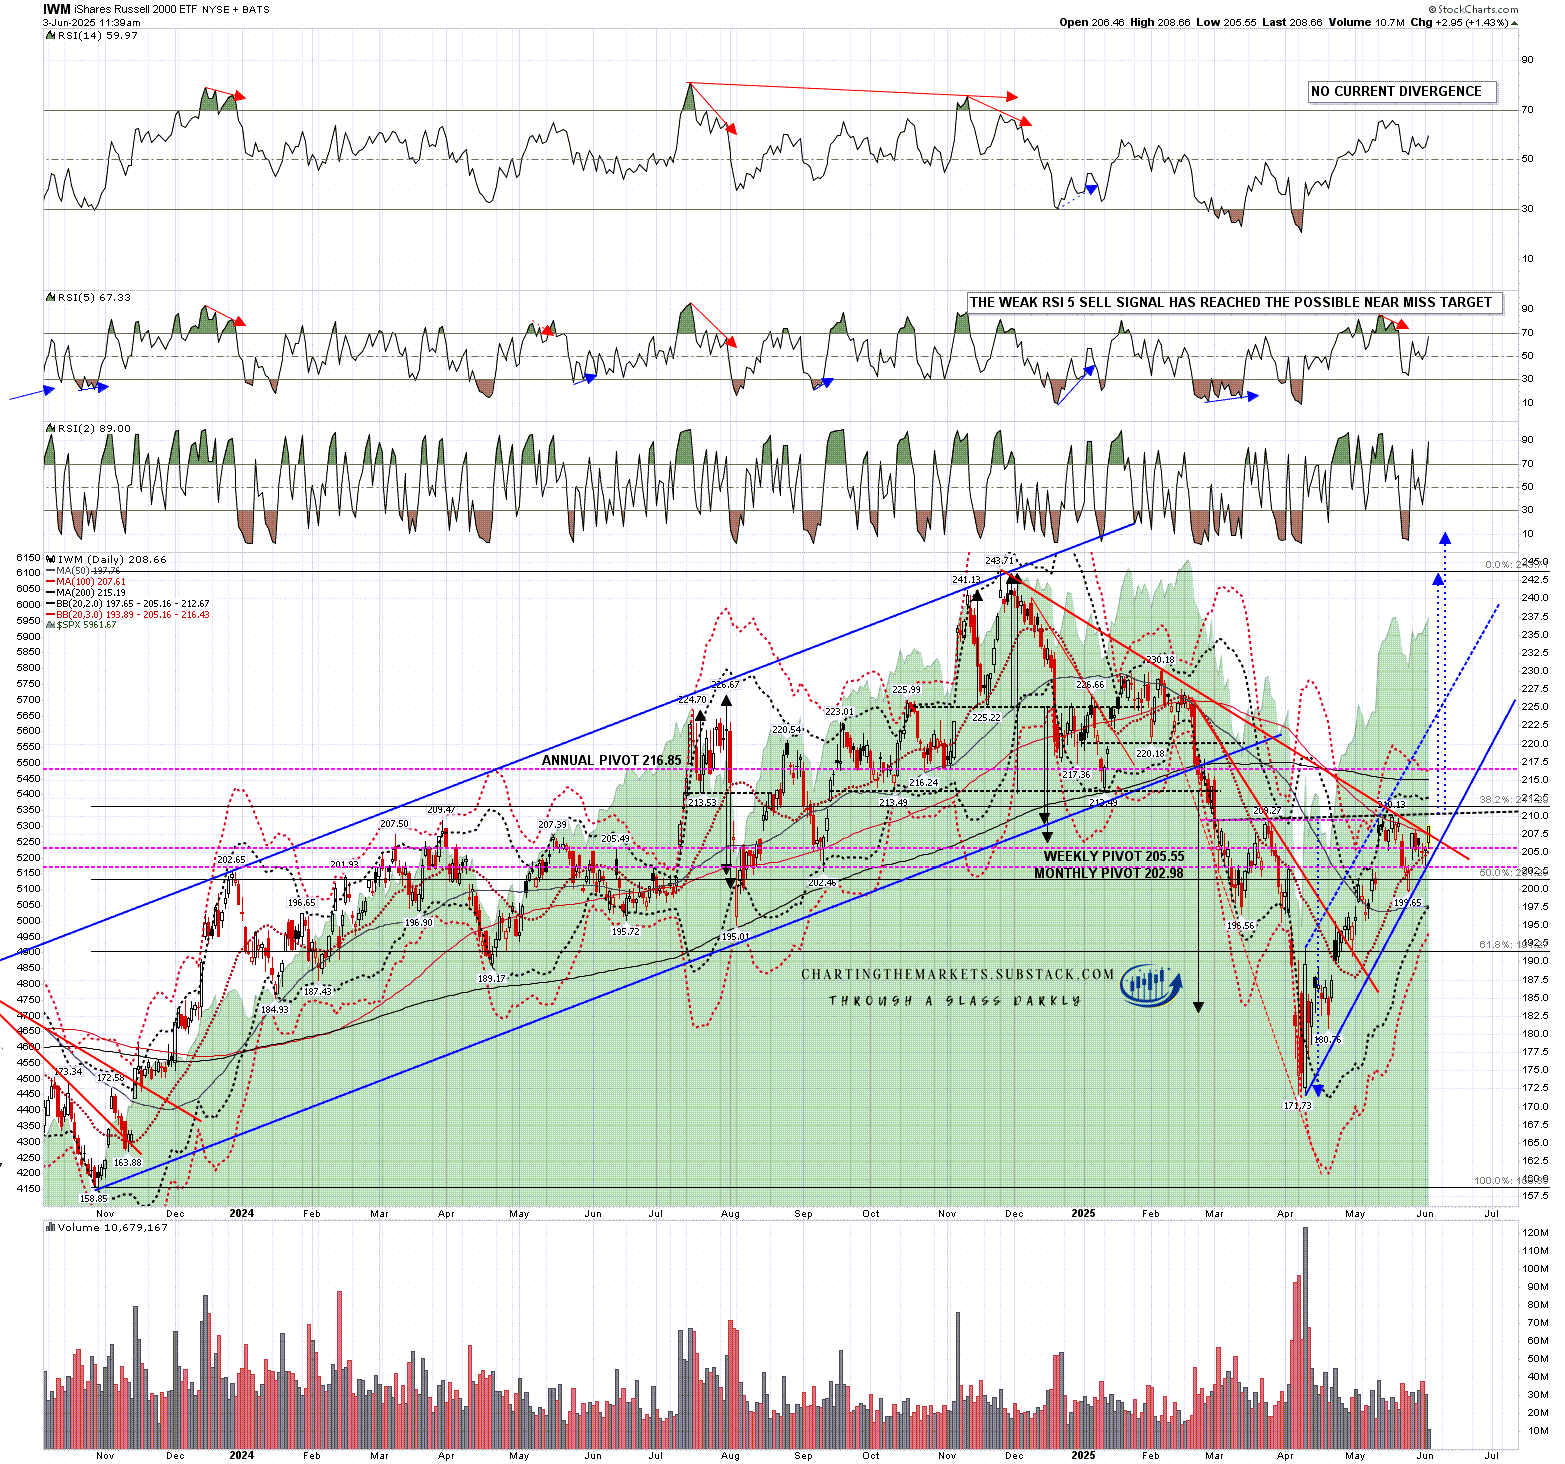
IWM also has a possible IHS forming here but in this case it would not be too large to be valid. I’ve drawn in the neckline and the main and extended target arrows in blue on the chart below if IWM can deliver a sustained break back over the strong support/resistance area 210-3.
This is the most bullish pattern on the equity index charts and if this pattern delivers then that would strongly support all the other targets I have outlined above. It would also deliver new all time highs on all four of these main US equity indices which would make a solid finish for the 2020-5 bull market.
IWM daily chart:
Are there any potential bumps in the road that could derail this bullish scenario for the next few weeks and months? Frankly, there are so many that I could barely start to list them in the space available here, but equity markets have recovered this far, and bull runs as large or larger than the one above have already been playing out on numerous equity markets outside the US. I think this scenario has a decent shot, news permitting.
There is at minimum a very attractive technical scenario for seeing this happen, and over many years I have seen a lot of wild high retests on many trading instruments even when the economic or market fundamentals were strongly suggesting that a high retest was unlikely. A good example on SPX would be the high retest in 2007 that made the final high and the second high of the double top for that bull market. Time will tell, as always.
I’ve been saying the following on all my posts so far this year:
As I have been since the start of 2025 I’m still leaning on the bigger picture towards a weak first half of 2025 and new all time highs later in the year, very possibly as a topping process for a much more significant high. One way or another I think we’ll be seeing lower soon and I’m not expecting this to be a good year for US equities, not least because both of the last two years have been banner years for US equities. A third straight year of these kinds of gains looks like a big stretch. I could of course however be mistaken. UPDATE 11th March 2025 - I am wondering if this may be a bear market that dominates the whole of 2025.
If you like my analysis and would like to see more, please take a free subscription at my chartingthemarkets substack, where I publish these posts first. I also do a premarket video every day on equity indices, bonds, currencies, energies, precious commodities and other commodities at 8.45am EST, but only for paying subscribers. Other places to find me are my twitter, and my Youtube channel.
No comments:
Post a Comment