
In my post on Sunday 1st June I was looking at the historically bearish leaning stats over four of the next six trading days and looking for a modest retracement that we then saw. I also mentioned that the last of those bearish leaning days was today, and that tomorrow through Monday 16th lean strongly bullish. Wednesday and Friday next week are the day before and after the holiday on Thursday 19th June, and lean neutral to slightly bullish historically, and we would often see modest volume and trading ranges, particularly as Friday is also quad witching June opex.
This is the start of a bullish opportunity window that may last for the next month or so particularly as the very important case on the legality of most of Trump’s tariffs being reviewed by the Supreme Court has been delayed until the end of July, and the 90 day window that delayed most of those tariffs in April is currently scheduled to expire on July 9th, with a general 50% tariff on all important from the EU also scheduled to start that day. I am wondering whether we might see a further 30 day delay of that July 9th window into August to land after that key Supreme Court decision.
What might we see in this bullish opportunity window? In my last post on Tuesday 3rd June I was laying out a bullish scenario for the next few weeks that would likely deliver new all time highs on SPX and QQQ, maybe on DIA and potentially even on IWM as well.
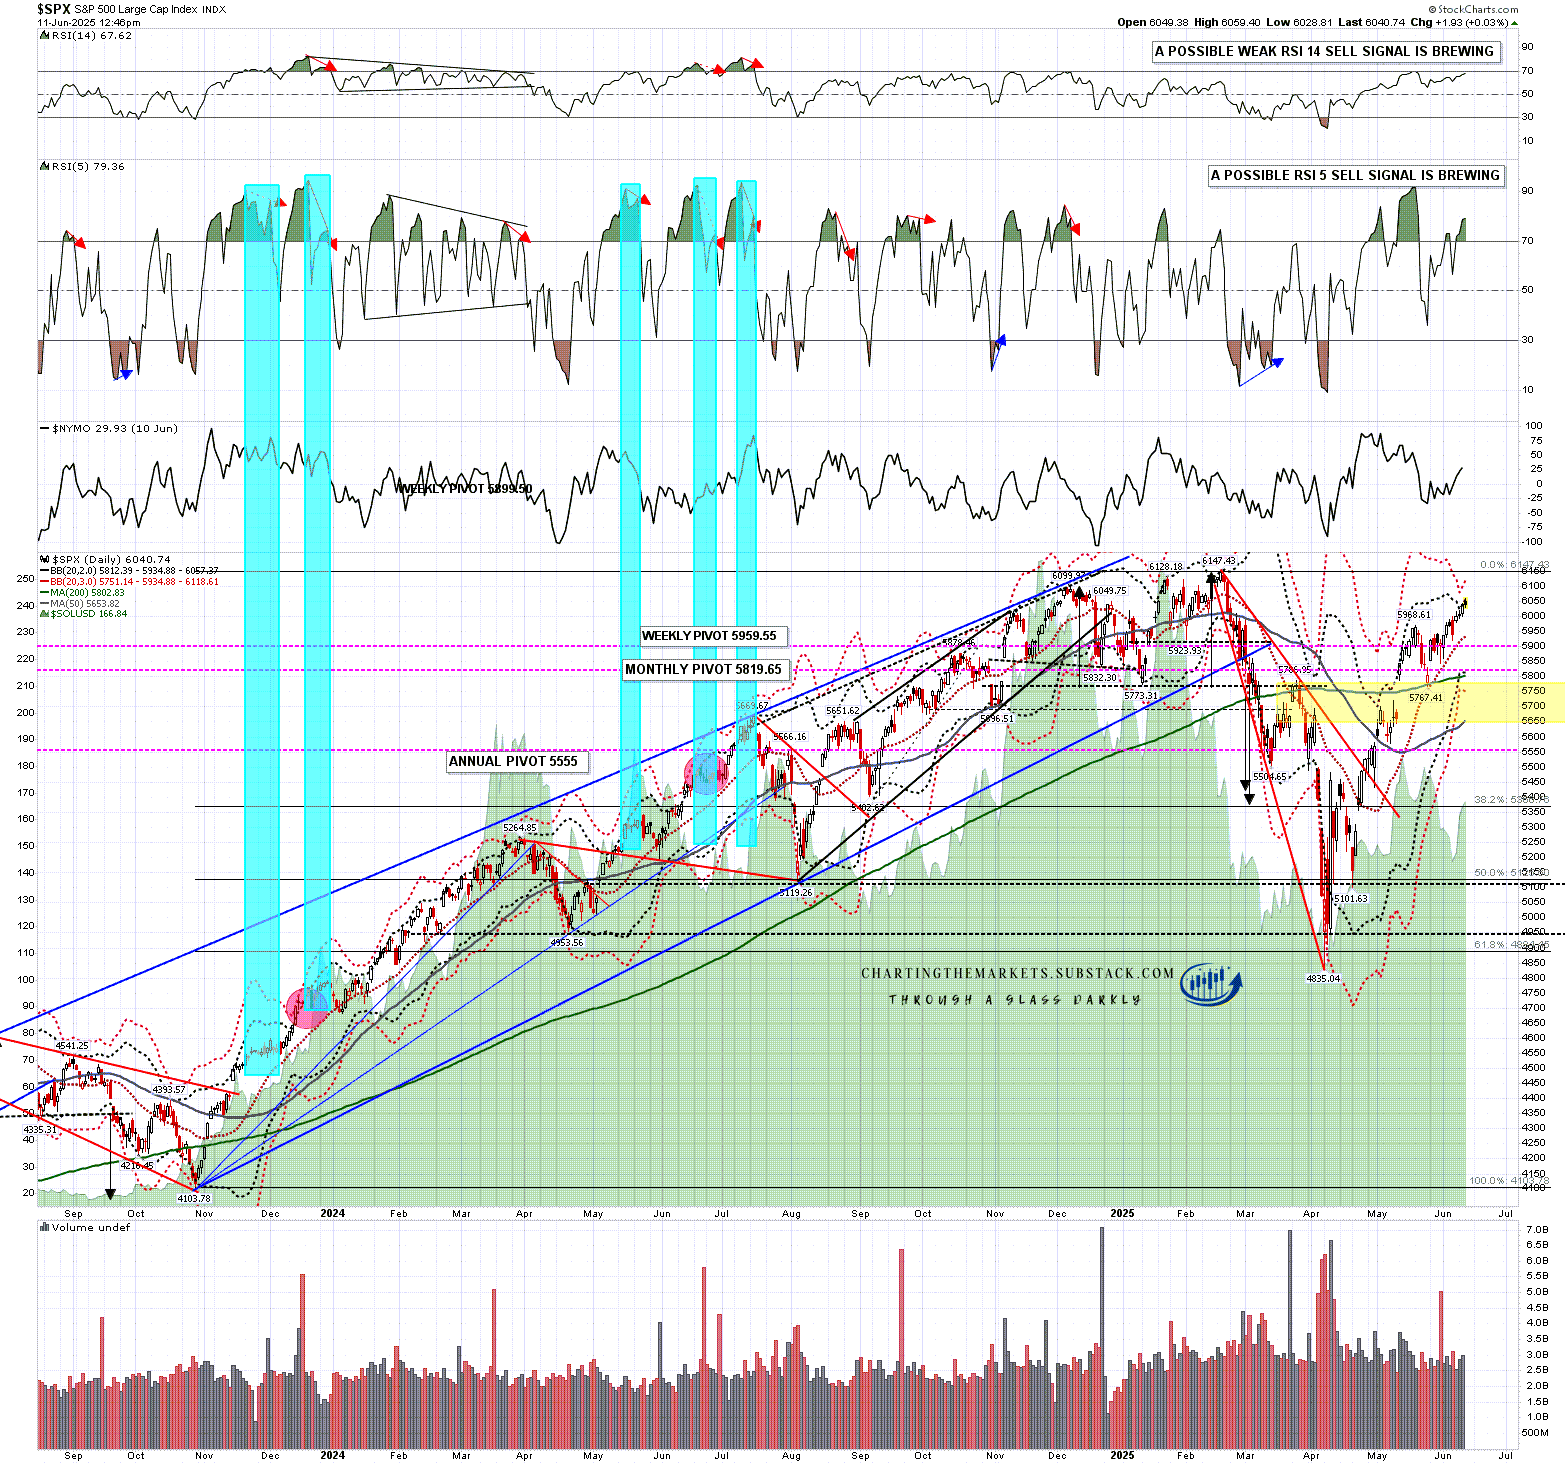
Looking at SPX there is now well established uptrend support first at the daily middle band, currently at 5934, then the 200dma, currently at 5802.
On the SPX daily chart I’m looking first for a retest of the all time high at 6147.83, but if the bullish setup on IWM further down in this post delivers, then this may run quite a bit higher.
SPX daily chart:
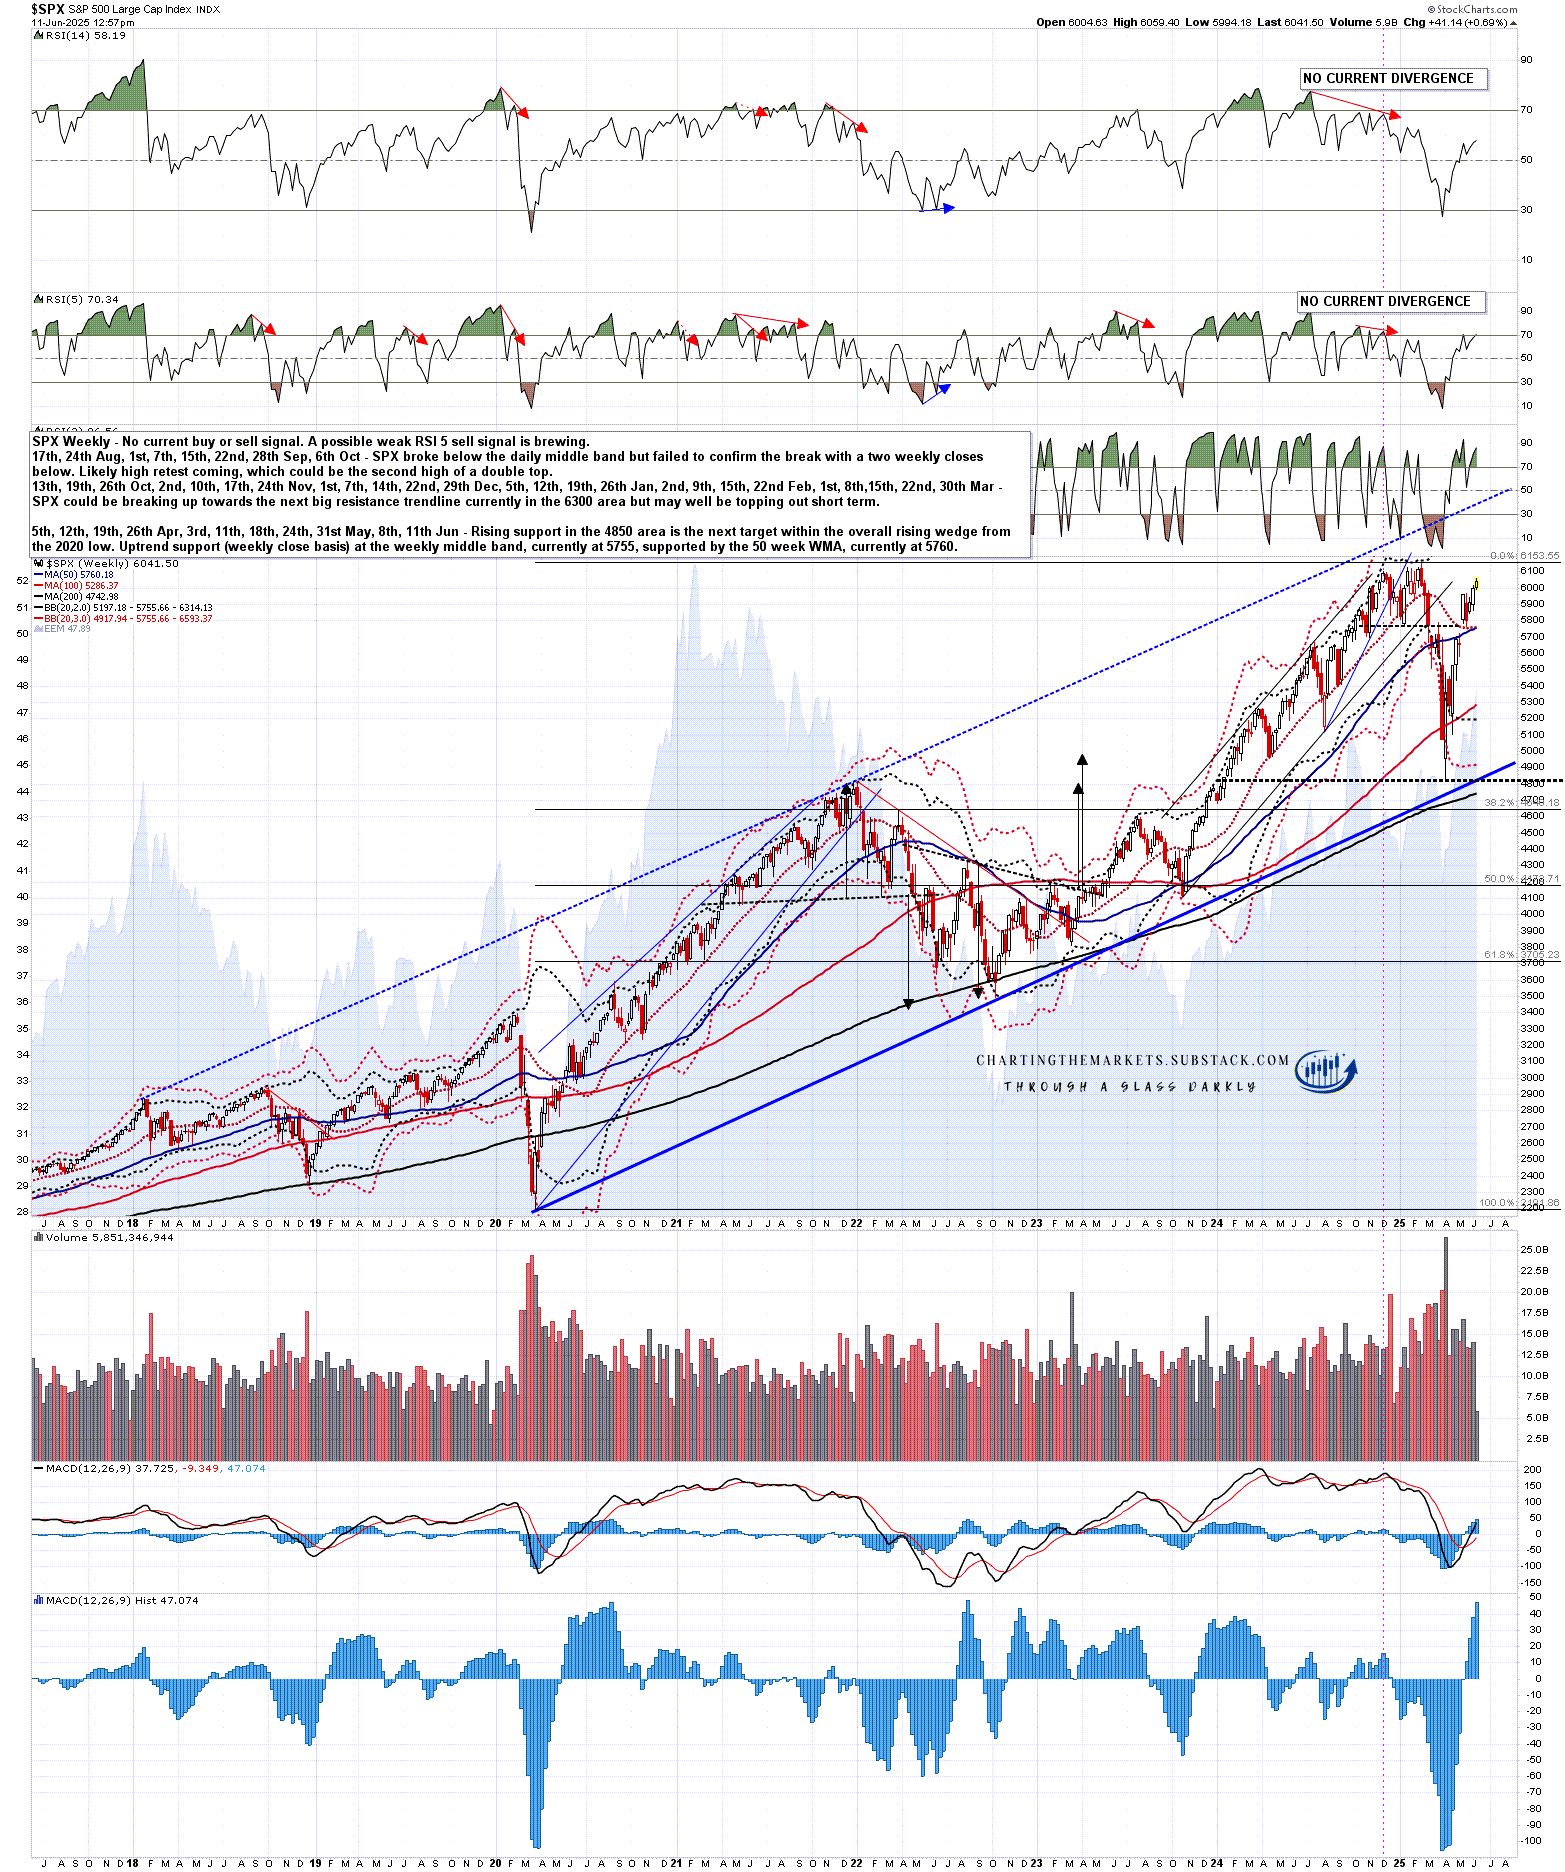
On the SPX weekly chart there is slightly lower double uptrend support at the weekly middle band, currently at 5755, supported by the 50 week MA, currently at 5760. On the bigger picture I am seeing the April low as possible double top or H&S neckline support.
Looking at the bigger picture I have a likely rising wedge from the 2020 low and the wedge resistance on that pattern is currently in the 6500 area. That trendline would in fact be the obvious next target within this overall pattern. If my IWM setup delivers then that trendline would likely be hit and we might see a bullish overthrow that goes above it.
SPX weekly chart:
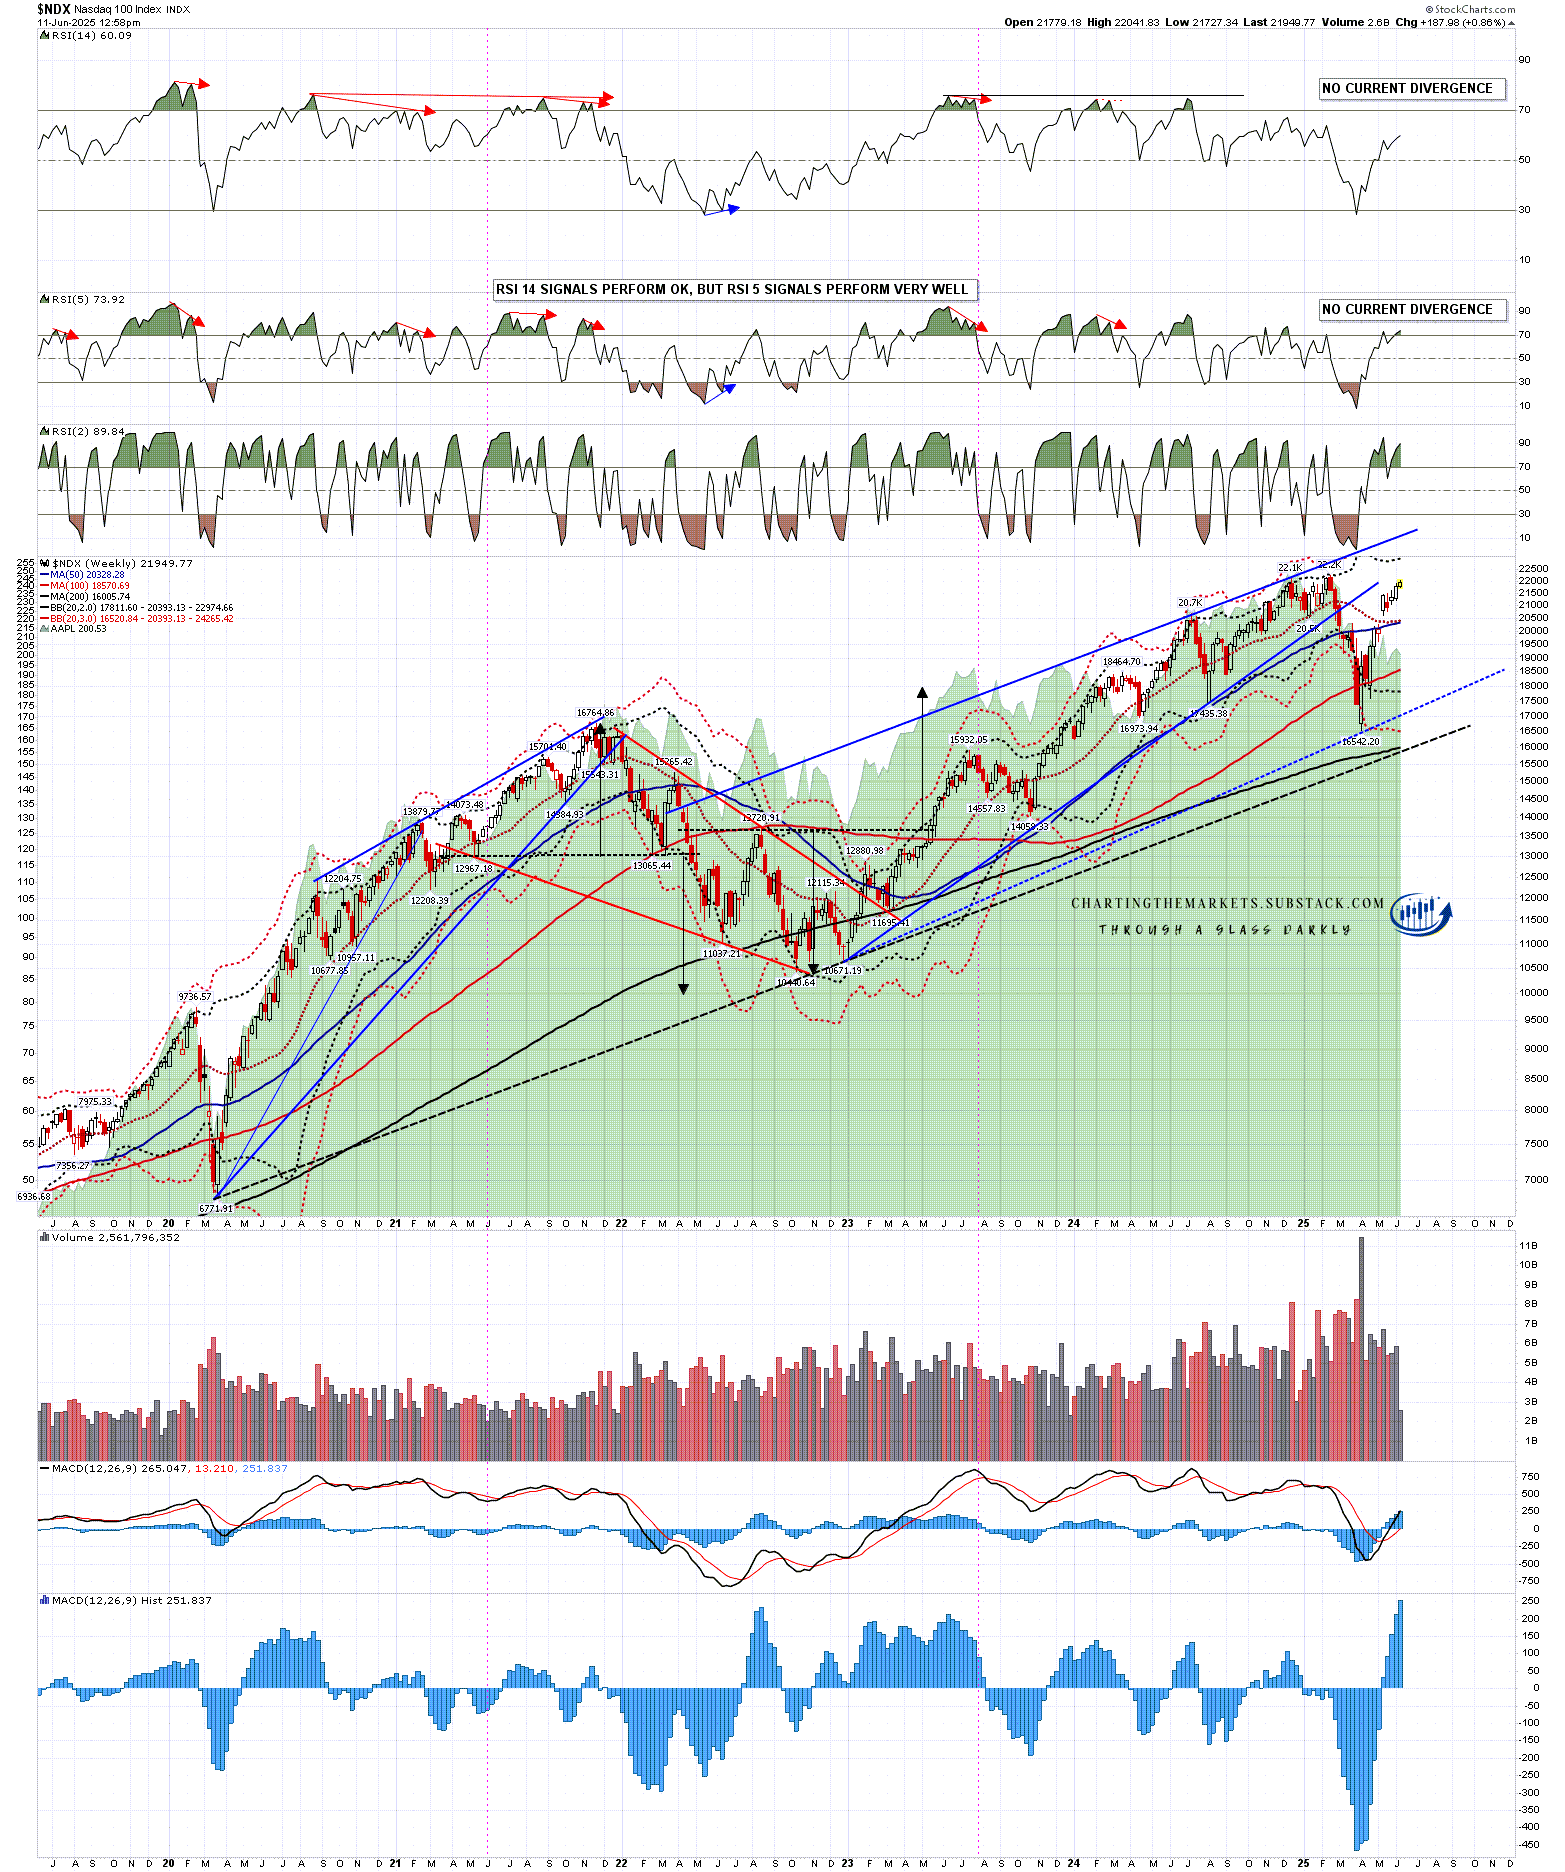
Looking at the NDX (index for the QQQ ETF) weekly chart I don’t have an obvious resistance trendline target from the 2020 low, but I do have a resistance trendline from the late 2022 lows and I have that in the 24,500 to 25,000 area. That would be the obvious target and, as with SPX, we might see a break above in a bearish overthrow.
NDX weekly chart:
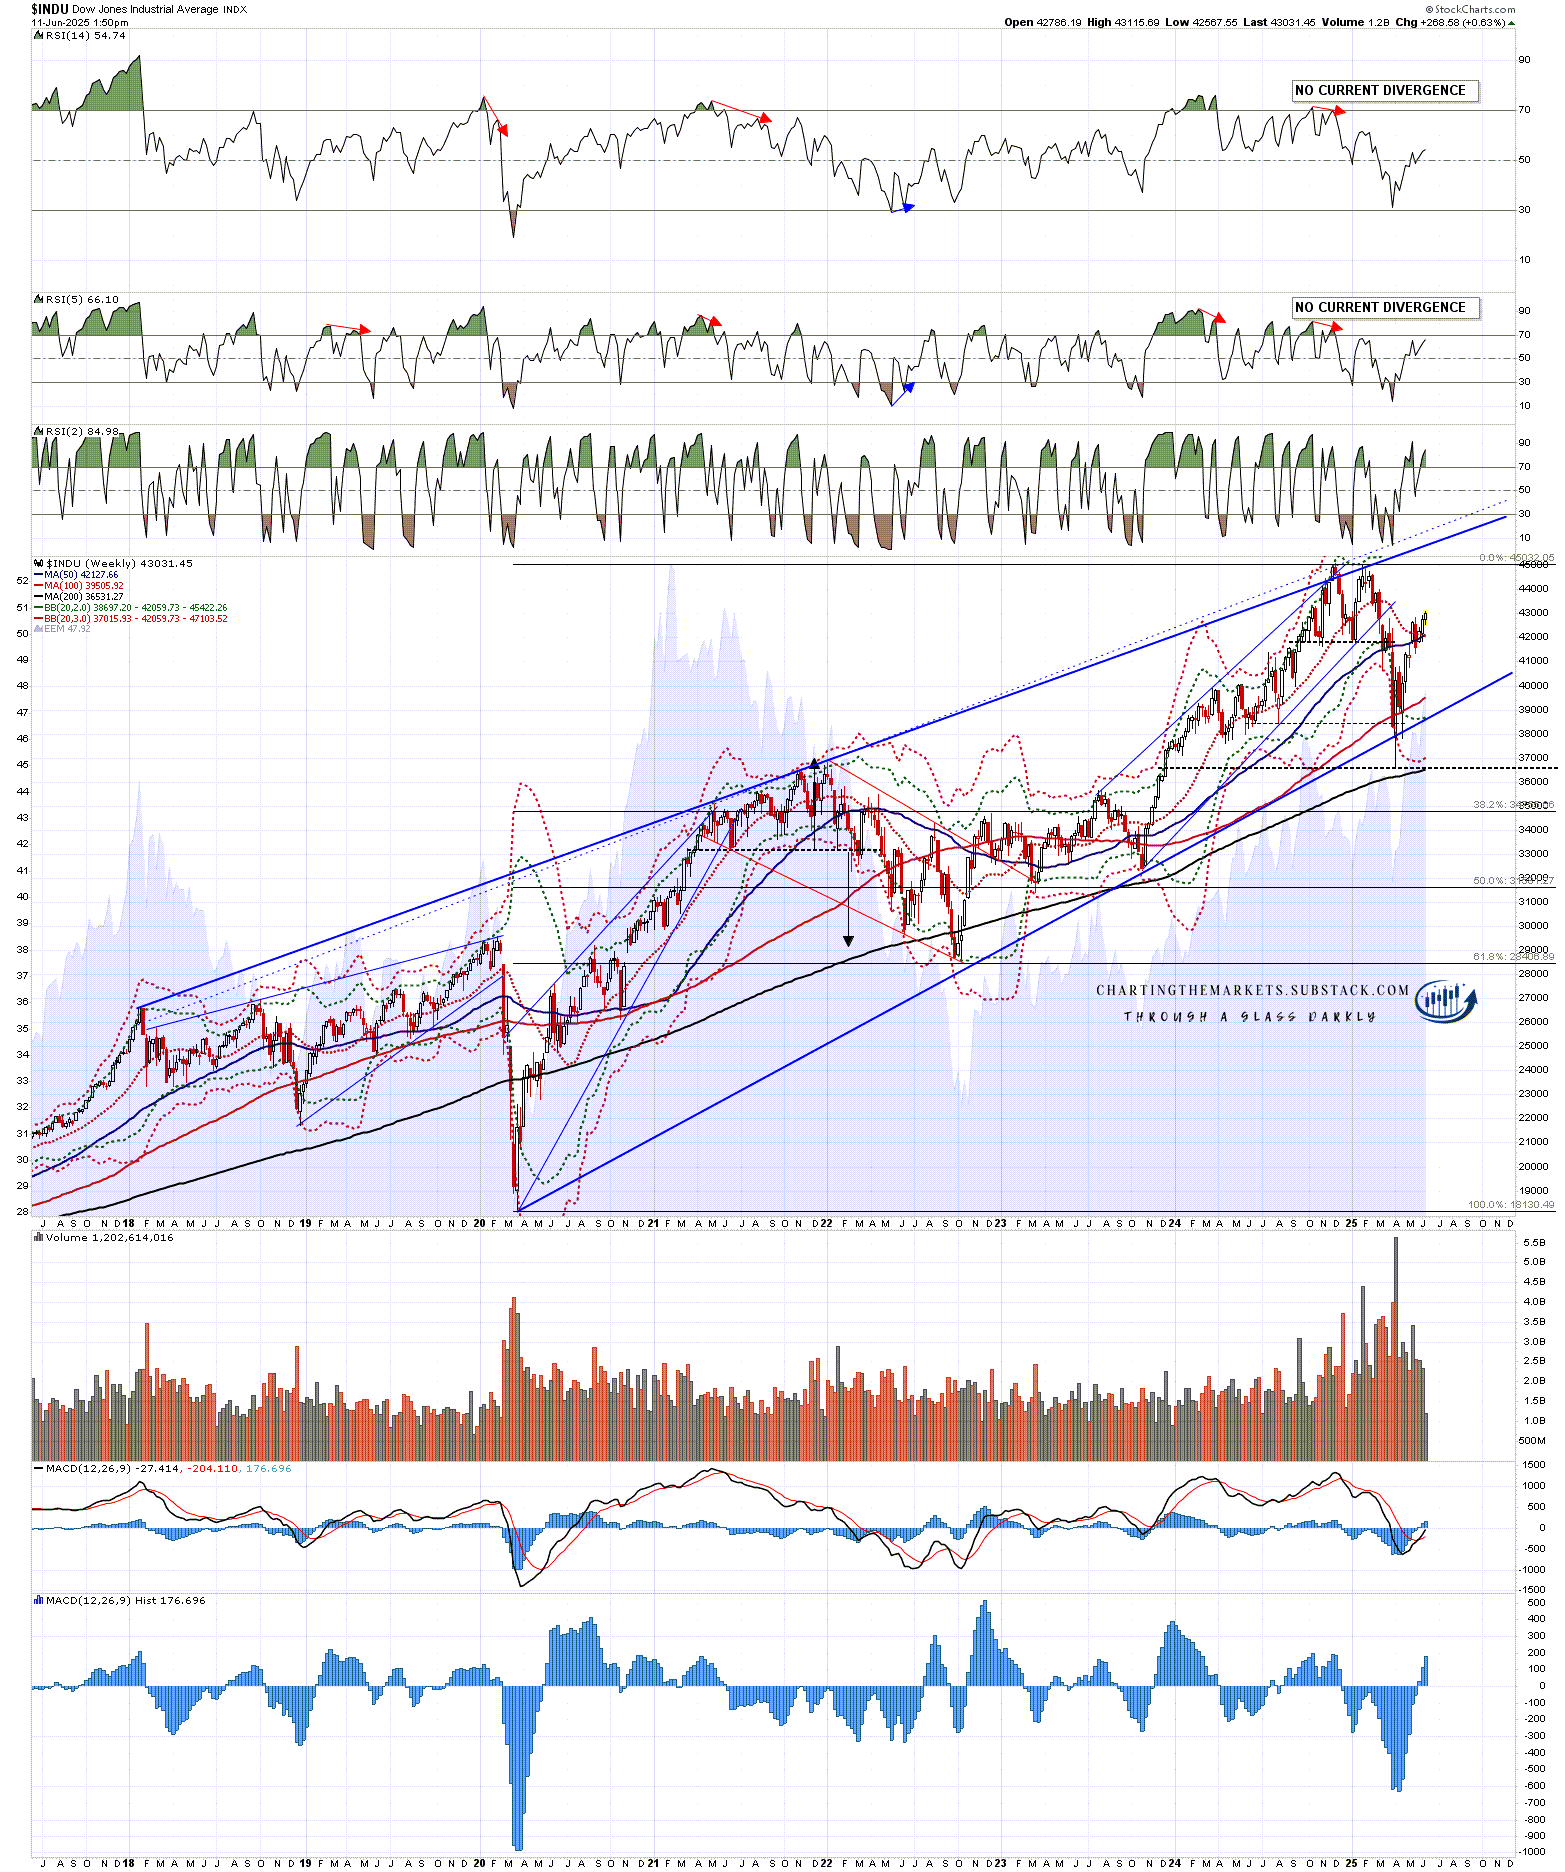
Looking at the INDU chart (index for the DIA ETF) I have a clear rising wedge from the 2020, but in this case wedge resistance has already overthrown and rising wedge support was broken in the move down into the April low. Here I’d ideally just be looking for a retest of the all time high and a fail. However the IWM bullish scenario might also push this over that target, in which case I’d be wondering whether the initial rising wedge might be expanding into a larger rising wedge. If so I have drawn in a possible alternate wedge resistance trendline currently in the 45500 area that would be the obvious target.
INDU weekly chart:
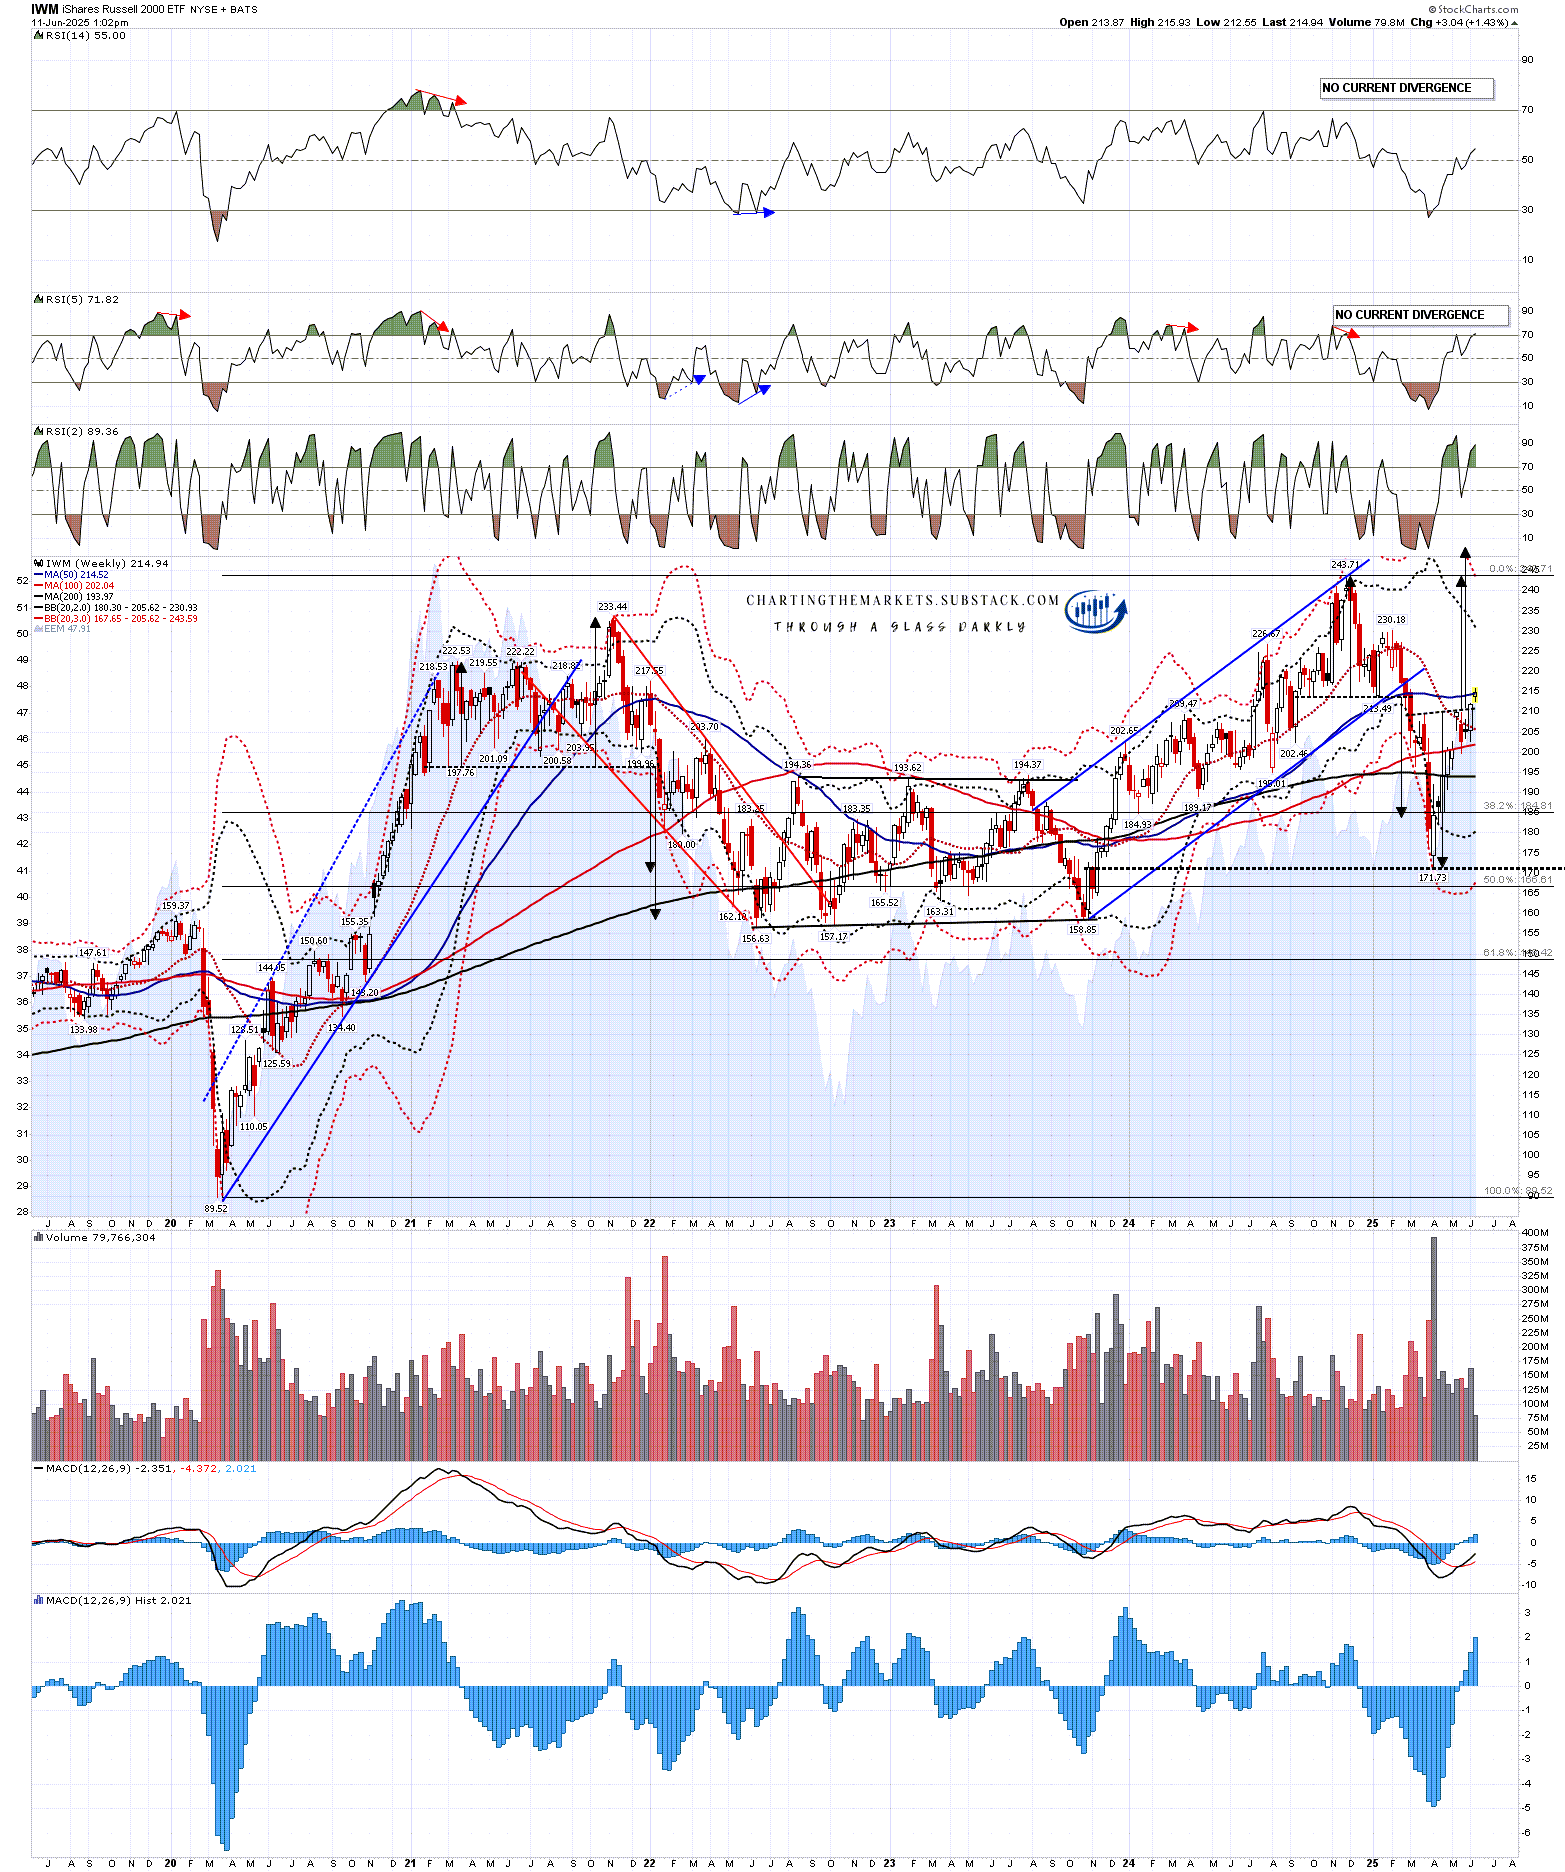
The IWM chart is very different to the other three, as IWM only managed to slightly beat the 2021 all time high in late 2024. IWM is the star of the current bull setup show here however as a high quality IHS has broken up with a minimum target at a retest of the all time high at 243.71, and a possible extension target in the 251 area. I’m not currently seeing any reason to think that this might deliver much more than a new all time high.
IWM weekly chart:
What is the thinking behind the post title above? Well I’ve had a few comments this year about my comments on US politics and economic policy and as a lifelong fiscal conservative and strongly classical leaning economist I must admit that I have not much cared for any US administration so far this millennium as I thought they were all very fiscally irresponsible. I remember being asked if I could think of anything complimentary to say about the Obama Administration back in about 2010 and I replied that Obama had a nice smile. If asked the same about the current Trump Administration I would reply that JD Vance has an impressive beard.
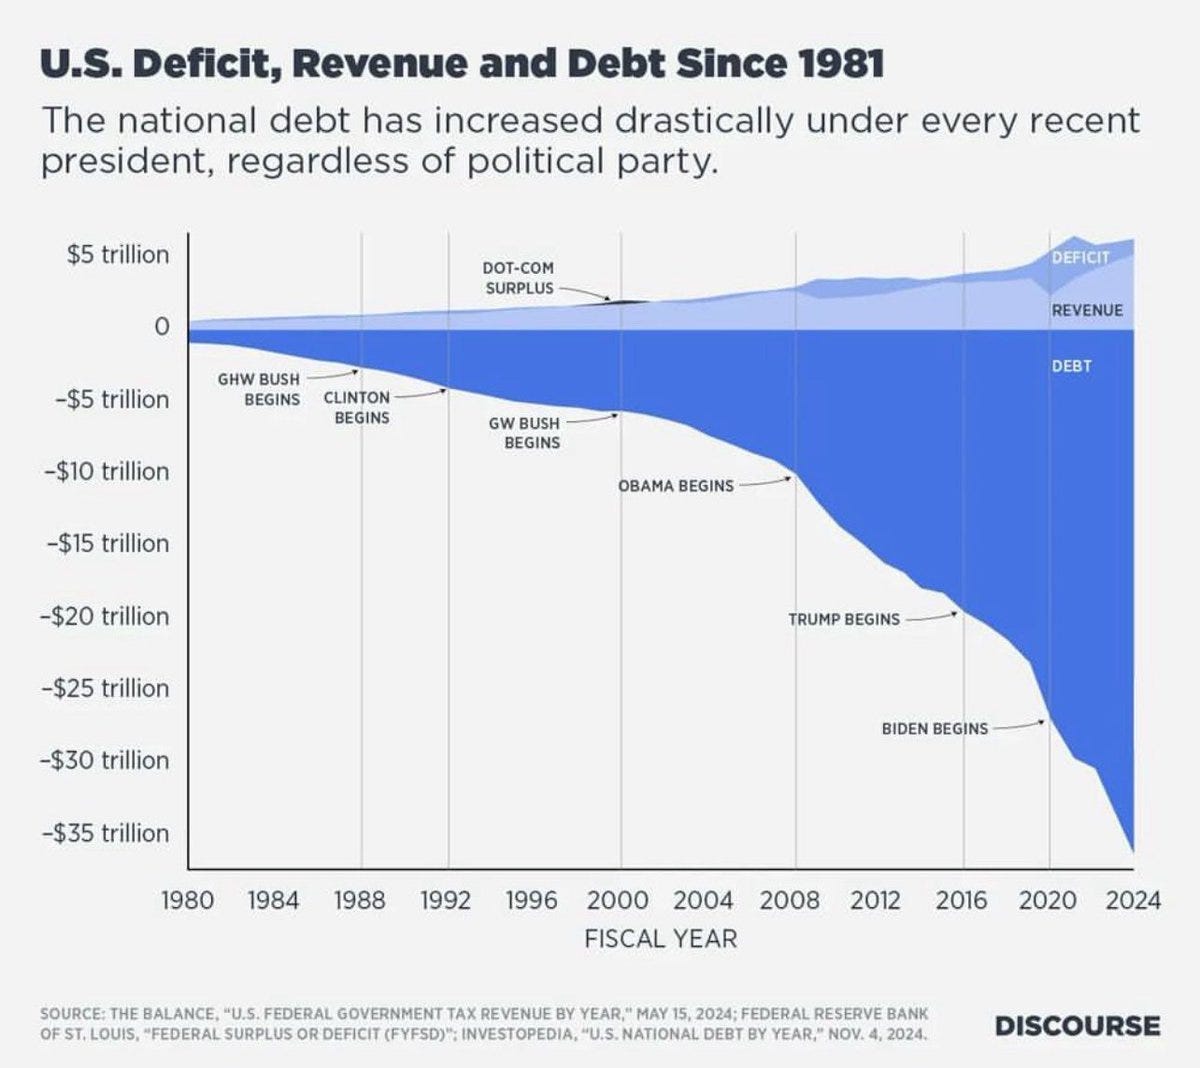
Why do I think that every US administration this millennium has been fiscally irresponsible? The chart below shows the reason for that very eloquently. Watching this entirely avoidable train wreck in slow motion over the last 25 years has been dispiriting, and has not improved my already low opinion of politicians generally.
I said in my last post that:
Does this mean that I think good things are happening under the surface in the US economy? Not at all, but I’ve noted before that changes in the economy, good and bad, tend to take a few months to feed through into the numbers. I’m seeing this as a misplaced optimism window in which we could see new all time highs that might make a last major bull market high, and set up possible large topping patterns that might then play out over the next year or two.
That remains the case so in the absence of any major policy changes by the current Administration I’m thinking that the months and perhaps years after the next big high is made, likely in the next few weeks, may well deliver very impressive bear markets on both US equity and bond markets. We’ll see.
I’ve been saying the following on all my posts so far this year:
As I have been since the start of 2025 I’m still leaning on the bigger picture towards a weak first half of 2025 and new all time highs later in the year, very possibly as a topping process for a much more significant high. One way or another I think we’ll be seeing lower soon and I’m not expecting this to be a good year for US equities, not least because both of the last two years have been banner years for US equities. A third straight year of these kinds of gains looks like a big stretch. I could of course however be mistaken.
If you like my analysis and would like to see more, please take a free subscription at my chartingthemarkets substack, where I publish these posts first. I also do a premarket video every day on equity indices, bonds, currencies, energies, precious commodities and other commodities at 8.45am EST, but only for paying subscribers. Other places to find me are my twitter, and my Youtube channel.
No comments:
Post a Comment