
In my last posts on In Monday 12th May and Thursday 22nd May I was looking at the possible setup for a retracement on Crypto that might then set up a substantial bull run on Crypto after that retracement was complete. That retracement is not yet necessarily complete, but I think it may well be, so today I want to look at that retracement, explain why I think that may be ending a bit early, and look at the large bullish IHS patterns forming on Solana (SOLUSD) and Ethereum (ETHUSD) that may deliver major high retests on both while Bitcoin (BTCUSD) makes substantial new all time highs.
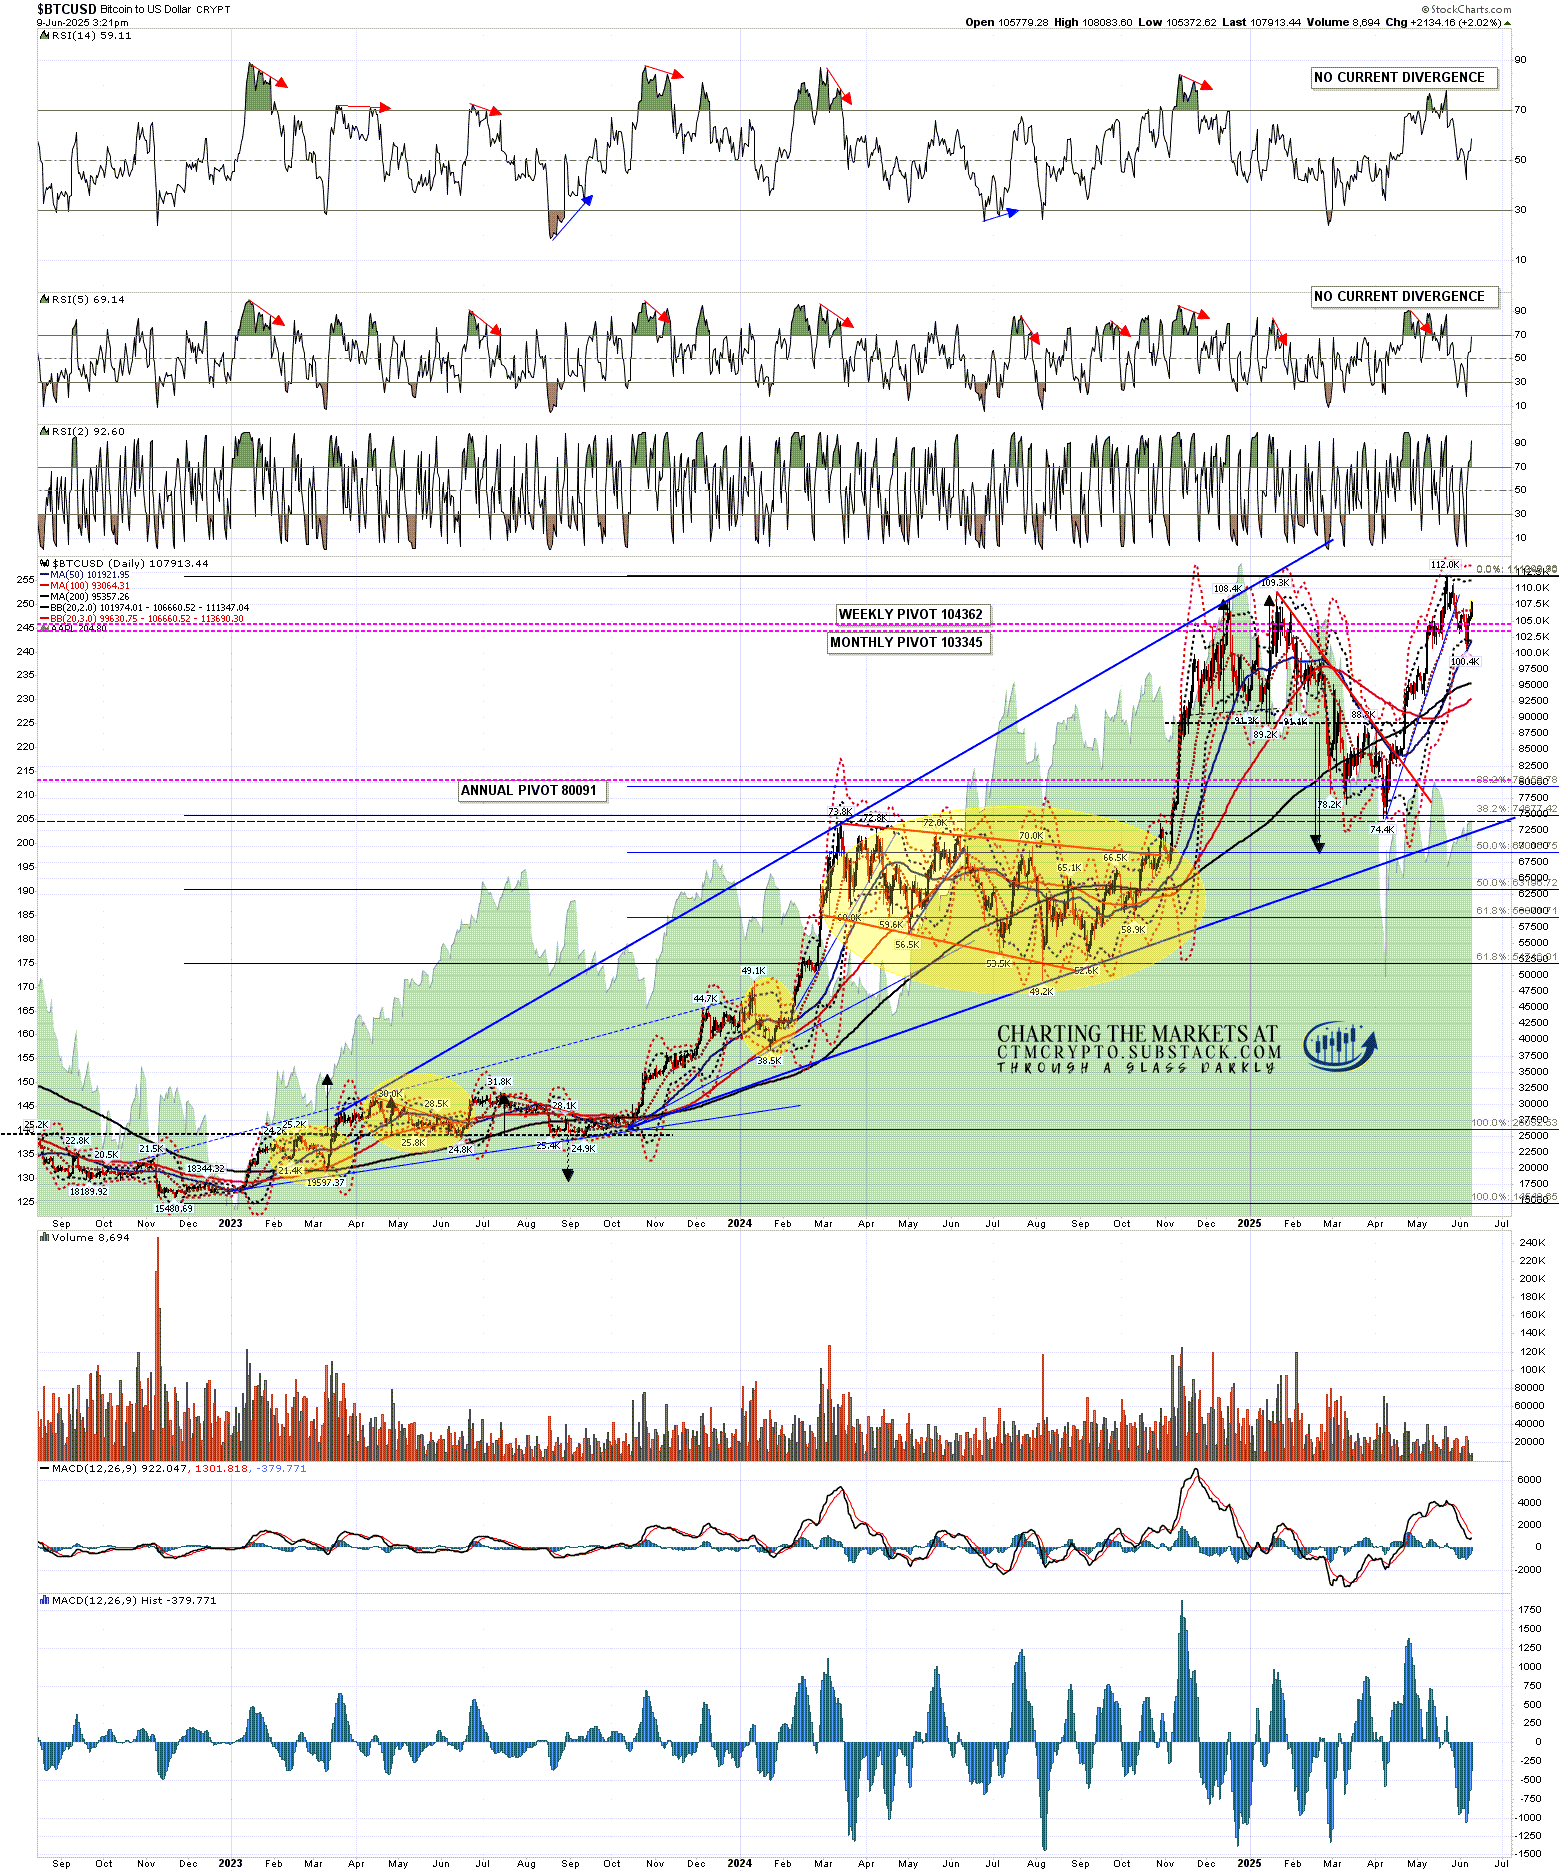
Looking at the daily chart Bitcoin broke below the daily middle band into a test of the lower band, the 50dma and the 100k level. They held as support and Bitcoin is trying to break back over the daily middle band. The daily RSI 5 sell signal reached the full target. If the daily middle band is successfully converted back to support then this retracement is likely complete.
BTCUSD daily chart:
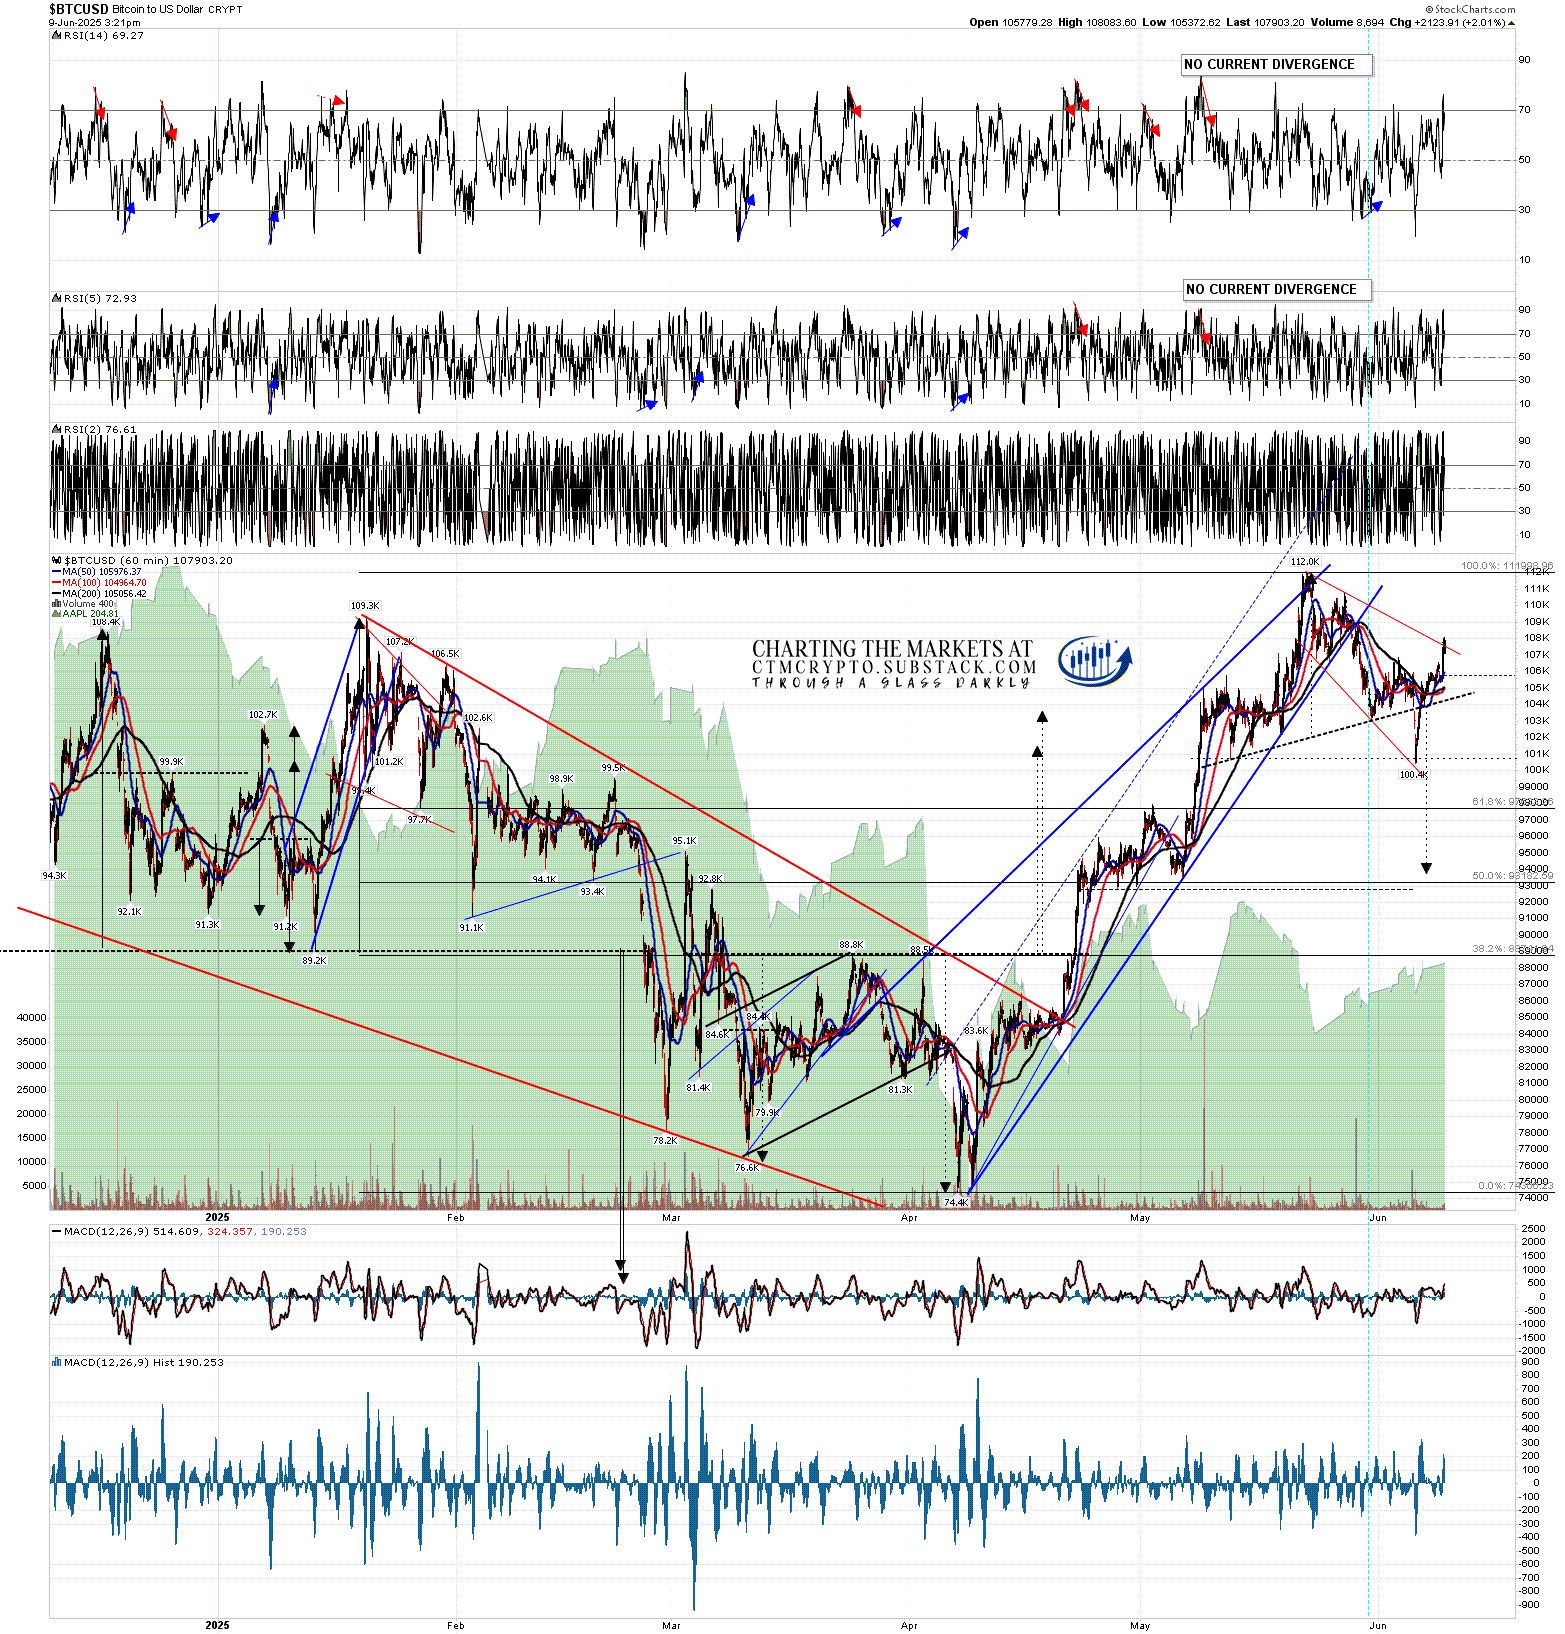
On the hourly chart a decent quality H&S formed and broke down with a target in the 93750 area. I was doubtful on my daily premarket videos about that making target and that failed last night as Bitcoin broke back over declining resistance from the all time high. The next obvious target is a retest of that all time high.
BTCUSD 60min chart:
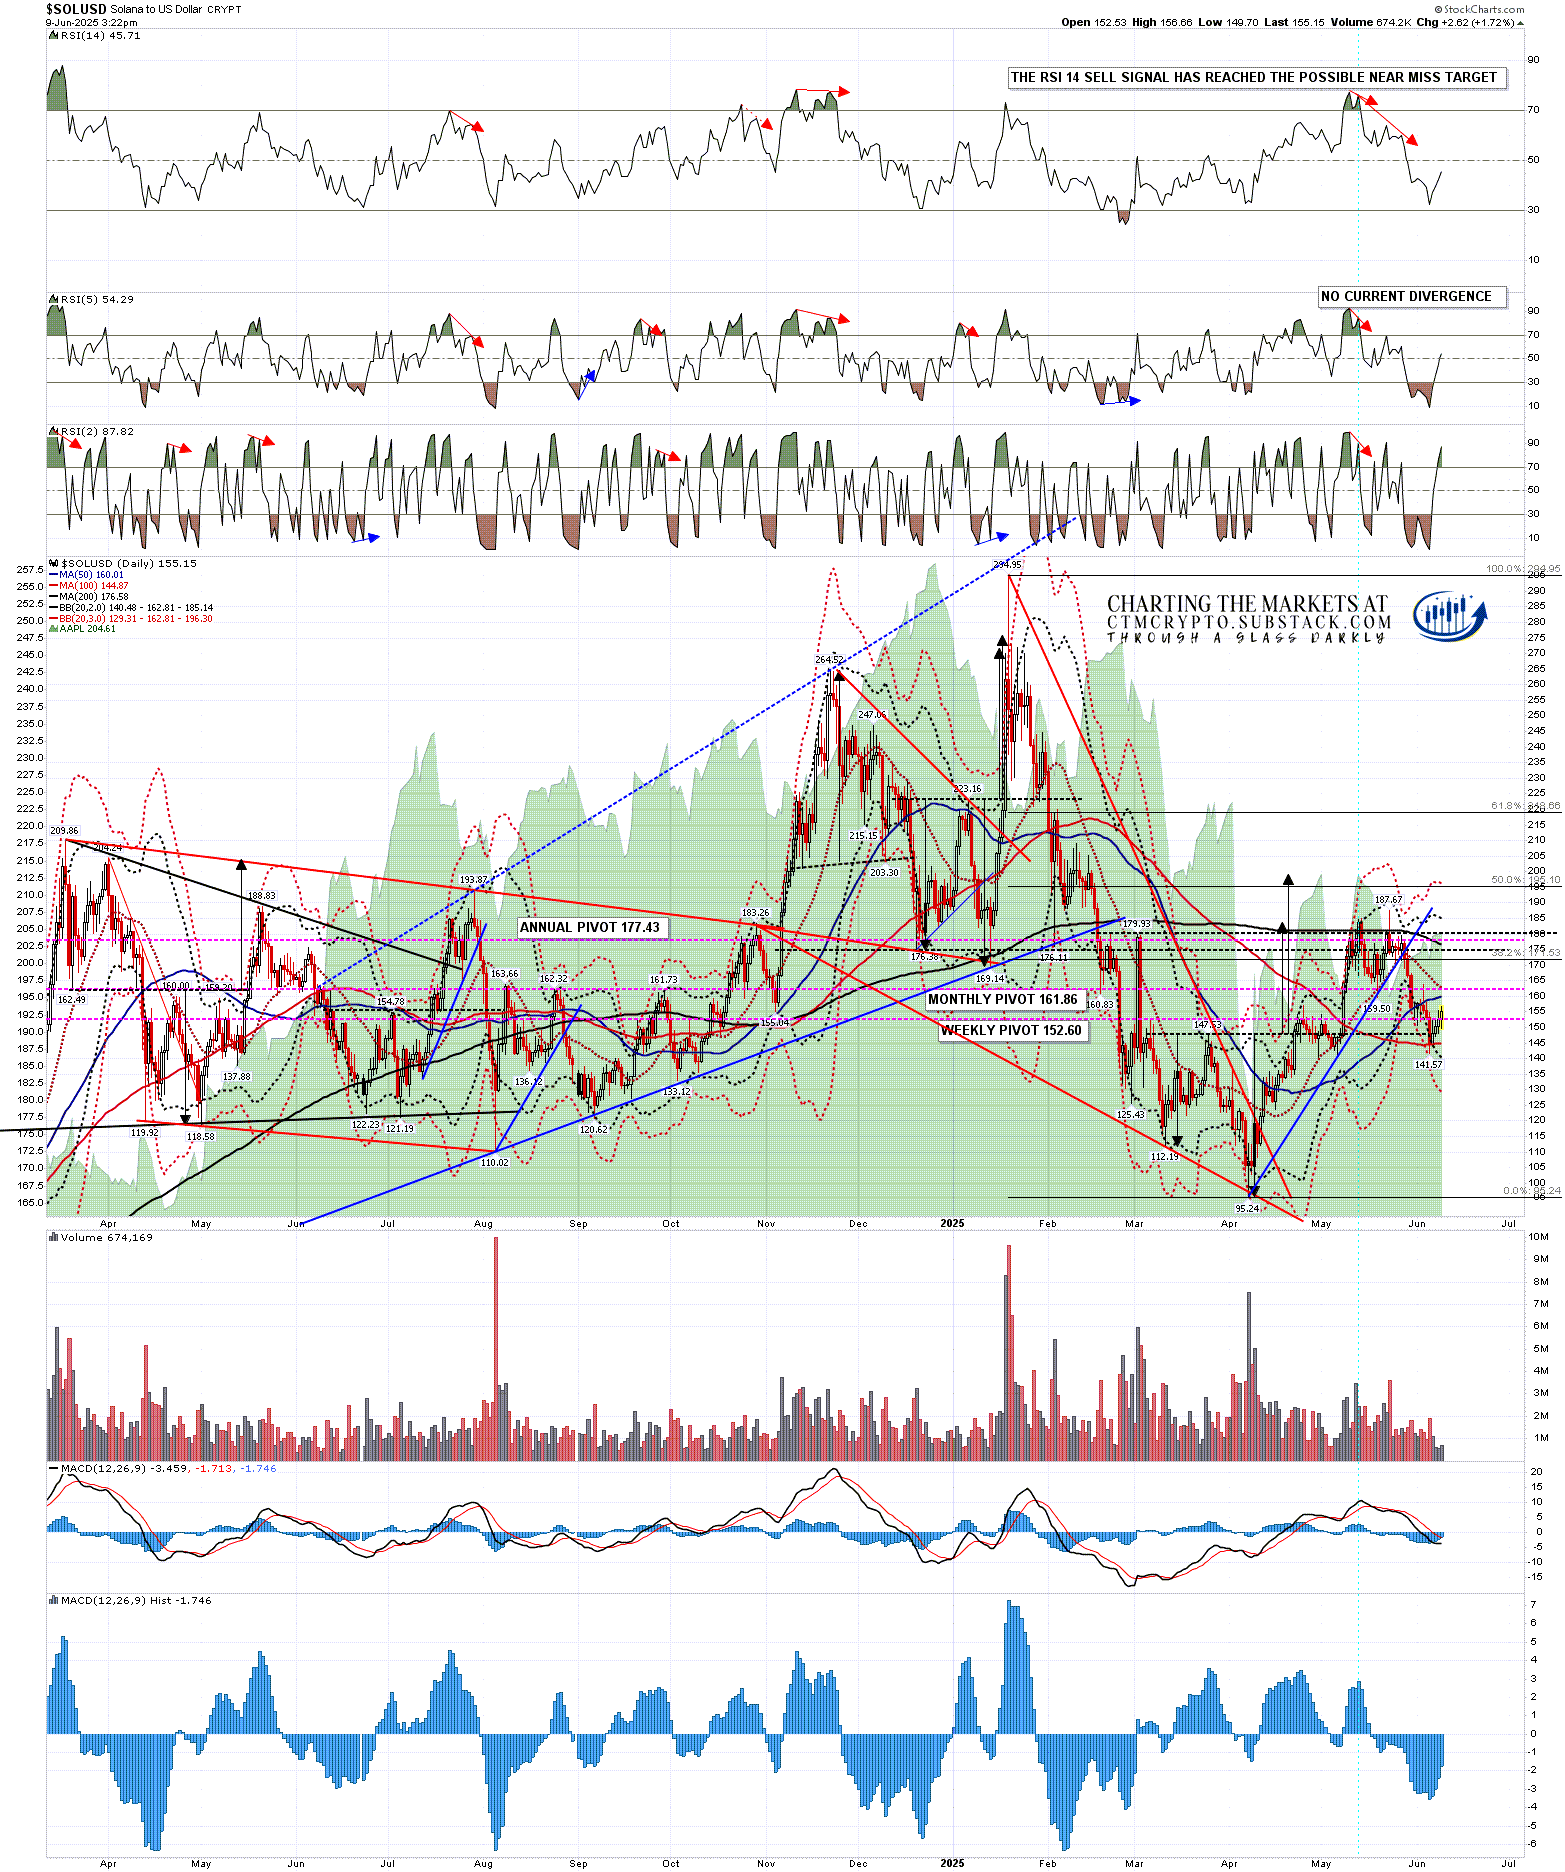
On the daily chart Solana broke back below the daily middle band, then the 50dma, and went on a seven day daily lower band ride which ended on Saturday. The daily RSI 14 sell signal has reached the possible near miss target and the weak RSI 5 sell signal reached the full target. Resistance above is at the 50dma, currently at 160.02, and the daily middle band, currently at 162.82. A solid break back over both should confirm that this retracement is over.
Solana would still need to break and convert main resistance at the 200dma, currently at 176.58, which held as resistance twice in May. A break over that is a break over the last serious resistance blocking a strong move higher.
SOLUSD daily chart:
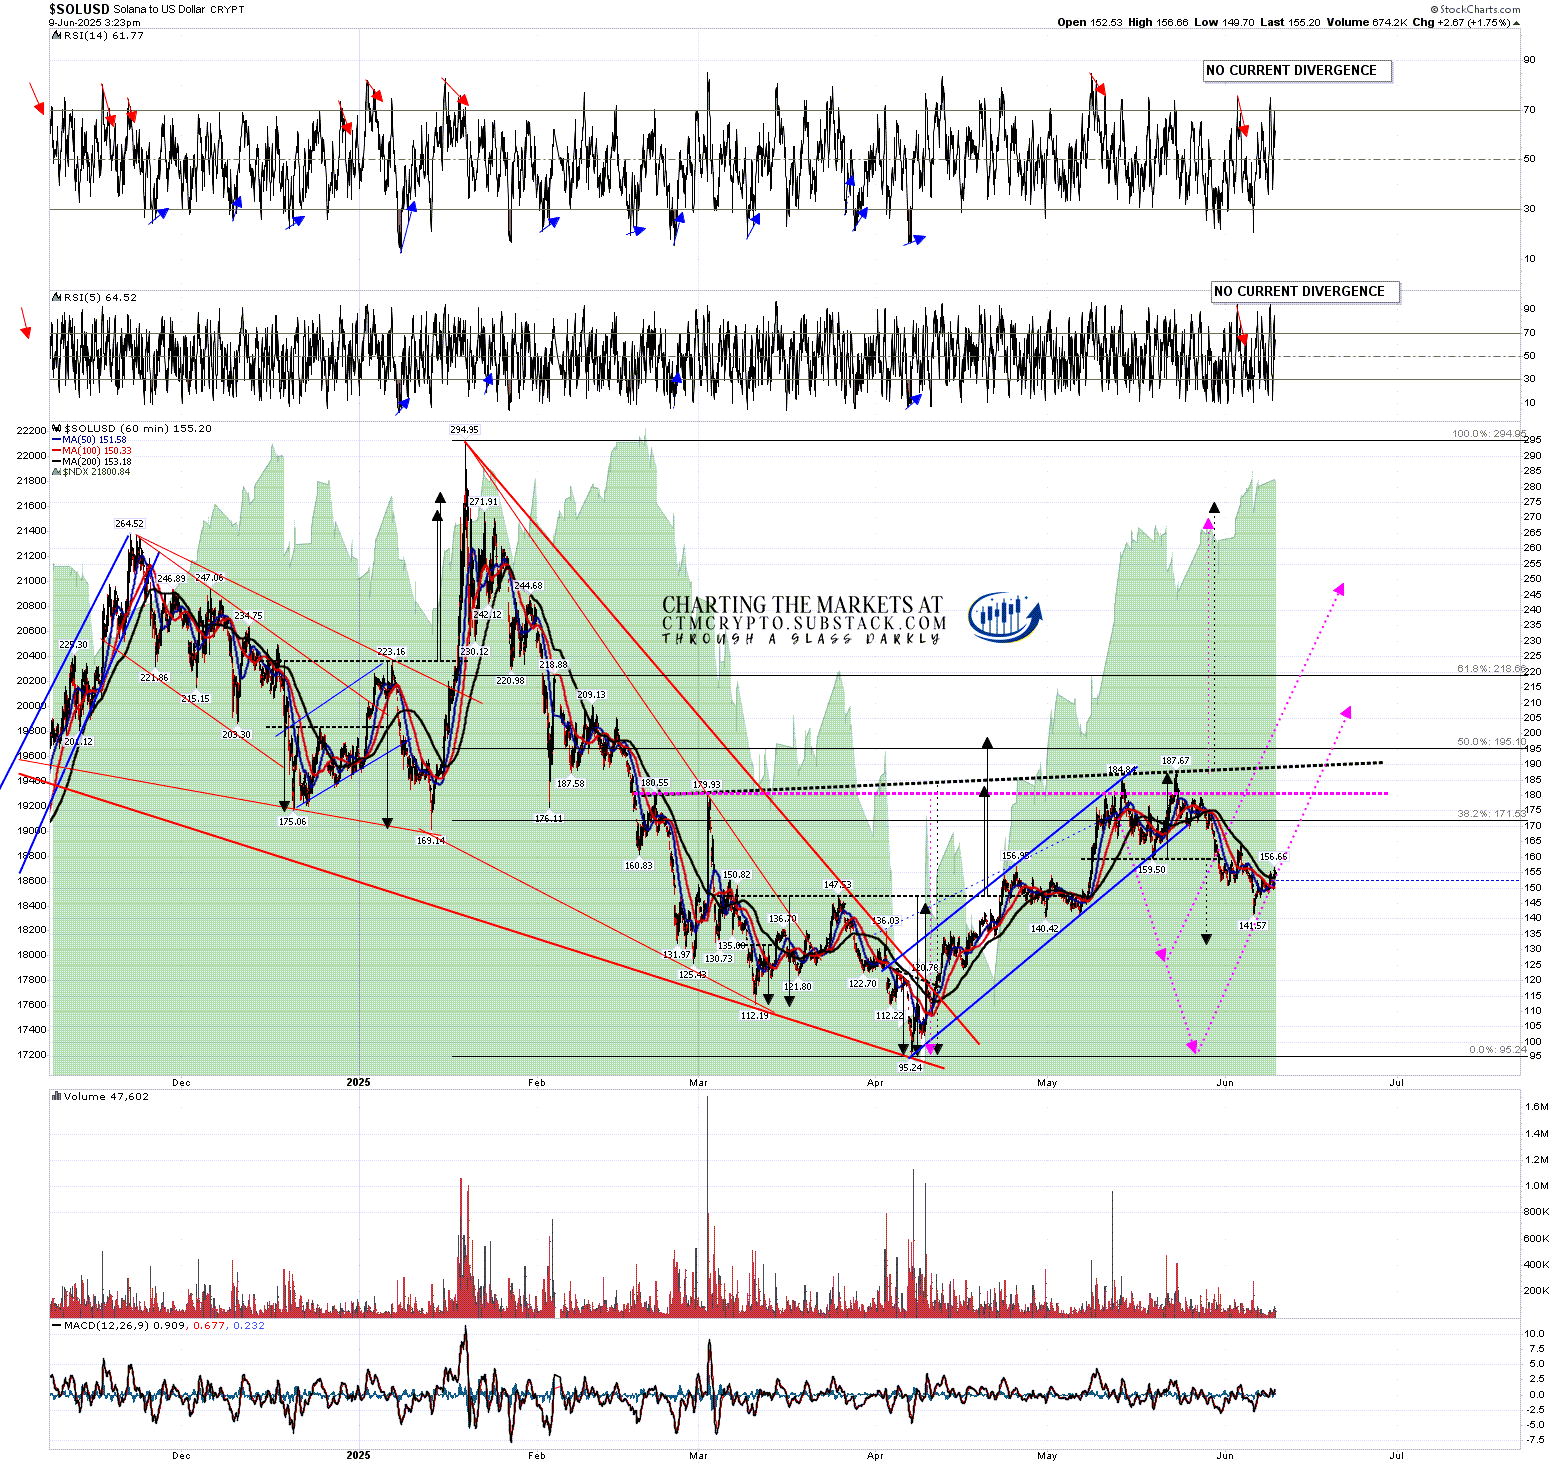
On the hourly chart a high quality double top broke down with a target in the 131-4 area and the retracement has reached 141.57 so far. That could be it, with the pattern next failing back into a retest of the May high at 187.67.
Back on 12th May I drew in a possible IHS right shoulder that I was thinking might form, and I have left in the arrows I drew then. What we have seen since makes an acceptable right shoulder and if Solana heads a bit lower then that would also be ok as long as Solana respects the March low at 112.19. The next obvious step in this sequence would be to return to the IHS neckline, currently in the 190 area.
On a sustained break over 190, the IHS target would be in the 270-5 area, and would likely run further to retest the all time high at 294.95.
SOLUSD 60min chart:
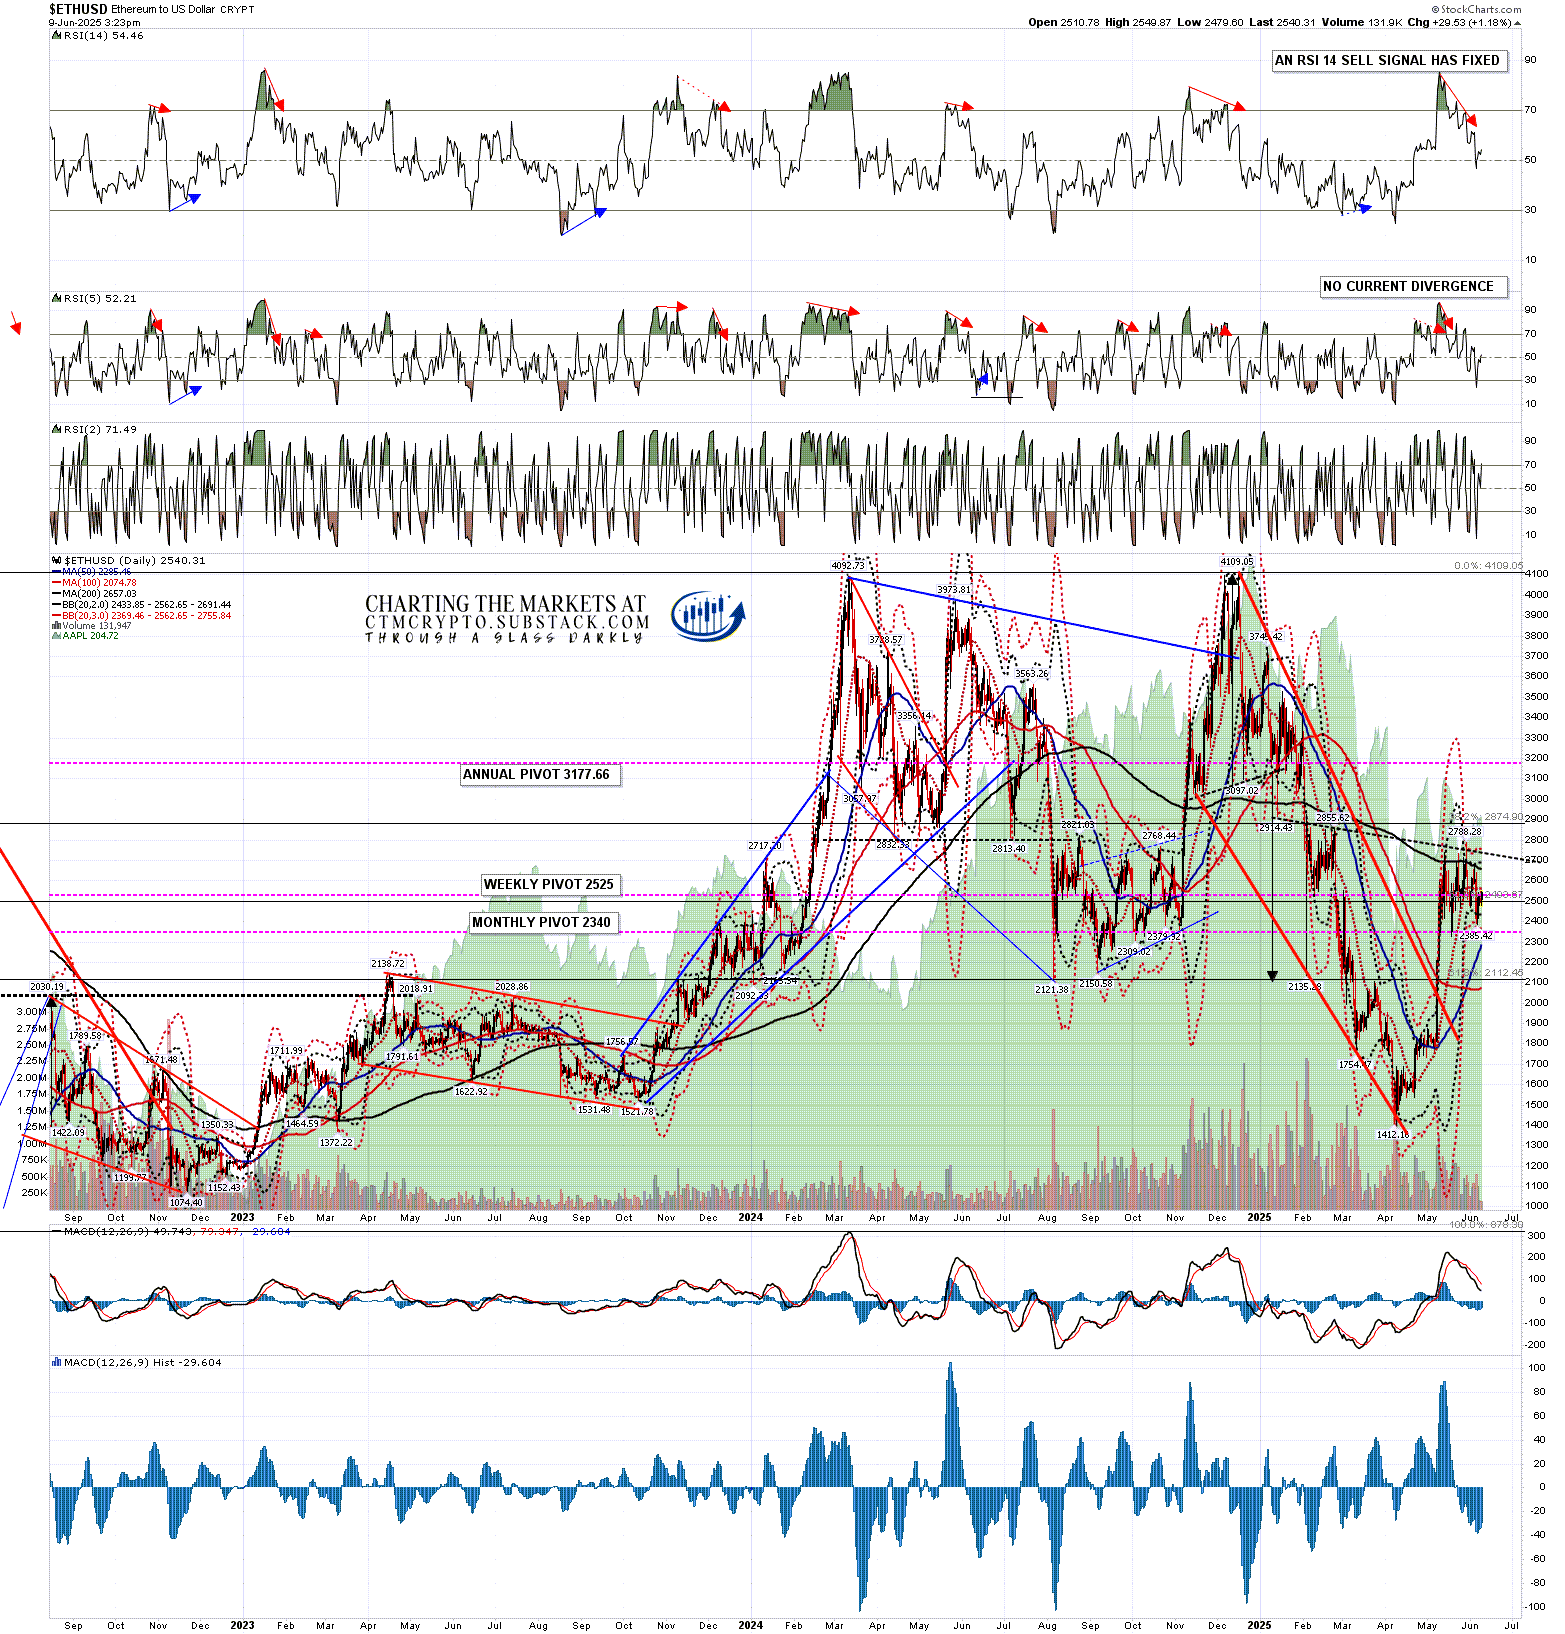
Ethereum saw a more modest retracement than the one on Solana, though it did briefly test the daily 3sd lower band on the currently very compressed daily bands. A full daily RSI 14 and a weak daily RSI 5 sell signal fixed and the RSI 5 sell signal has reached target. I am doubtful about the daily RSI 14 sell signal making target on this retracement though it may do later from a higher level.
Ethereum has failed at the 200dma, currently at 2657, four times since the start of May and that needs to be broken to open the upside, as is also the case with Solana.
ETHUSD daily chart:
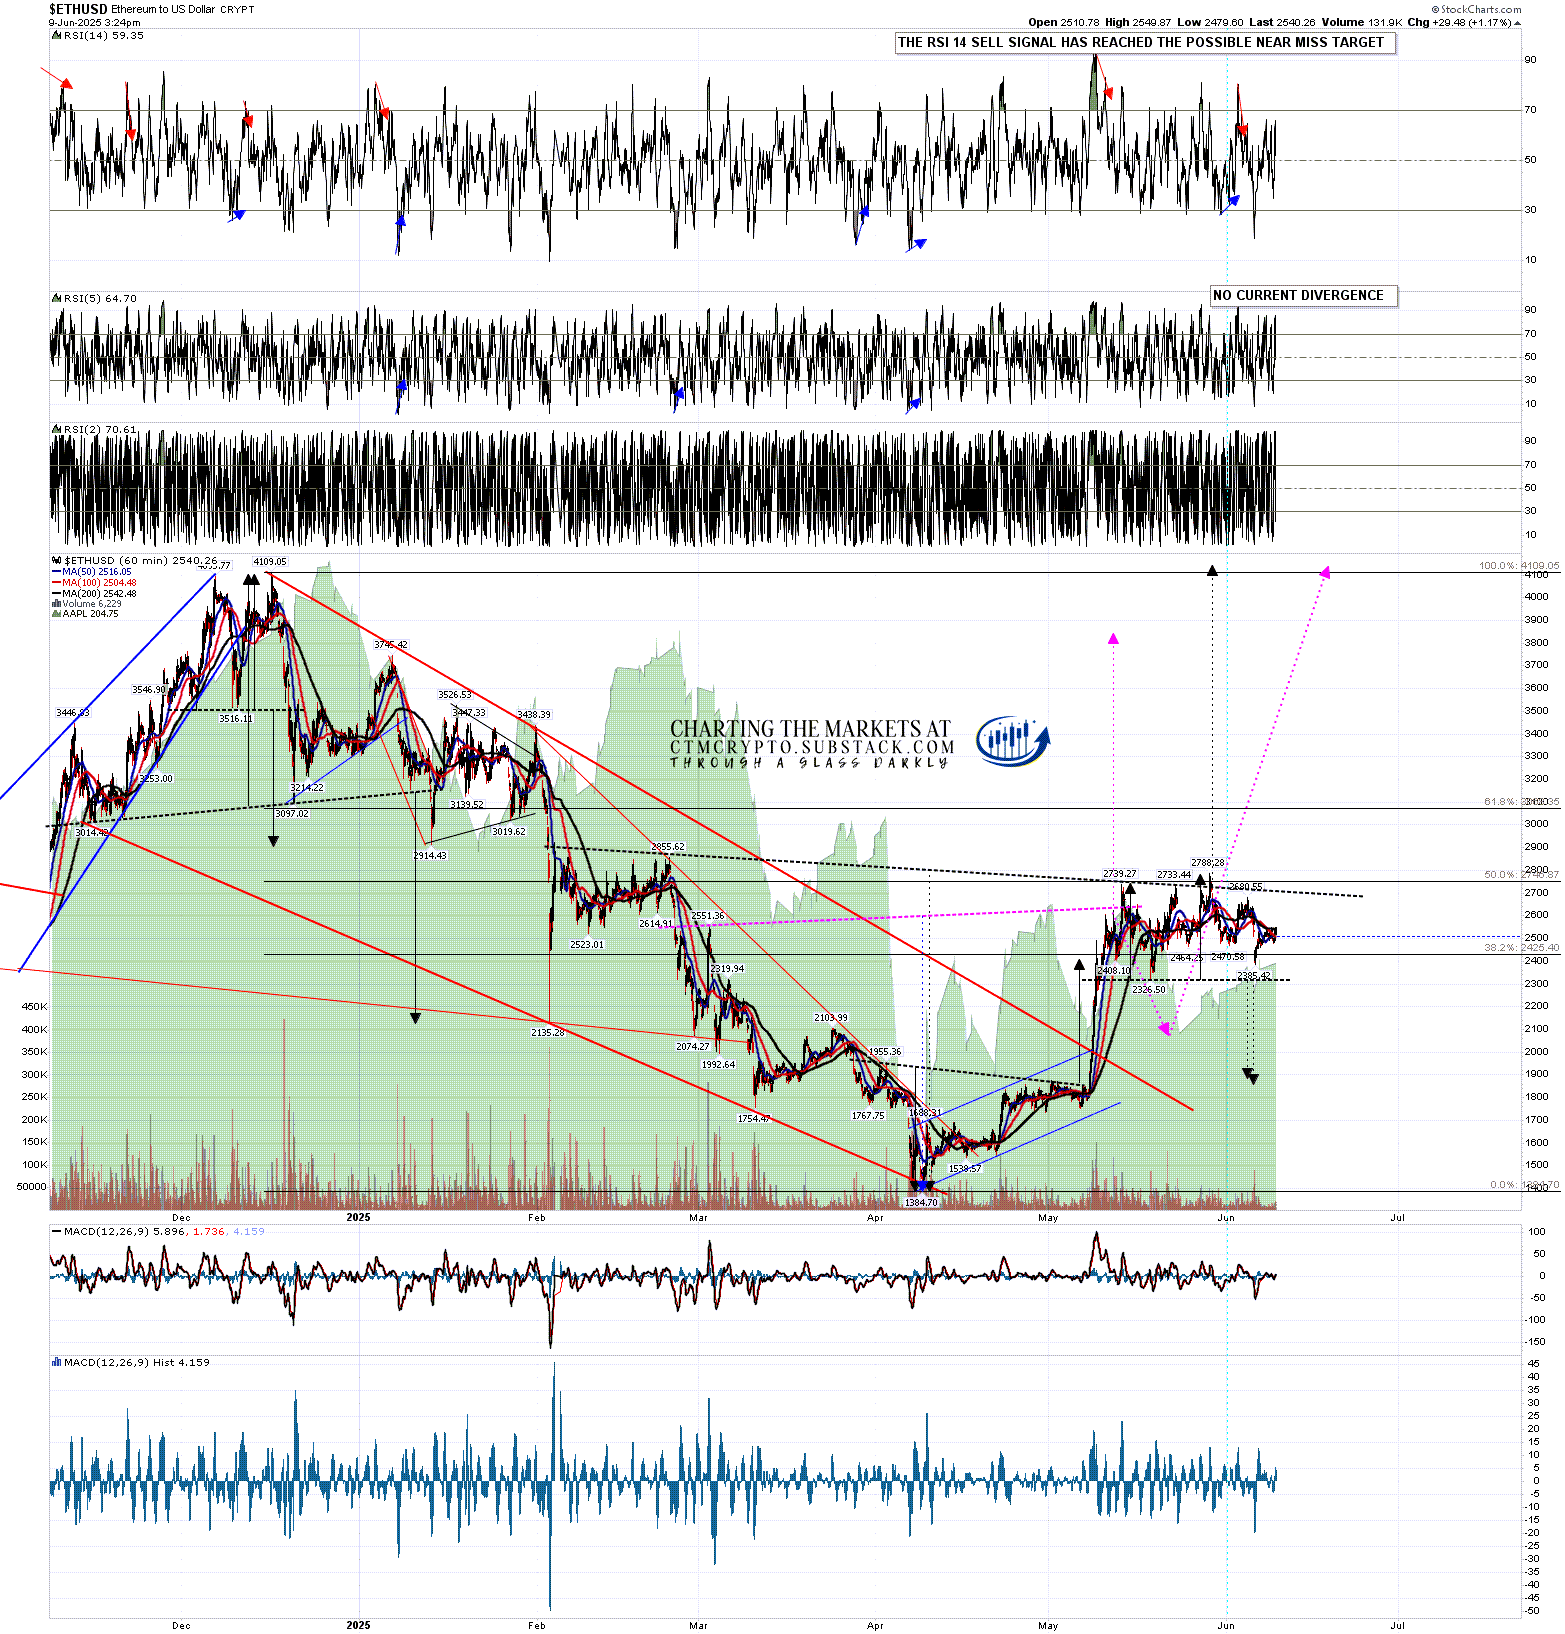
On the hourly chart on 12th May I also drew in a possible path to form a large IHS right shoulder, and have left that on the chart. A modest but acceptable right shoulder has formed.
A small double top setup formed but never broke down, and at this point I’m not expecting it to do so.
This IHS has arguably already broken up with a target at a retest of the December high at 4109.05, and that would be my preferred draw at this point. A sustained break back over the may high at 2788.28 Looks for that retest.
ETHUSD 60min chart:
So what are the takeaways here? The bull market in Crypto demonstrably didn’t end in January and likely isn’t ending here either. There is a strong bullish setup in place that may support a big move up in all three of these instruments overall in the next few months.
I have mentioned in posts regularly this year that Crypto may decouple from equity prices this year as trouble grows in the US Treasuries markets, and Crypto becomes more attractive as a flight to safety destination. This may mean that a bull move on Crypto could take place without a corresponding move on equity markets, but that might not be necessary, as I have a decent looking bullish setup on US equity indices here as well.
So far this year I have been and am still leaning towards seeing weakness in the first half of the year and renewed strength in the second half of 2025, with a very possible bull market high on Crypto pencilled in close to the end of the year. That scenario would be a good match with past Crypto bull markets. Is it possible that I am mistaken? Always, but we can only ever try to identify the higher probability paths in the future. Only time can show us the path that is actually taken. Still, I’m with Confucious who said ‘study the past, if you would divine the future’. - 22nd May 2025 - IDEALLY THE PATH FROM HERE TAKES CRYPTO INTO A BULL MARKET HIGH IN OR CLOSE TO DECEMBER 2025
If you’d like to see more of these posts and the other Crypto videos and information I post, please subscribe for free to my Crypto substack. I also do a premarket video every day on Crypto at 9.05am EST. If you’d like to see those I post the links every morning on my twitter, and the videos are posted shortly afterwards on my Youtube channel.
I'm also to be found at Arion Partners, though as a student rather than as a teacher. I've been charting Crypto for some years now, but am learning to trade and invest in them directly, and Arion Partners are my guide around a space that might reasonably be compared to the Wild West in one of their rougher years.

No comments:
Post a Comment