
Back in my post on Friday 16th May I was looking at the daily RSI 5 spike over 90 on SPX and noted that:
‘From here this means that SPX likely at least consolidates without going much higher for two weeks and then we could see a larger retracement but without any strong expectation of a big decline. I am wondering though about a possible backtest of the 200dma, currently in the 5760 area.‘
It has been two weeks since then and we’ve seen that consolidation with a low at the backtest of the 200dma. Is there anything obviously bearish about this consolidation? Not yet, and I am still looking for likely retests of the all time highs on SPX and QQQ, and perhaps also on DIA and IWM, though I’m still thinking that an equities moonshot through the rest of the year seems unlikely.
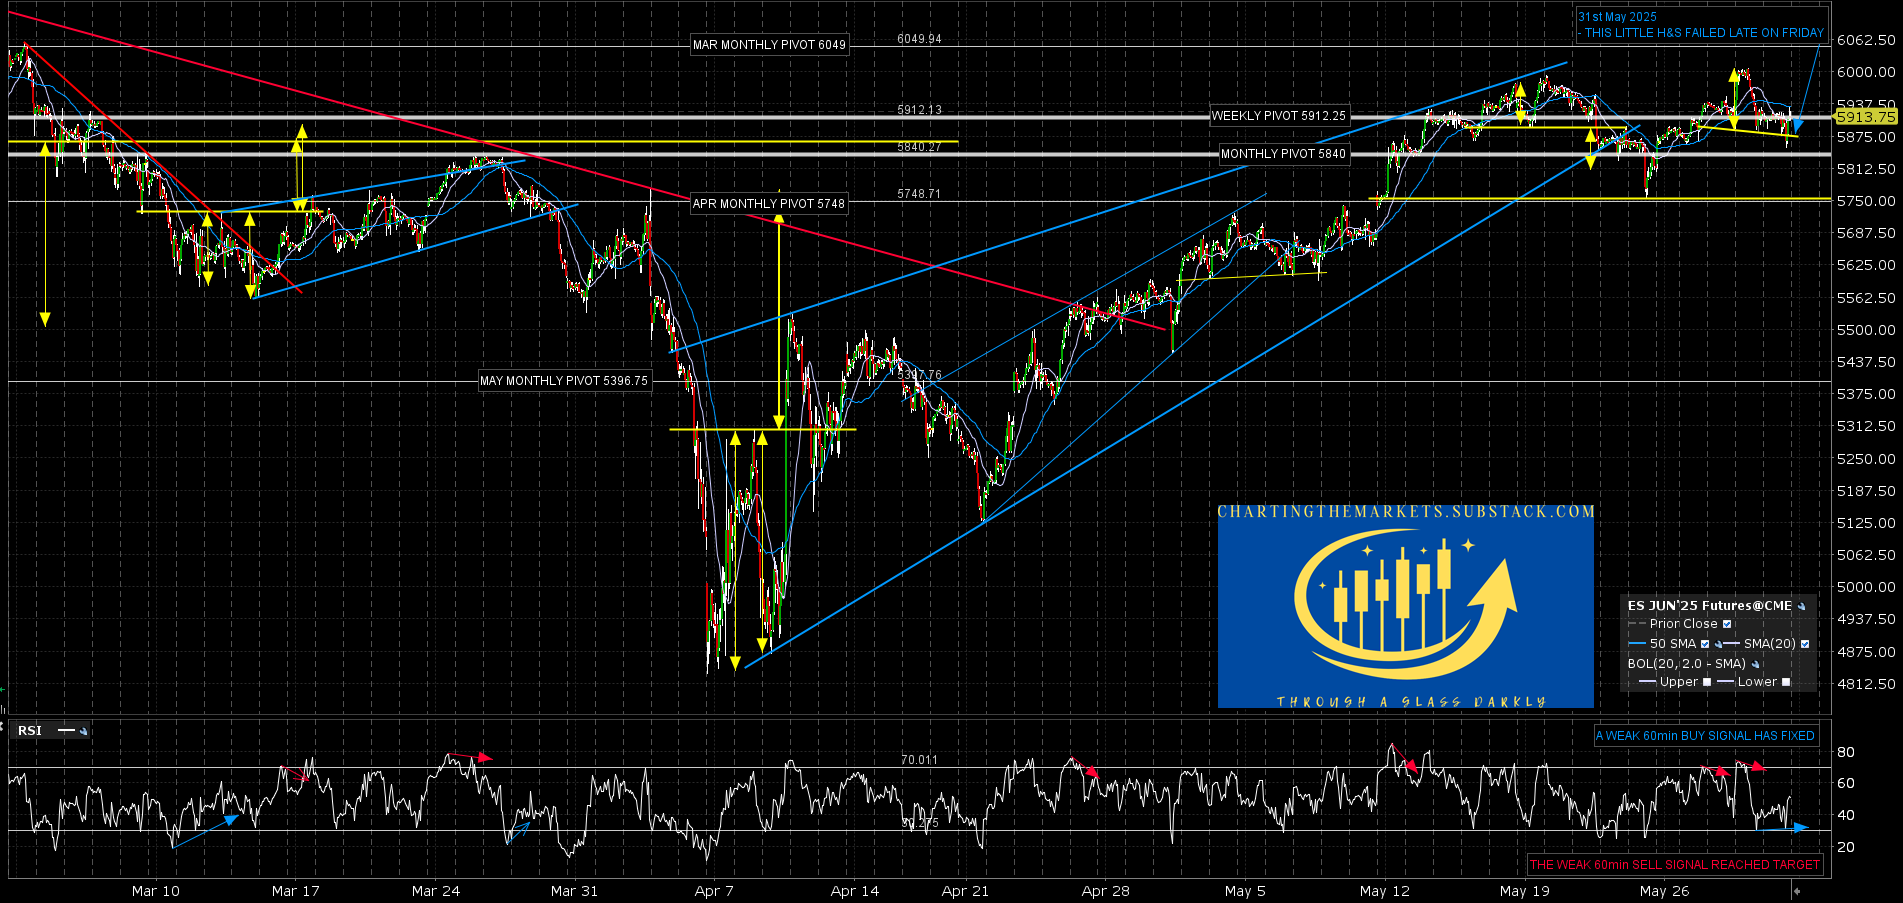
In my premarket video for paying subscribers on Friday morning I was looking at an interesting setup on ES and NQ, where both had and still have decent quality double tops, and a smaller H&S had formed on both that on a break down would have a target close to the larger double top support levels.
I was doubtful about these delivering, though I thought that they might well break down, as though the historical stats on Friday leant bearish, as is often the case on the last trading day of the month, the first two trading days of June lean strongly bullish, as is also frequently the case on at least the first trading day of the month.
What we then saw was these H&S patterns break down, test the weekly pivots (for last week) on both, and then rally back over the H&S right shoulder highs, invalidating the H&S patterns and suggesting strongly a move to retest the May highs on both.
We’ll see how that goes but that is in line with what seems to me most likely to happen. Here is the hourly ES chart showing this, though I won’t show the NQ chart here because it is almost identical and I try to keep the number of charts in these posts down to a maximum of five.
ES Jun 60min chart:
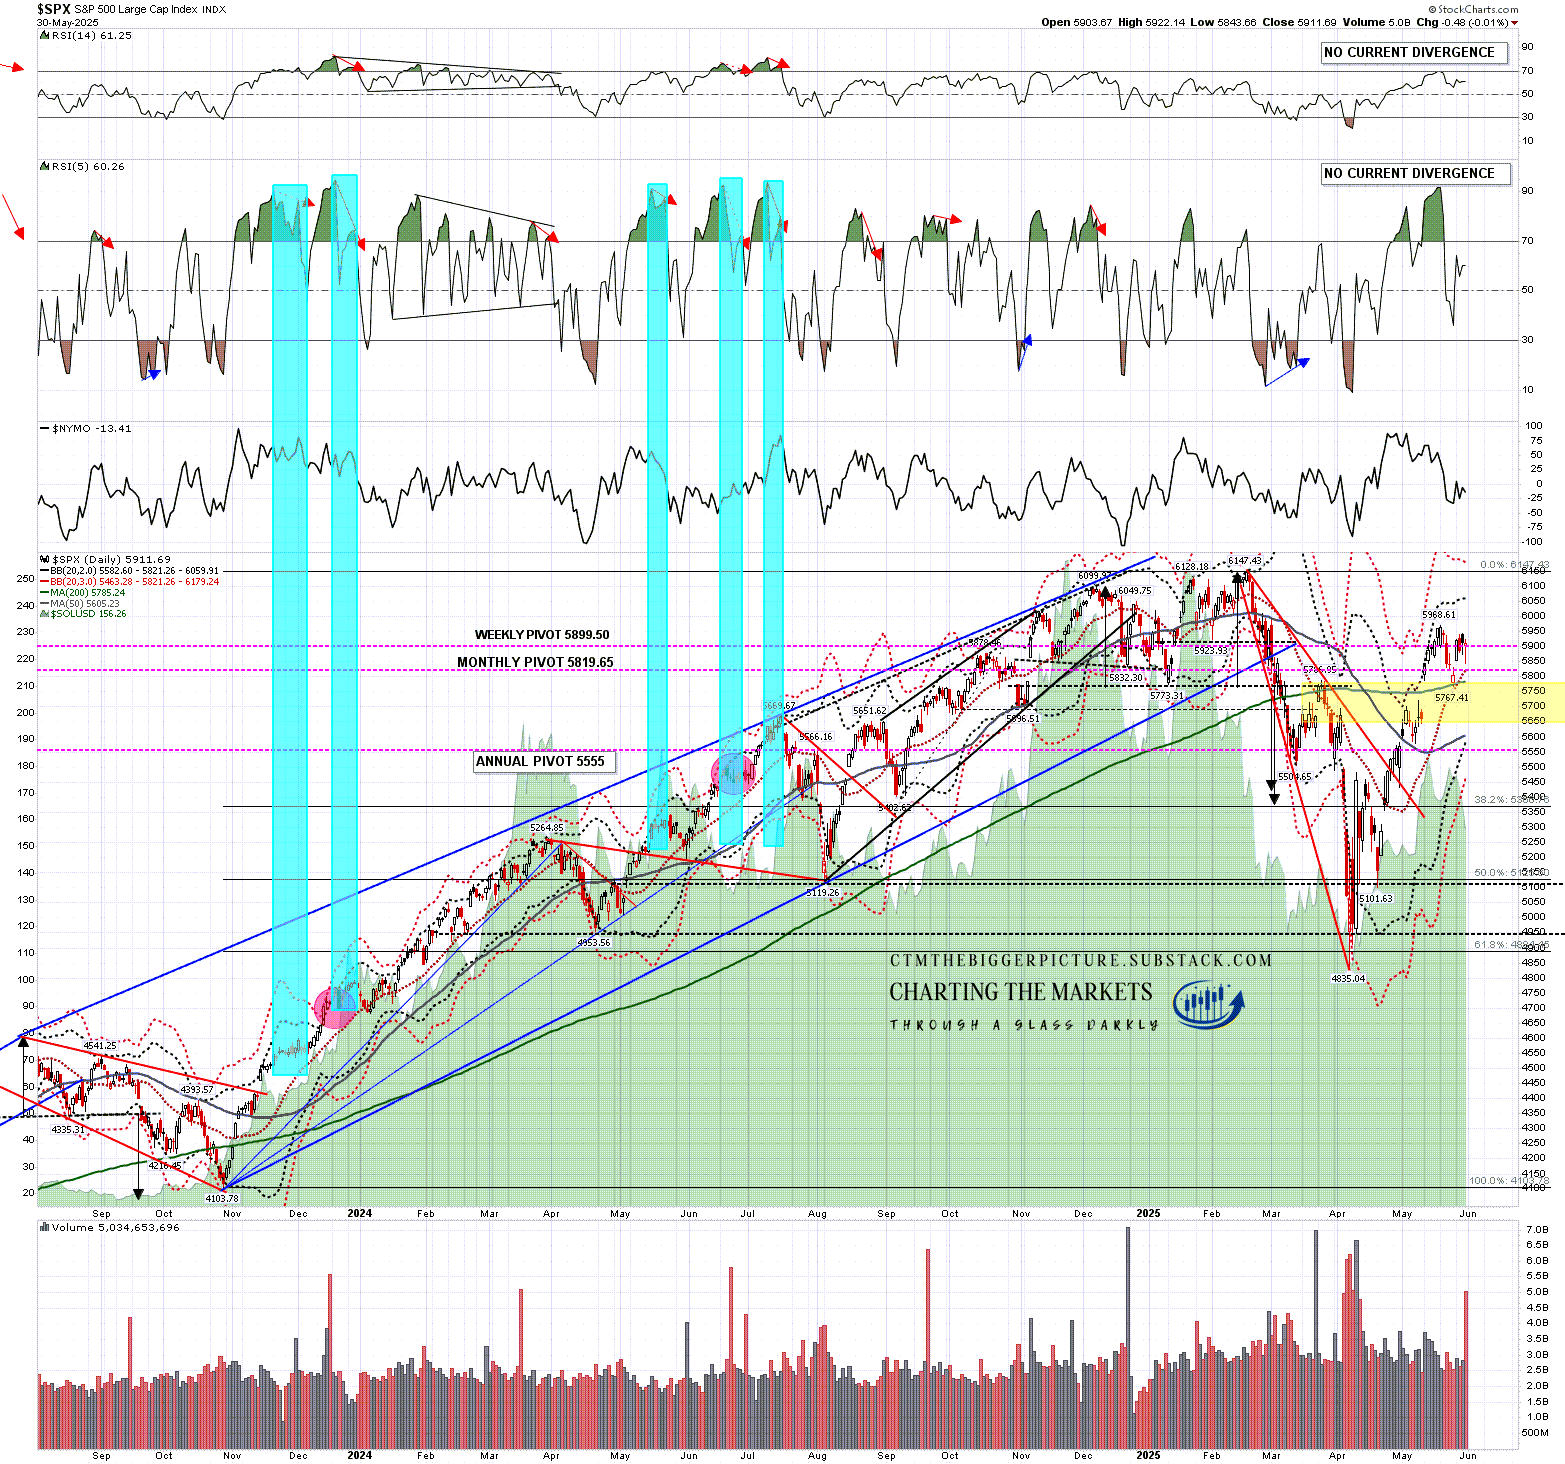
In terms of the SPX daily chart I was wondering two weeks ago whether the consolidation / retracement might set up a possible RSI sell signal on the high retest that would likely follow and that didn’t happen, as RSI 5 fell well below 50 but I’m seeing strong support now at daily middle band, currently at 5821, and the 200dma, currently at 5785.
I would note that if SPX is forming an ABC bull flag here, then we might still see a lower low with an ideal low in the 5650-5700 area, but at this point I would be very surprised to see both the daily middle band and the 200dma broken, and also a fill of the breakaway gap over the 200dma we saw in early May, which I would generally expect to remain unfilled until the next big reversal.
SPX daily chart:
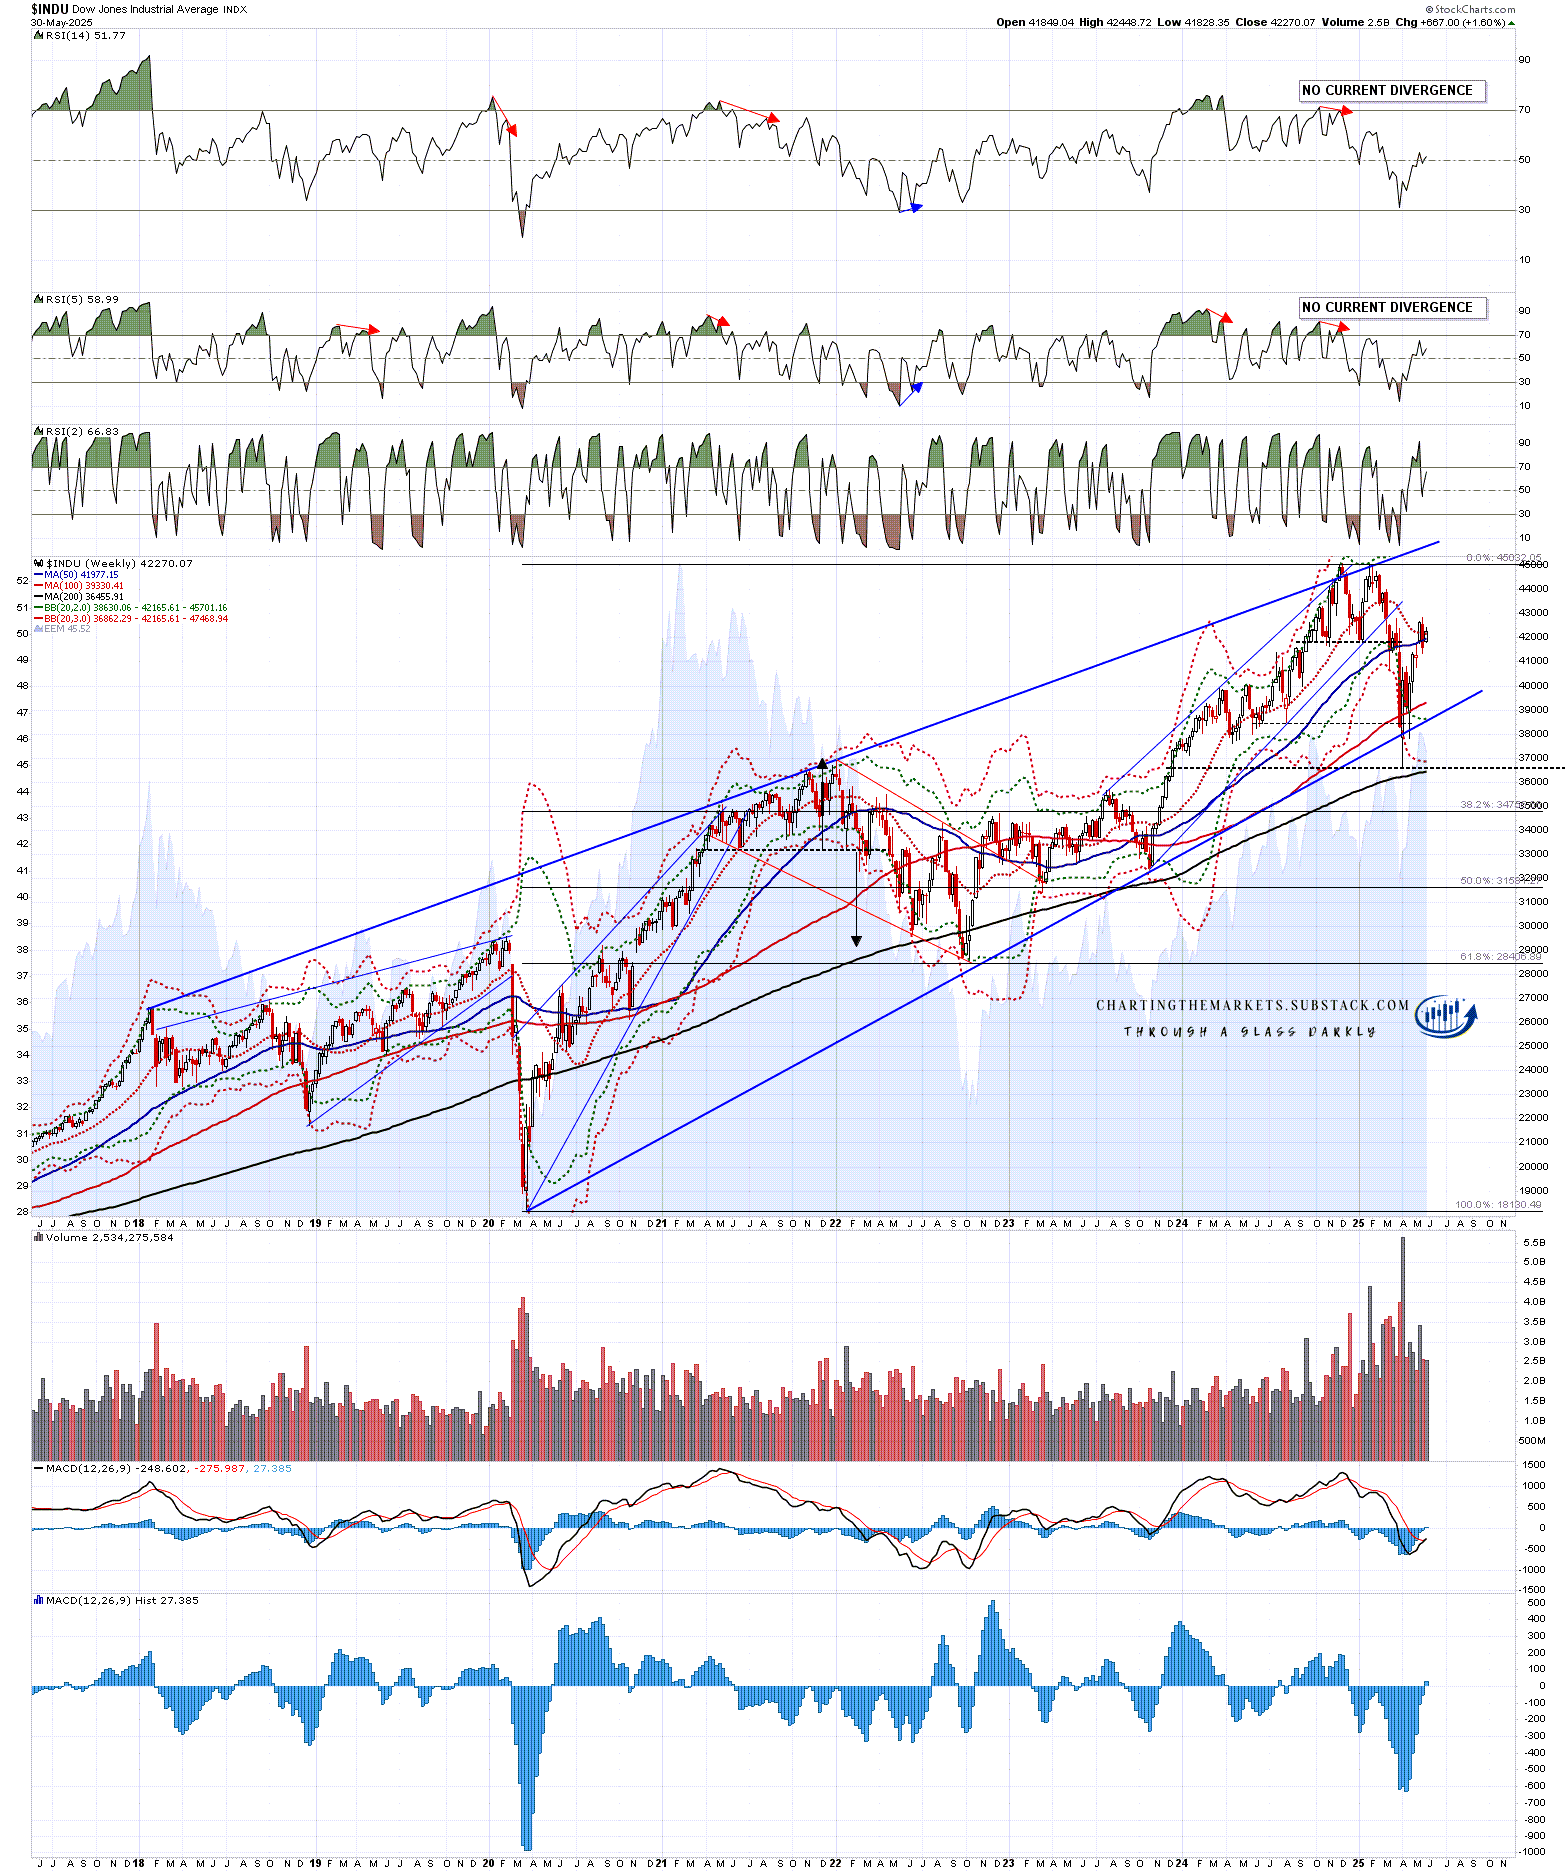
So what’s happening here on the bigger picture? The first thing I’d say is that the odds of seeing all time high retests on Dow Industrials (INDU & DIA) and IWM are looking better than they did a couple of weeks ago. There is a decent looking IHS on IWM that I’m not showing today but the setup after that is clearer on INDU where the rising wedge from the 2020 low broke down in April.
This is a point at which I'm looking for a topping pattern to form and if we see Dow Industrials retest the ATH then that would set up a high quality double top that on a subsequent sustained break below the April low could deliver a 61.8% retracement of that move up from the 2020 low. I think we might see this deliver, and it isn’t the only chart I’m looking at with this kind of setup brewing.
INDU weekly chart:
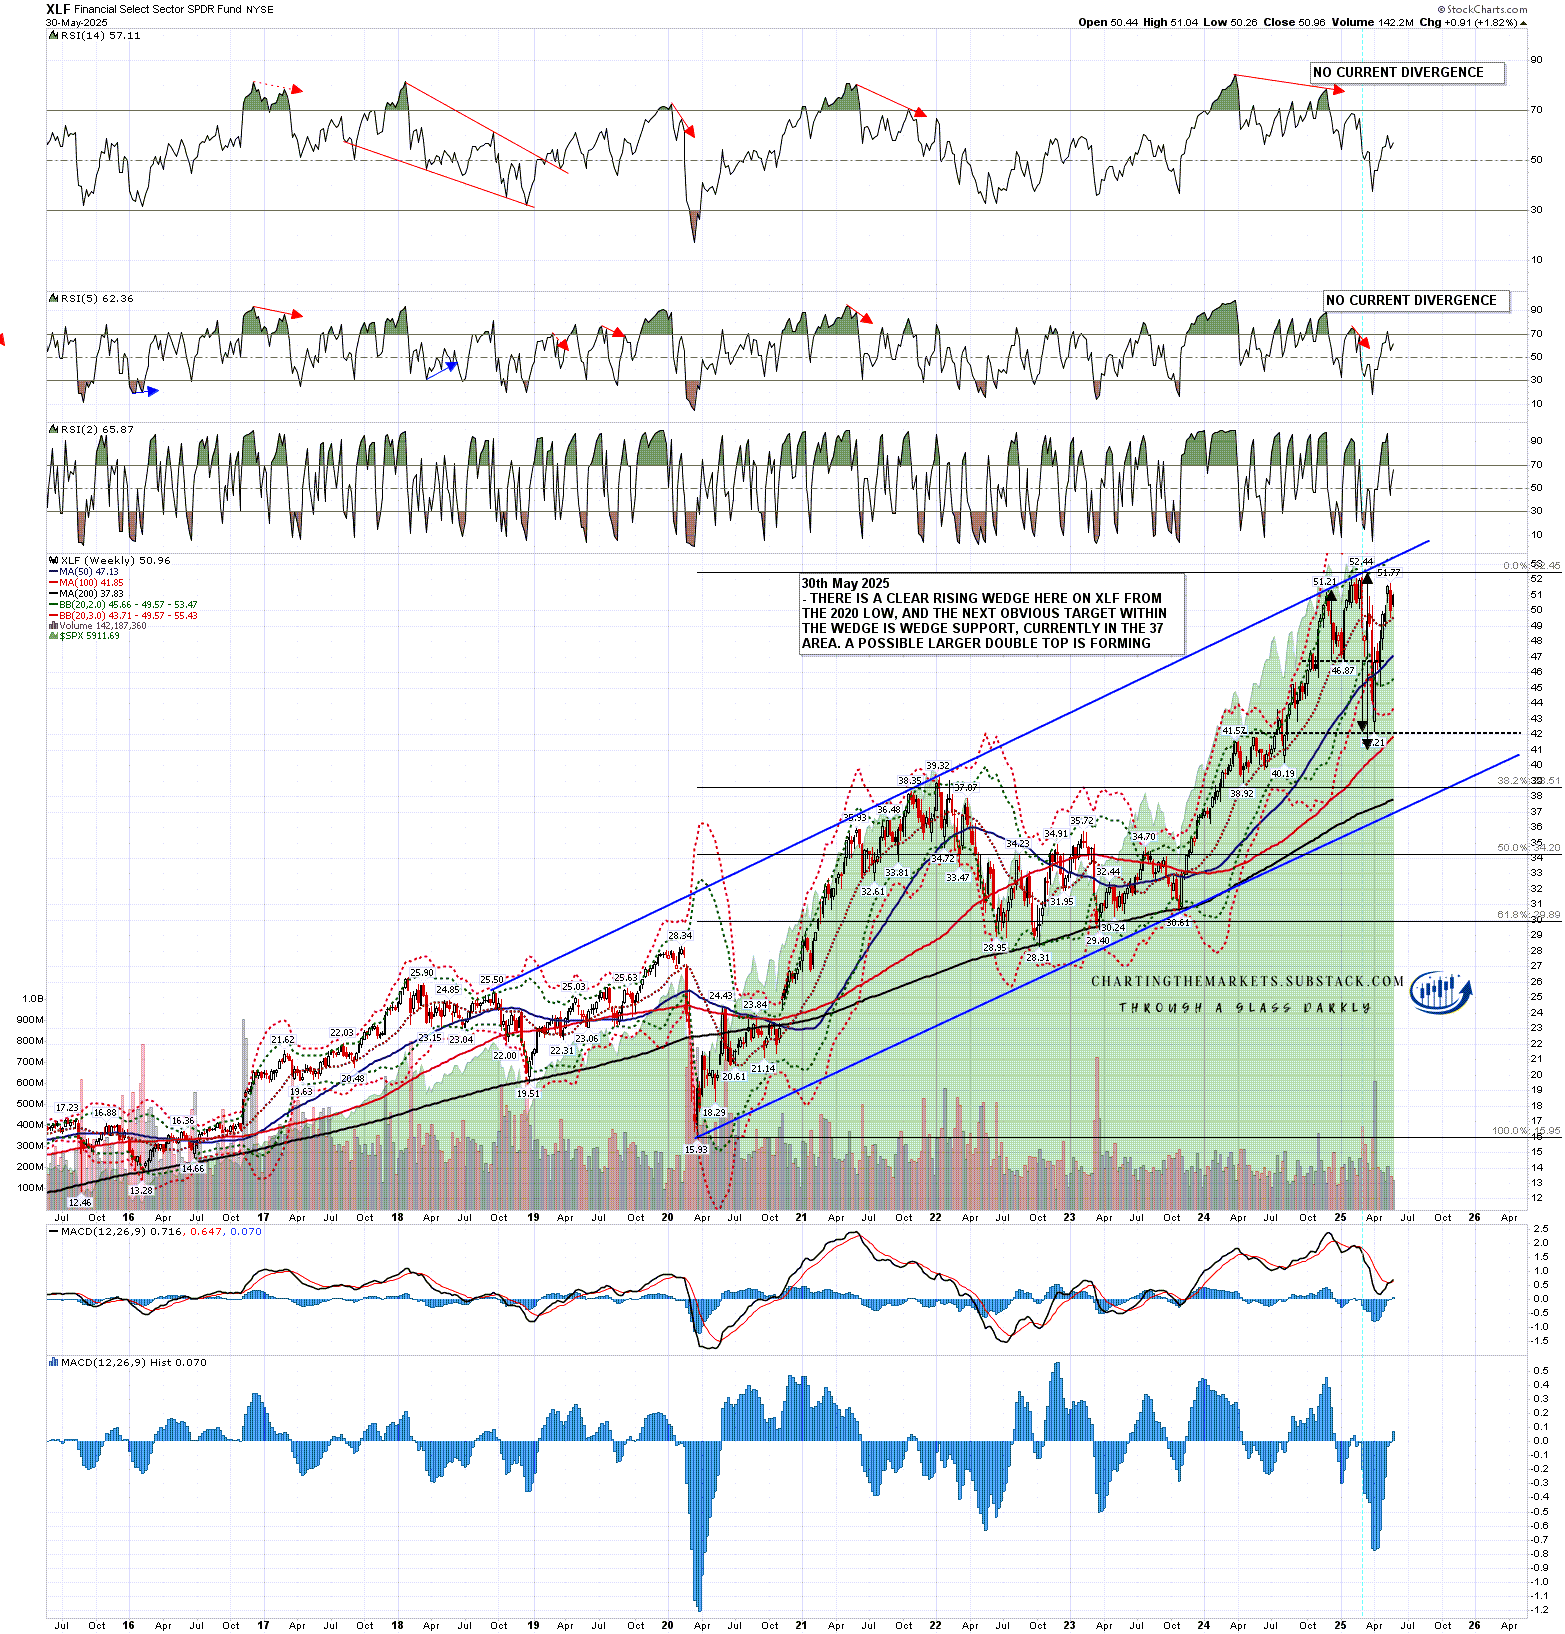
The XLF chart is a variation on this theme, with the pattern from the 2020 low being a rising megaphone that hasn’t yet broken down rather than a rising wedge that has, but again if we were to see a retest of the all time high I’d be wondering about a double top forming.
I’m keeping an open mind about whether we see major market turbulence again this year but one thing I do know is that the Trump administration seems determined to deliver it, with an economic and fiscal program that looks calculated to alienate as many voters as possible, while slowing economic growth to a crawl, and seriously worrying bond markets by accelerating the growth of the already huge national debt. We’ll see, but I think the much higher volatility that we have seen this year will likely persist for quite a while yet.
XLF weekly chart:
I’ve been looking at TSLA regularly this year, and in my post on 17th April I was looking at a double bottom setup & said:
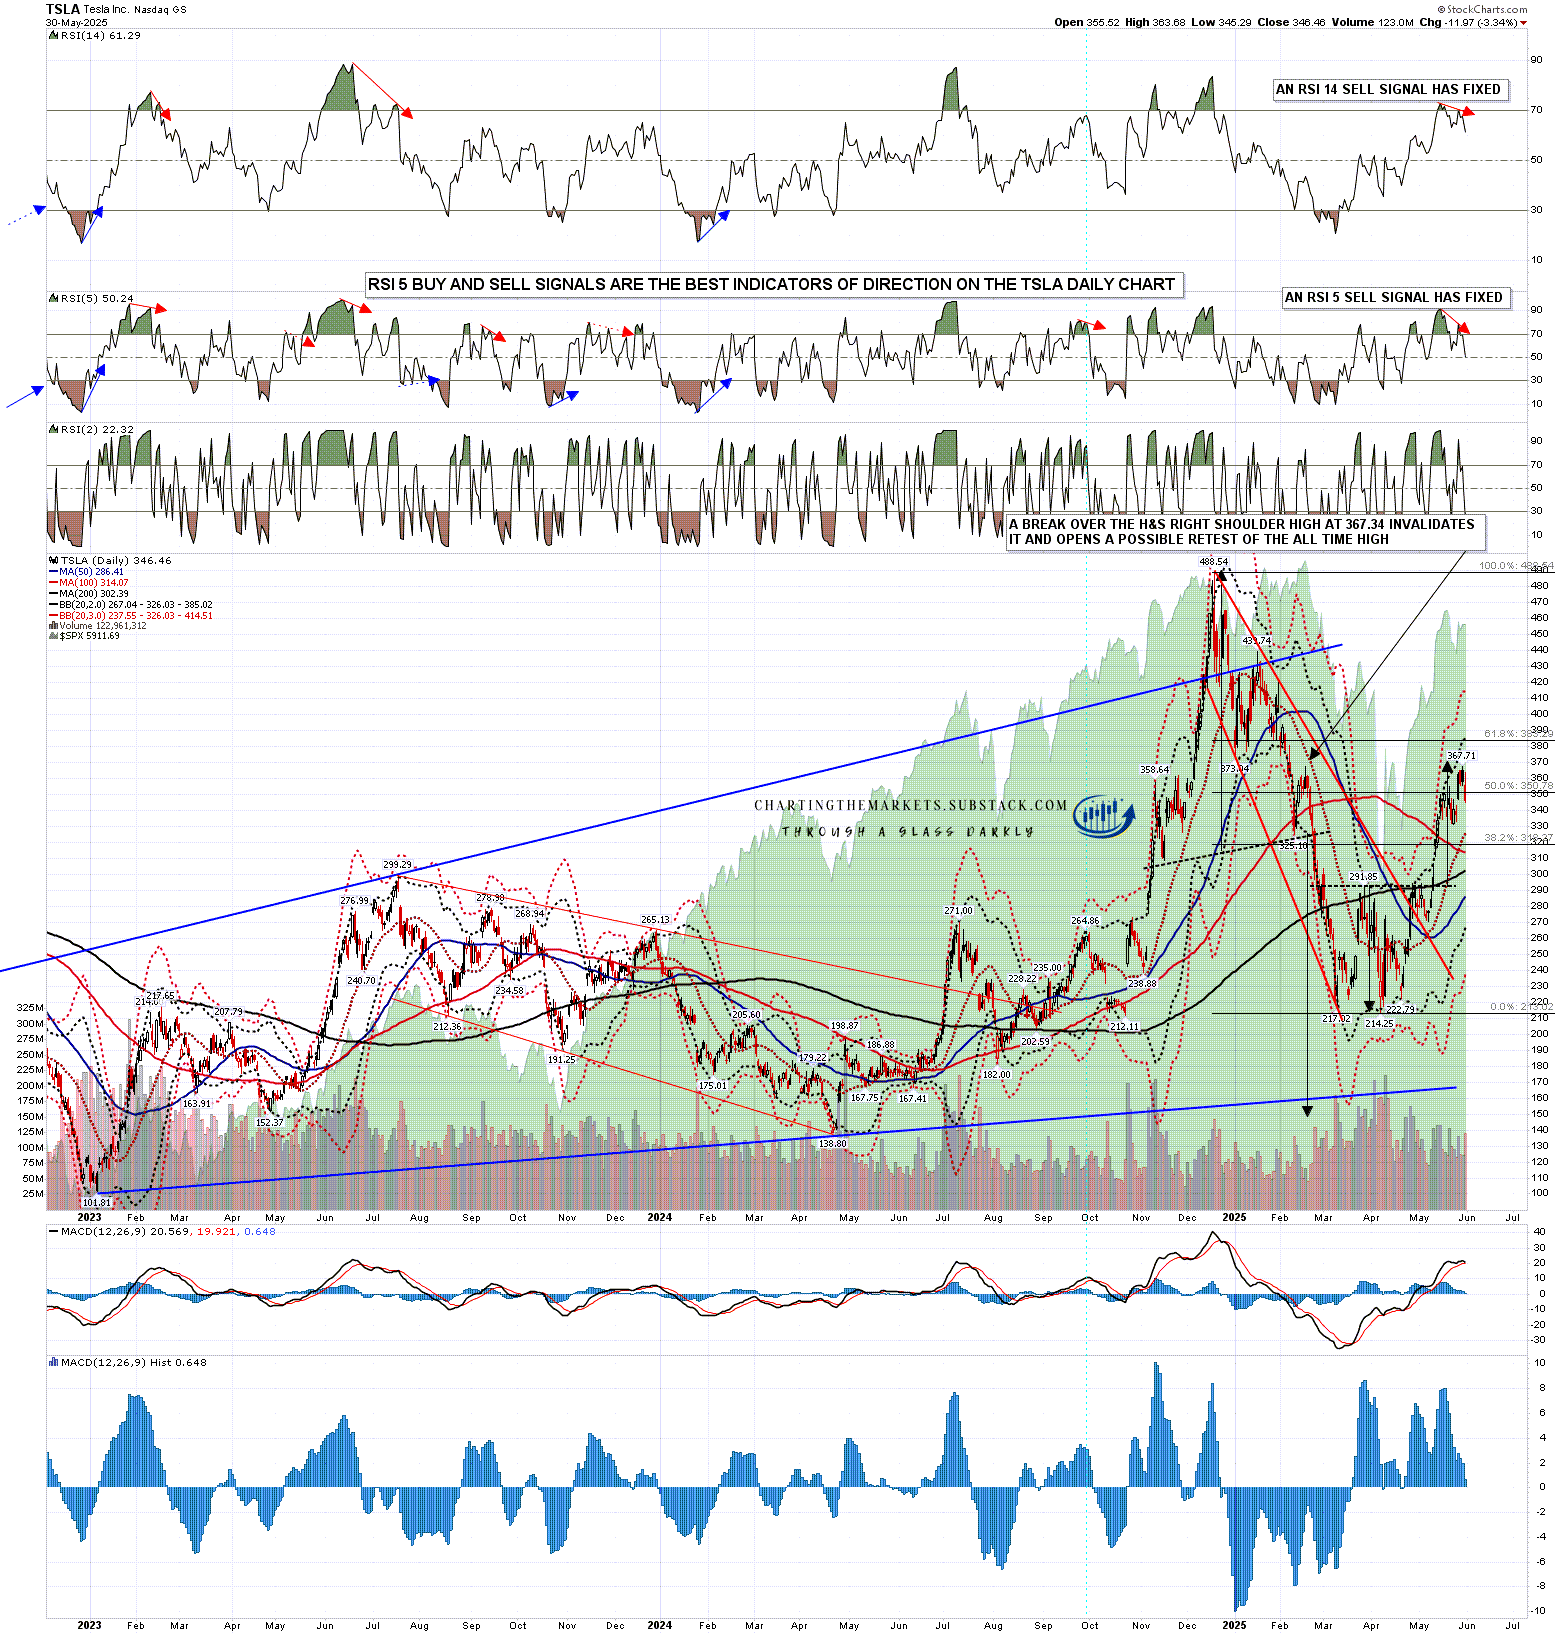
‘On a sustained break over double bottom resistance at 291.85, currently being crossed by that falling megaphone resistance, the double bottom target would be in the 366-70 area, between the 50% retracement level at 353 and the 61.8% retracement level at 385. From a pure TA perspective this is a good quality setup and might well have a shot.’
The rally high on TSLA is currently at 367.71, so that double bottom target area was reached and one thing I always look out for is a possible reversal close to these targets, as there is often a strong reversal there. That last high was made on both RSI 14 and RSI 5 negative divergence on the TSLA daily chart and both those possible daily sell signals have now fixed.
The last time this happened on the TSLA daily chart in Feb ‘23 it retraced 61.8% of the preceding move over the next four months while forming a bull flag. At minimum I’d generally be looking for a backtest of the 200dma, currently at 302. Could it go lower? Most definitely. Sales and earnings have been dropping fast and the P/E ratio is currently over 190.
TSLA daily chart:
I’ve been saying the following on all my posts so far this year:
As I have been since the start of 2025 I’m still leaning on the bigger picture towards a weak first half of 2025 and new all time highs later in the year, very possibly as a topping process for a much more significant high. One way or another I think we’ll be seeing lower soon and I’m not expecting this to be a good year for US equities, not least because both of the last two years have been banner years for US equities. A third straight year of these kinds of gains looks like a big stretch. I could of course however be mistaken. UPDATE 11th March 2025 - I am wondering if this may be a bear market that dominates the whole of 2025.
This has been going faster than I expected and it looks like we may see both the initial weakness and the new all time highs in the first half of this year. I remain doubtful about seeing a lot more than retests of the all time highs and I think we may well see a lot of further market disruption in the second half of 2025. We’ll see how that goes. Everyone have a great (rest of the) weekend. :-)
If you like my analysis and would like to see more, please take a free subscription at my chartingthemarkets substack, where I publish these posts first. I also do a premarket video every day on equity indices, bonds, currencies, energies, precious commodities and other commodities at 8.45am EST, but only for paying subscribers. Other places to find me are my twitter, and my Youtube channel.
No comments:
Post a Comment