
In my posts on 3rd June and on 11th June I was putting the case for retests of the all time highs on SPX and QQQ, and potentially also on DIA and IWM. In the event that equity indices went higher from there I was also giving targets for that.
In my post on Friday 20th June I laid out a possible short term retracement scenario that I said I didn’t like but was potentially on the cards, and that didn’t happen, despite the US joining the war against Iran over the weekend.
Since the weekend that modest bearish scenario has collapsed, SPX and QQQ have made new highs for June, oil futures fell an amazing $14 from high to low yesterday as fears of an extended conflict in the Middle East receded.
This has been a very resilient market, all we have seen in recent weeks is a modest retracements preceding higher highs, and key short term support at the daily middle bands has held everywhere on these indices except on DIA, which traded under the middle band for a few days and is now back above it. The way is open for at least retests of the all time highs on SPX and QQQ, and those retests are the next obvious upside targets.
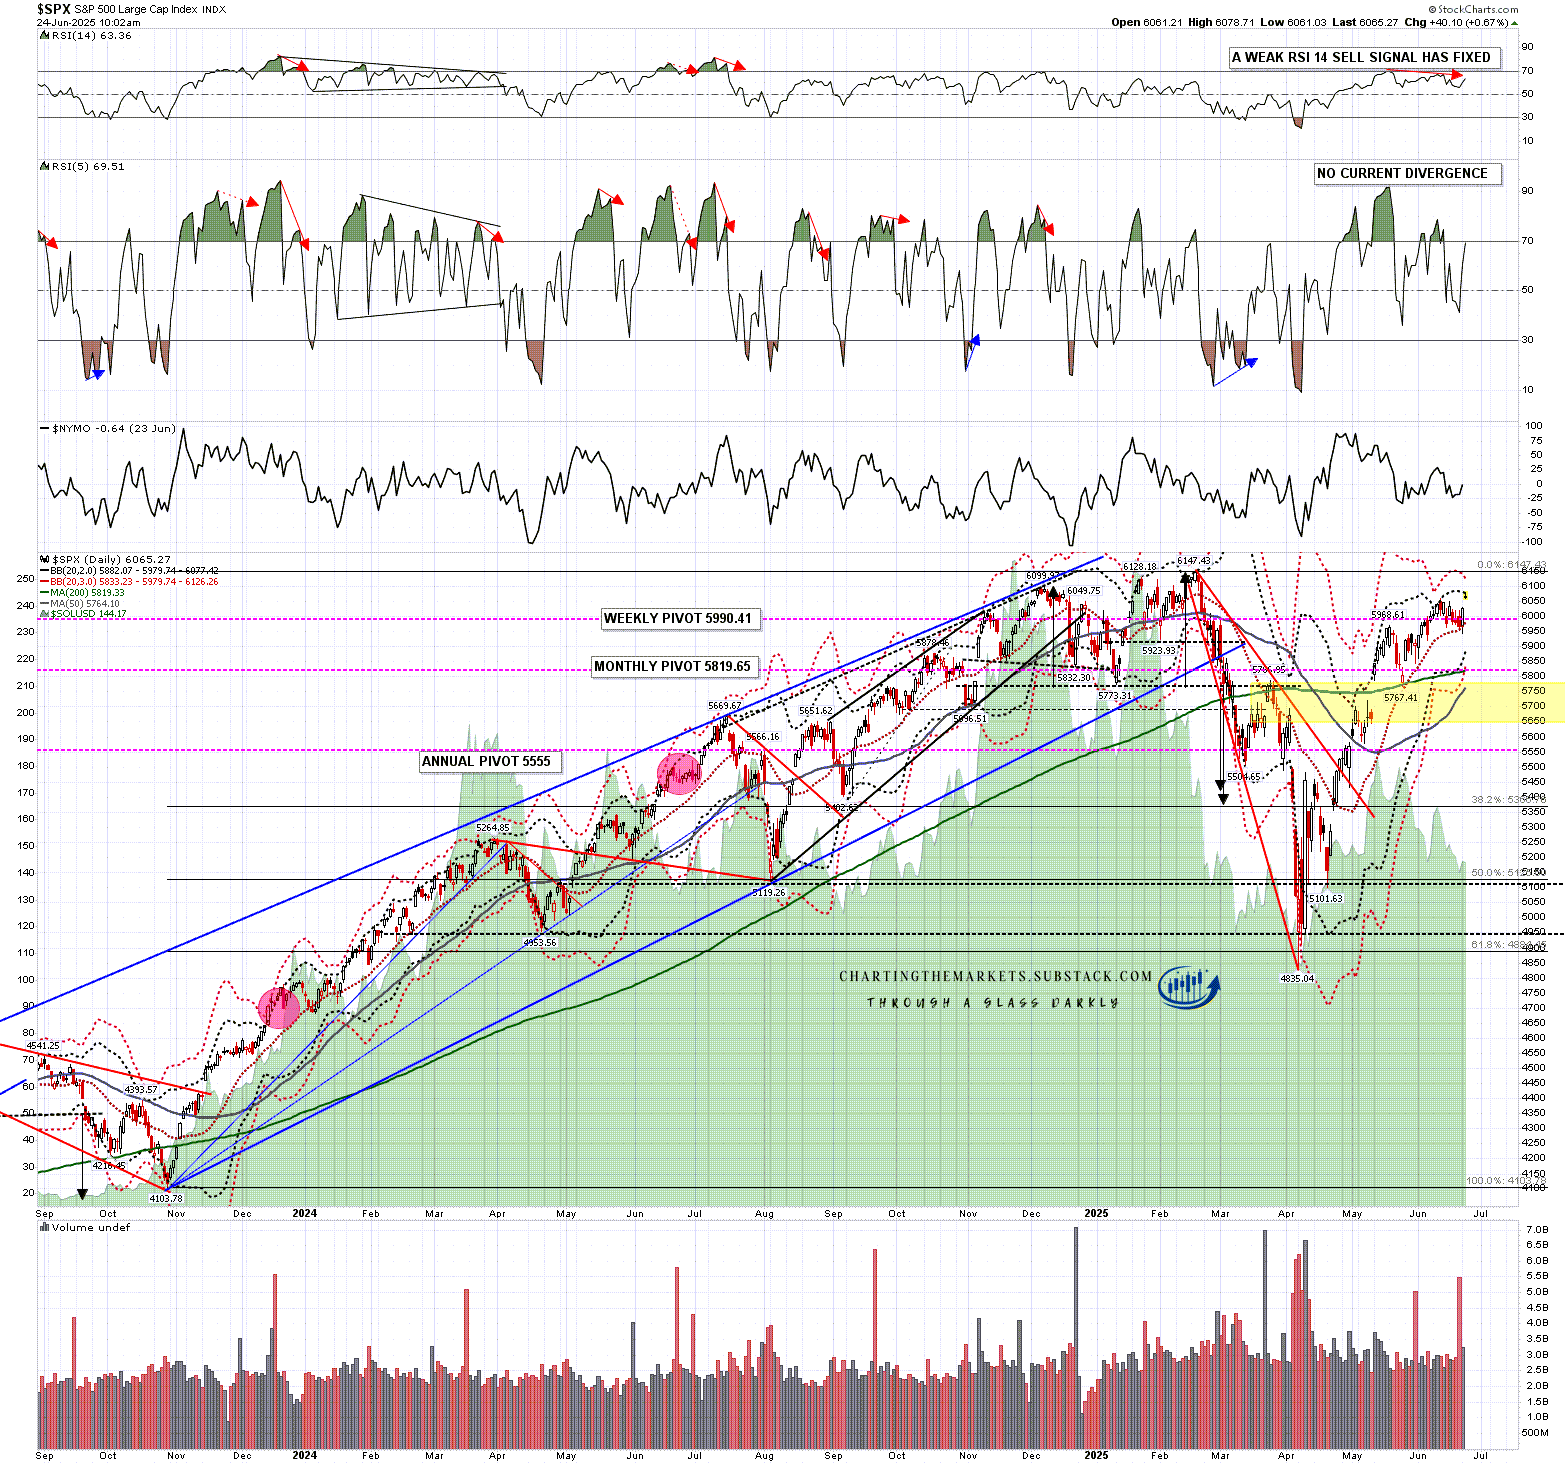
On the SPX daily chart the daily middle band has been support since it was broken and converted to support after the April low and that was tested again yesterday morning and held again. Until that is broken and converted to resistance this market is leaning higher.
SPX daily chart:
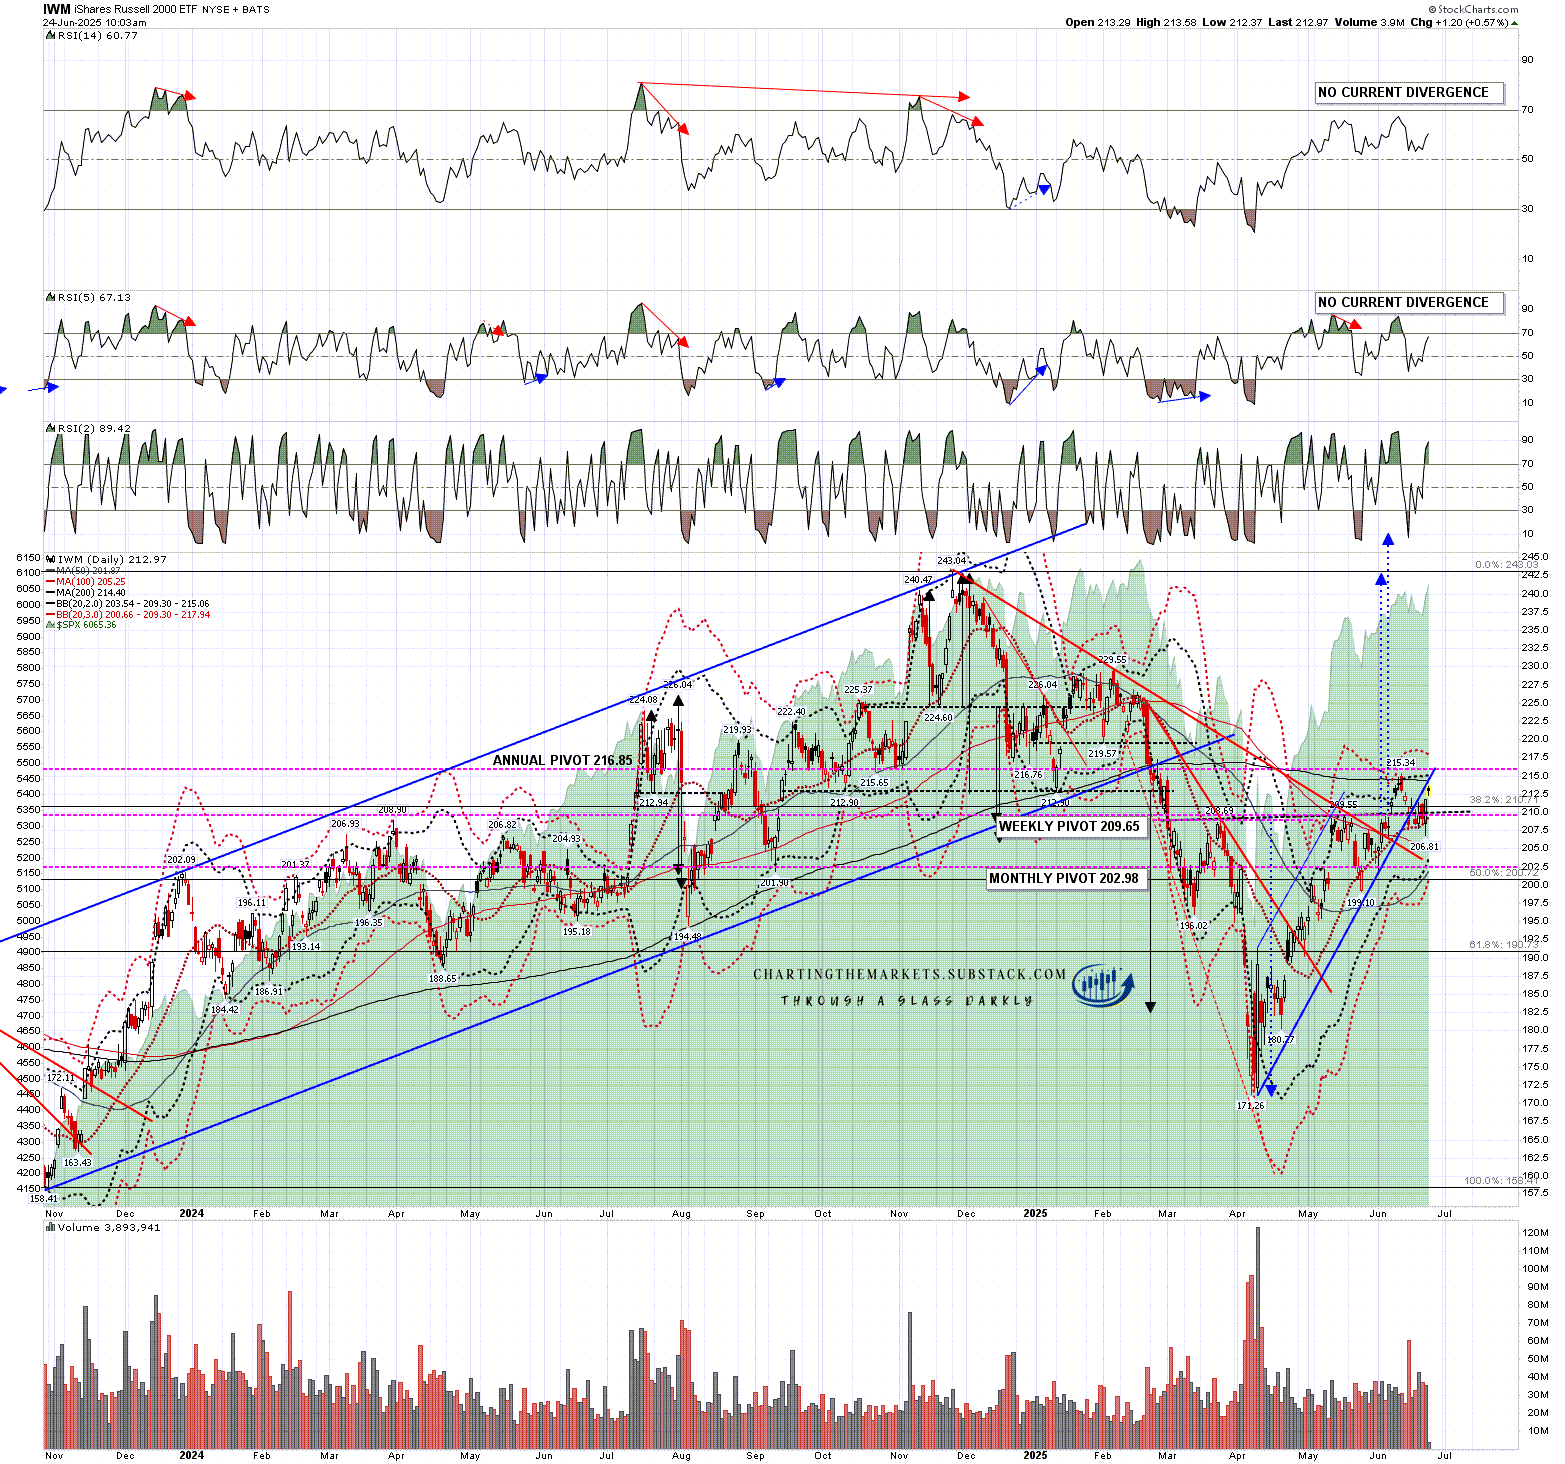
Is there a case for going significantly higher than a retest of the all time highs on SPX and QQQ? Yes, though it is only really based on a large IHS on the IWM daily chart, and this IHS could of course fail.
Until that fails though, this is a high quality IHS on IWM that has broken up with a target at the retest of the all time high at 243.04. This is a high quality pattern and would only fail on a break back below the IHS right shoulder low at 199.10. IWM also held support at the daily middle band yesterday and there’s no current sign that this IHS might fail.
If the IHS reaches target then that would imply that while that was happening, SPX, QQQ and DIA would likely go significantly higher, and I was laying out the possible targets for those moves in my posts on 3rd June and on 11th June.
IWM daily chart:
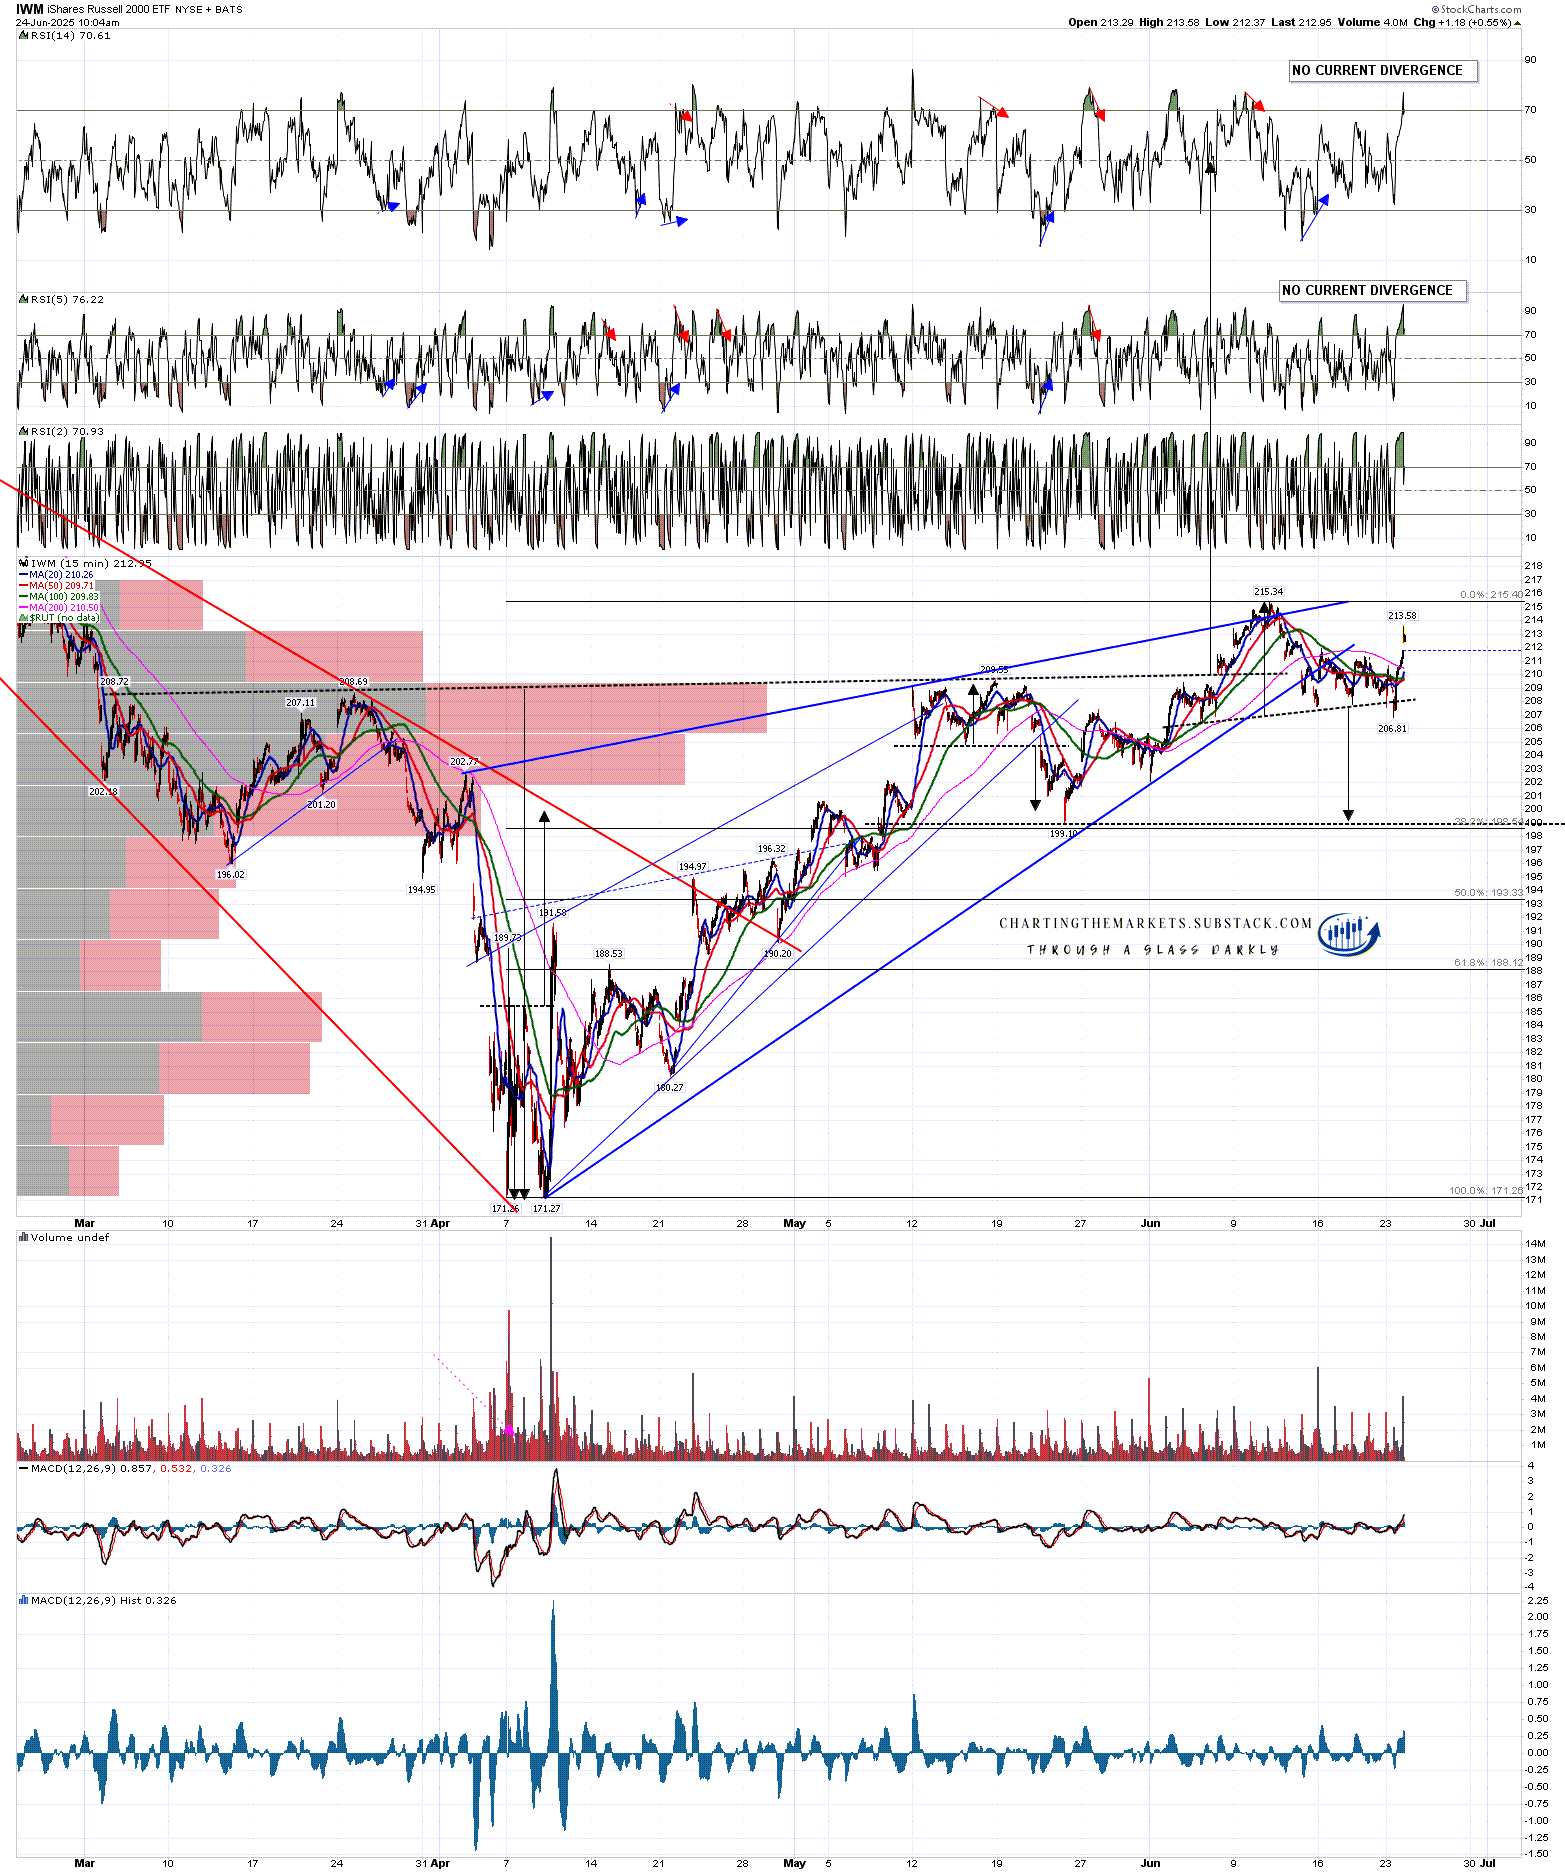
Looking short term the highest quality H&S that I was looking at on Friday was on IWM. That H&S broke down slightly and then failed this morning with a break over the right shoulder high. I’d expect at least a test of the June high after this and we may well see extension higher as the rising wedge shown on the chart below evolves into a larger uptrend pattern.
IWM 15min chart:
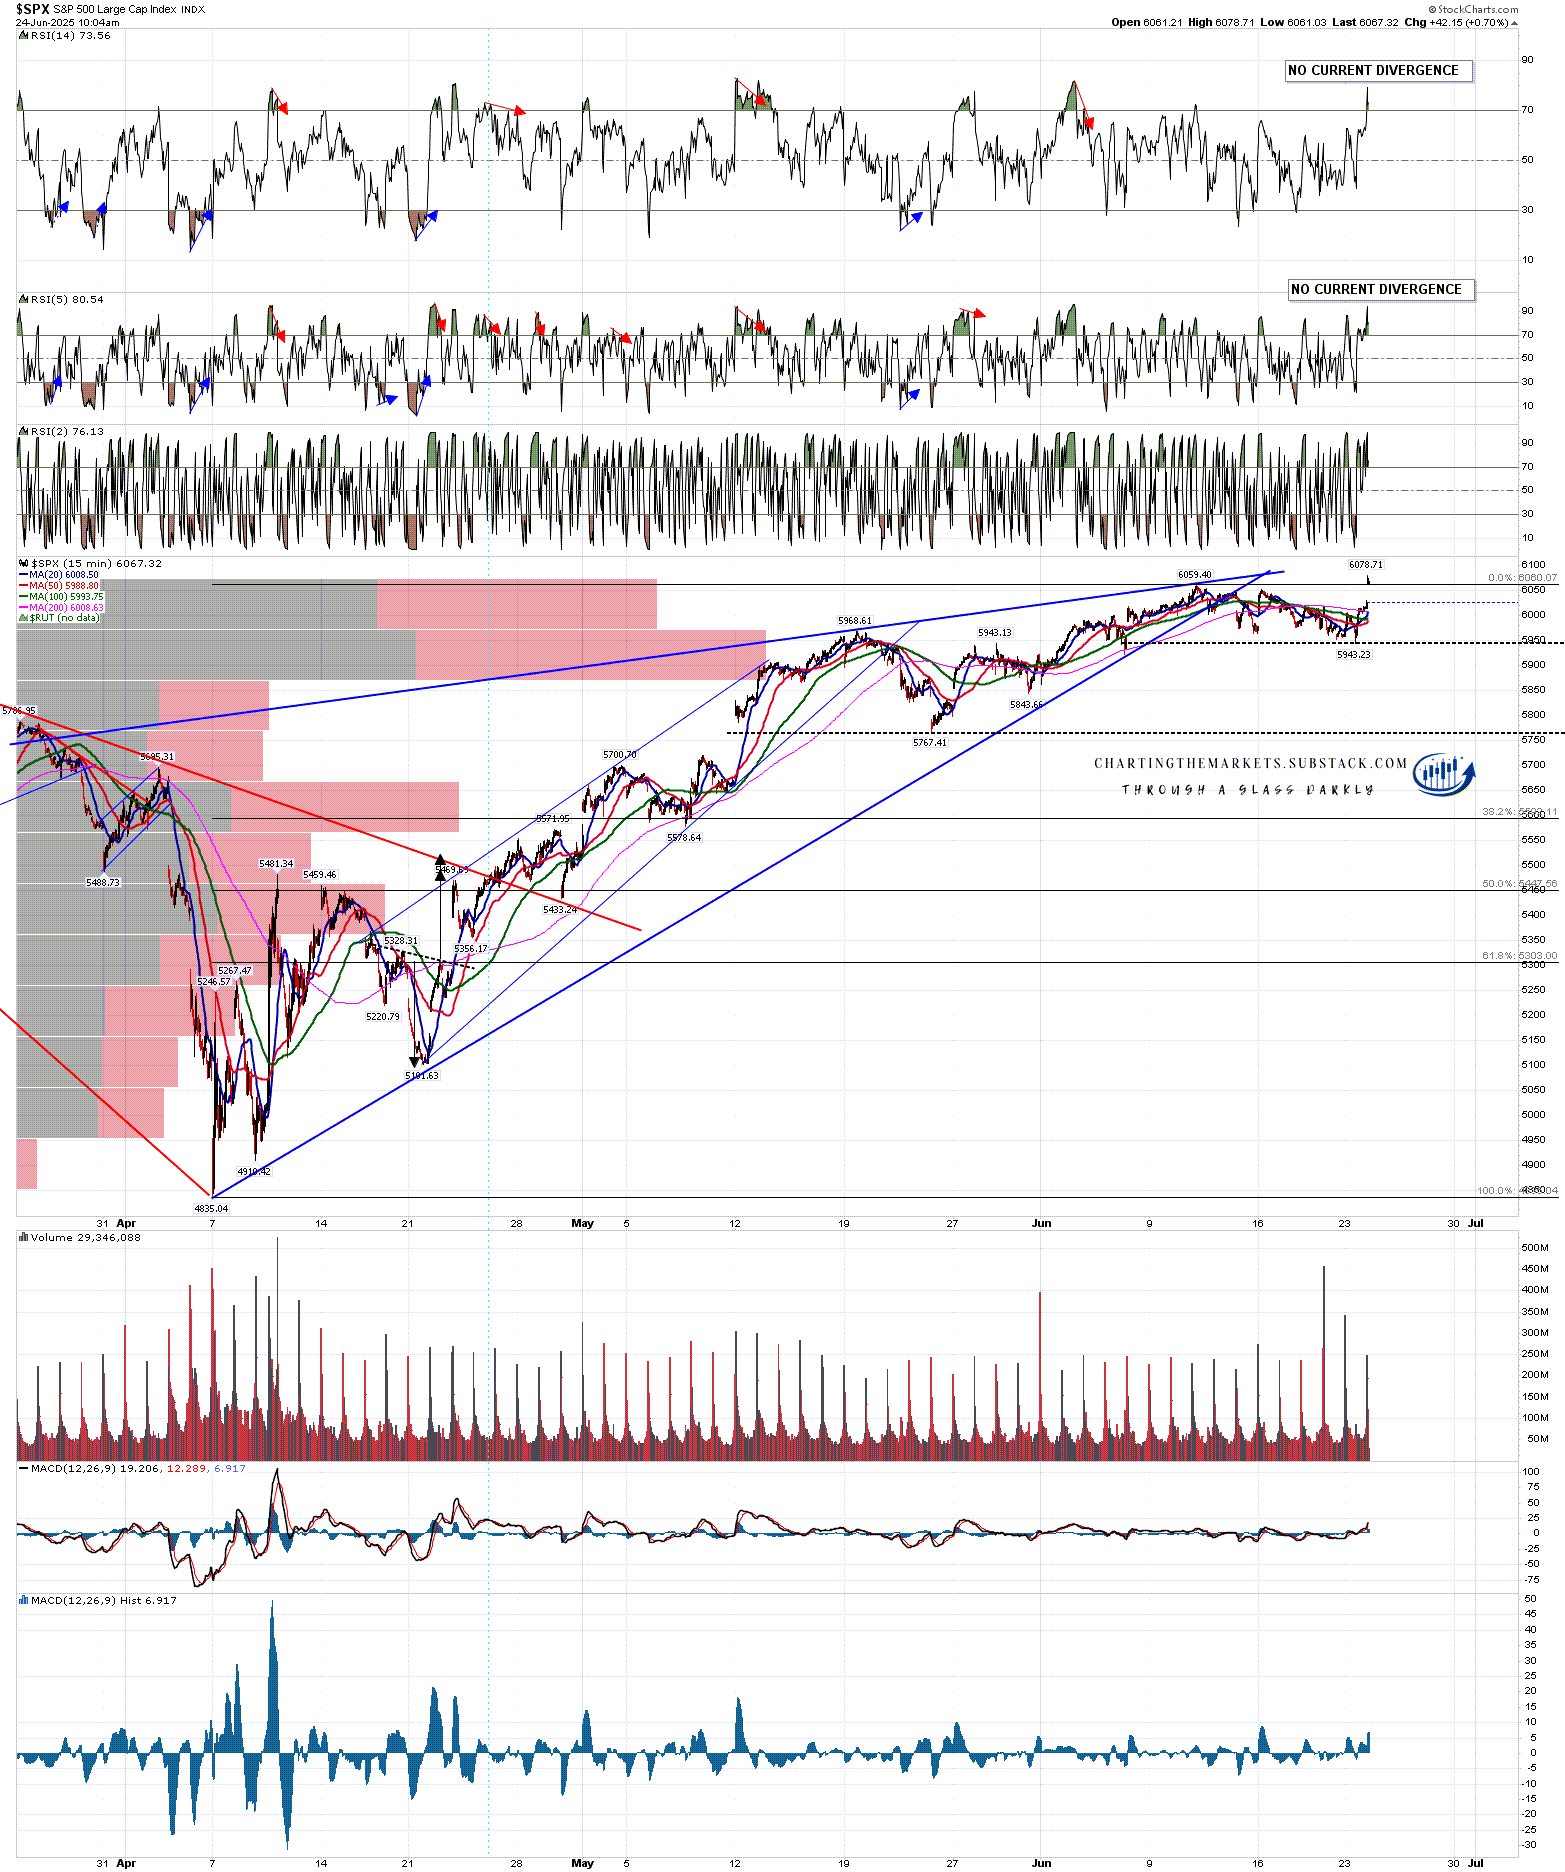
As with QQQ, SPX has now retested the June high and this could be a short term double top, though there nothing currently to suggest that is likely. If instead we see a move to retest the all time high at 6147.43, with the high so far today at 6078.71, that is less than 70 handles away.
SPX 15min chart:
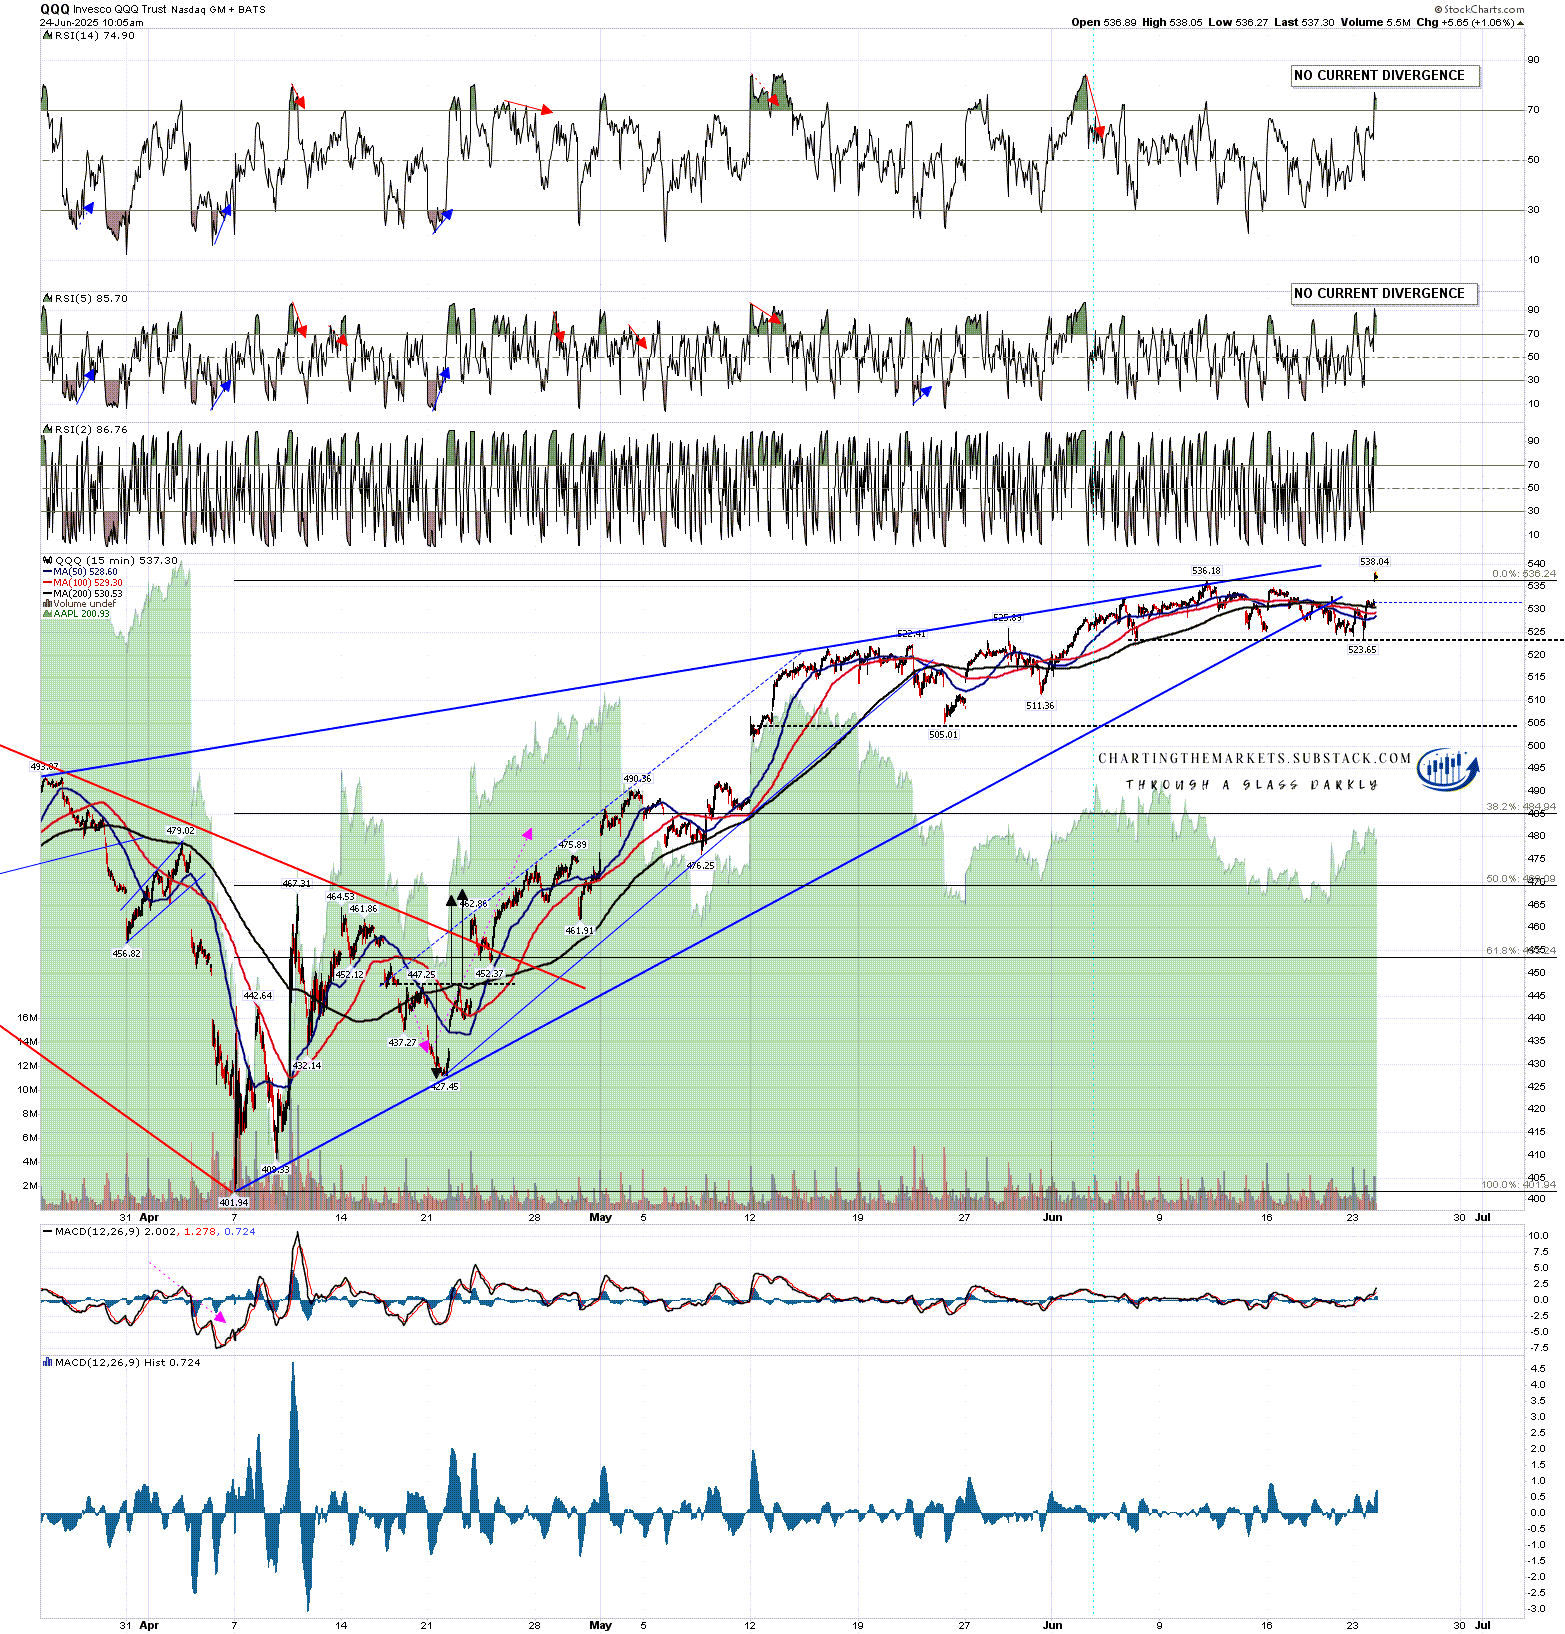
The setup on QQQ is the same. If we see a move to retest the all time high at 539.80, with the high so far today at 538.18, that is even closer.
QQQ 15min chart:
This has been a strange and very news-heavy year, but the charts have still been pointing the way reliably. In my post on 19th February I laid out all the topping pattern on these four US indices that then all played out. I called the case for a decent rally in my post on 18th March, and the likely top on that rally on 26th March. In my post on 11th April I was talking about the possibility that the rally that had just started might deliver retests of the all time highs on at least SPX and QQQ. There are more examples but my point is that most of the reversals this year, large and small, have been signalled by the charts beforehand despite the high density of news.
My point with my post title today is that while there has been, and remains, a lot of confusion in the US this year, the charts have been the best guide to what is coming next in the US so far, and will likely remain the best guide to what happens over the rest of this year and beyond. My focus remains there.
I’ve been saying the following on all my posts so far this year:
As I have been since the start of 2025 I’m still leaning on the bigger picture towards a weak first half of 2025 and new all time highs later in the year, very possibly as a topping process for a much more significant high. One way or another I think we’ll be seeing lower soon and I’m not expecting this to be a good year for US equities, not least because both of the last two years have been banner years for US equities. A third straight year of these kinds of gains looks like a big stretch. I could of course however be mistaken.
If you like my analysis and would like to see more, please take a free subscription at my chartingthemarkets substack, where I publish these posts first. I also do a premarket video every day on equity indices, bonds, currencies, energies, precious commodities and other commodities at 8.45am EST, but only for paying subscribers. Other places to find me are my twitter, and my Youtube channel.
No comments:
Post a Comment