It has been a really interesting year on the markets so far for me but the winds are changing and I want to review where I think the equity markets stand and where we may see them go from here.
I was saying in a post back on December 2nd that 2025 might well be the most interesting year on the markets in a long time, and that has definitely turned out to be the case. I’ve had an amazing run this year which can’t and won’t last forever but has been a lot of fun.
In a post on 22nd January I was looking at possible new all time highs to set up big topping patterns on SPX, QQQ, DIA & IWM. On 10th February I was looking at getting those new all time highs on SPX, QQQ and DIA in the next few days. On 19th February, the day SPX made the current all time high, I showed the high quality double top targets on SPX, QQQ and DIA, and the lower quality H&S pattern on IWM. All of those patterns subsequently broke down and reached target.
After the highs I published a post on Monday 18th March looking at touches of the weekly 3sd lower band over the last few years and calling for a rally lasting at least a week or two based on the past history of similar setups on the weekly 3sd lower band, and we saw that. I published a post on Tuesday 26th March looking at the bear flags that had formed on that rally and saying that they looked ready to break down towards at least retests of the March lows and they broke down and retested those directly from there.
I published a post on Tuesday 1st April on my bigger picture substack arguing that tariffs would likely go ahead, that the odds of seeing a serious bear market this year were now high and that a full market crash this year was now potentially on the cards. IWM was already in technical bear market territory (decline of over 20% from high), SPX and QQQ reached the 20% level late last week and, at the low yesterday, DIA is currently down 18.383% from the high. I then published another post on Tuesday 1st April on my bigger picture substack looking for a downside target on SPX at 5100, and that was reached on Friday 4th April.
On 8th April I was looking for another rally lasting at minimum a week or two but potentially lasting several weeks, possibly to make right shoulders on much larger H&S patterns and that started the day after. On 17th April I was looking for some downside to set up possible bear flag support trendlines followed by higher highs after that to reach ideal bear flag resistance trendlines. We saw that decline and on 22nd April I was calling for another leg up into new rally highs who we can now seen on SPX, QQQ, IWM but not yet on DIA.
Before I get to looking forward let’s have a look at where we are on the current rally patterns.
I’ve left in all the arrows I posted on these charts on 17th April and while progress has been a little slower than I was guessing then, all four indices are still on track. I am seeing some weak negative divergence here and am wondering whether we might see a modest retracement in the next couple of days to resolve that.
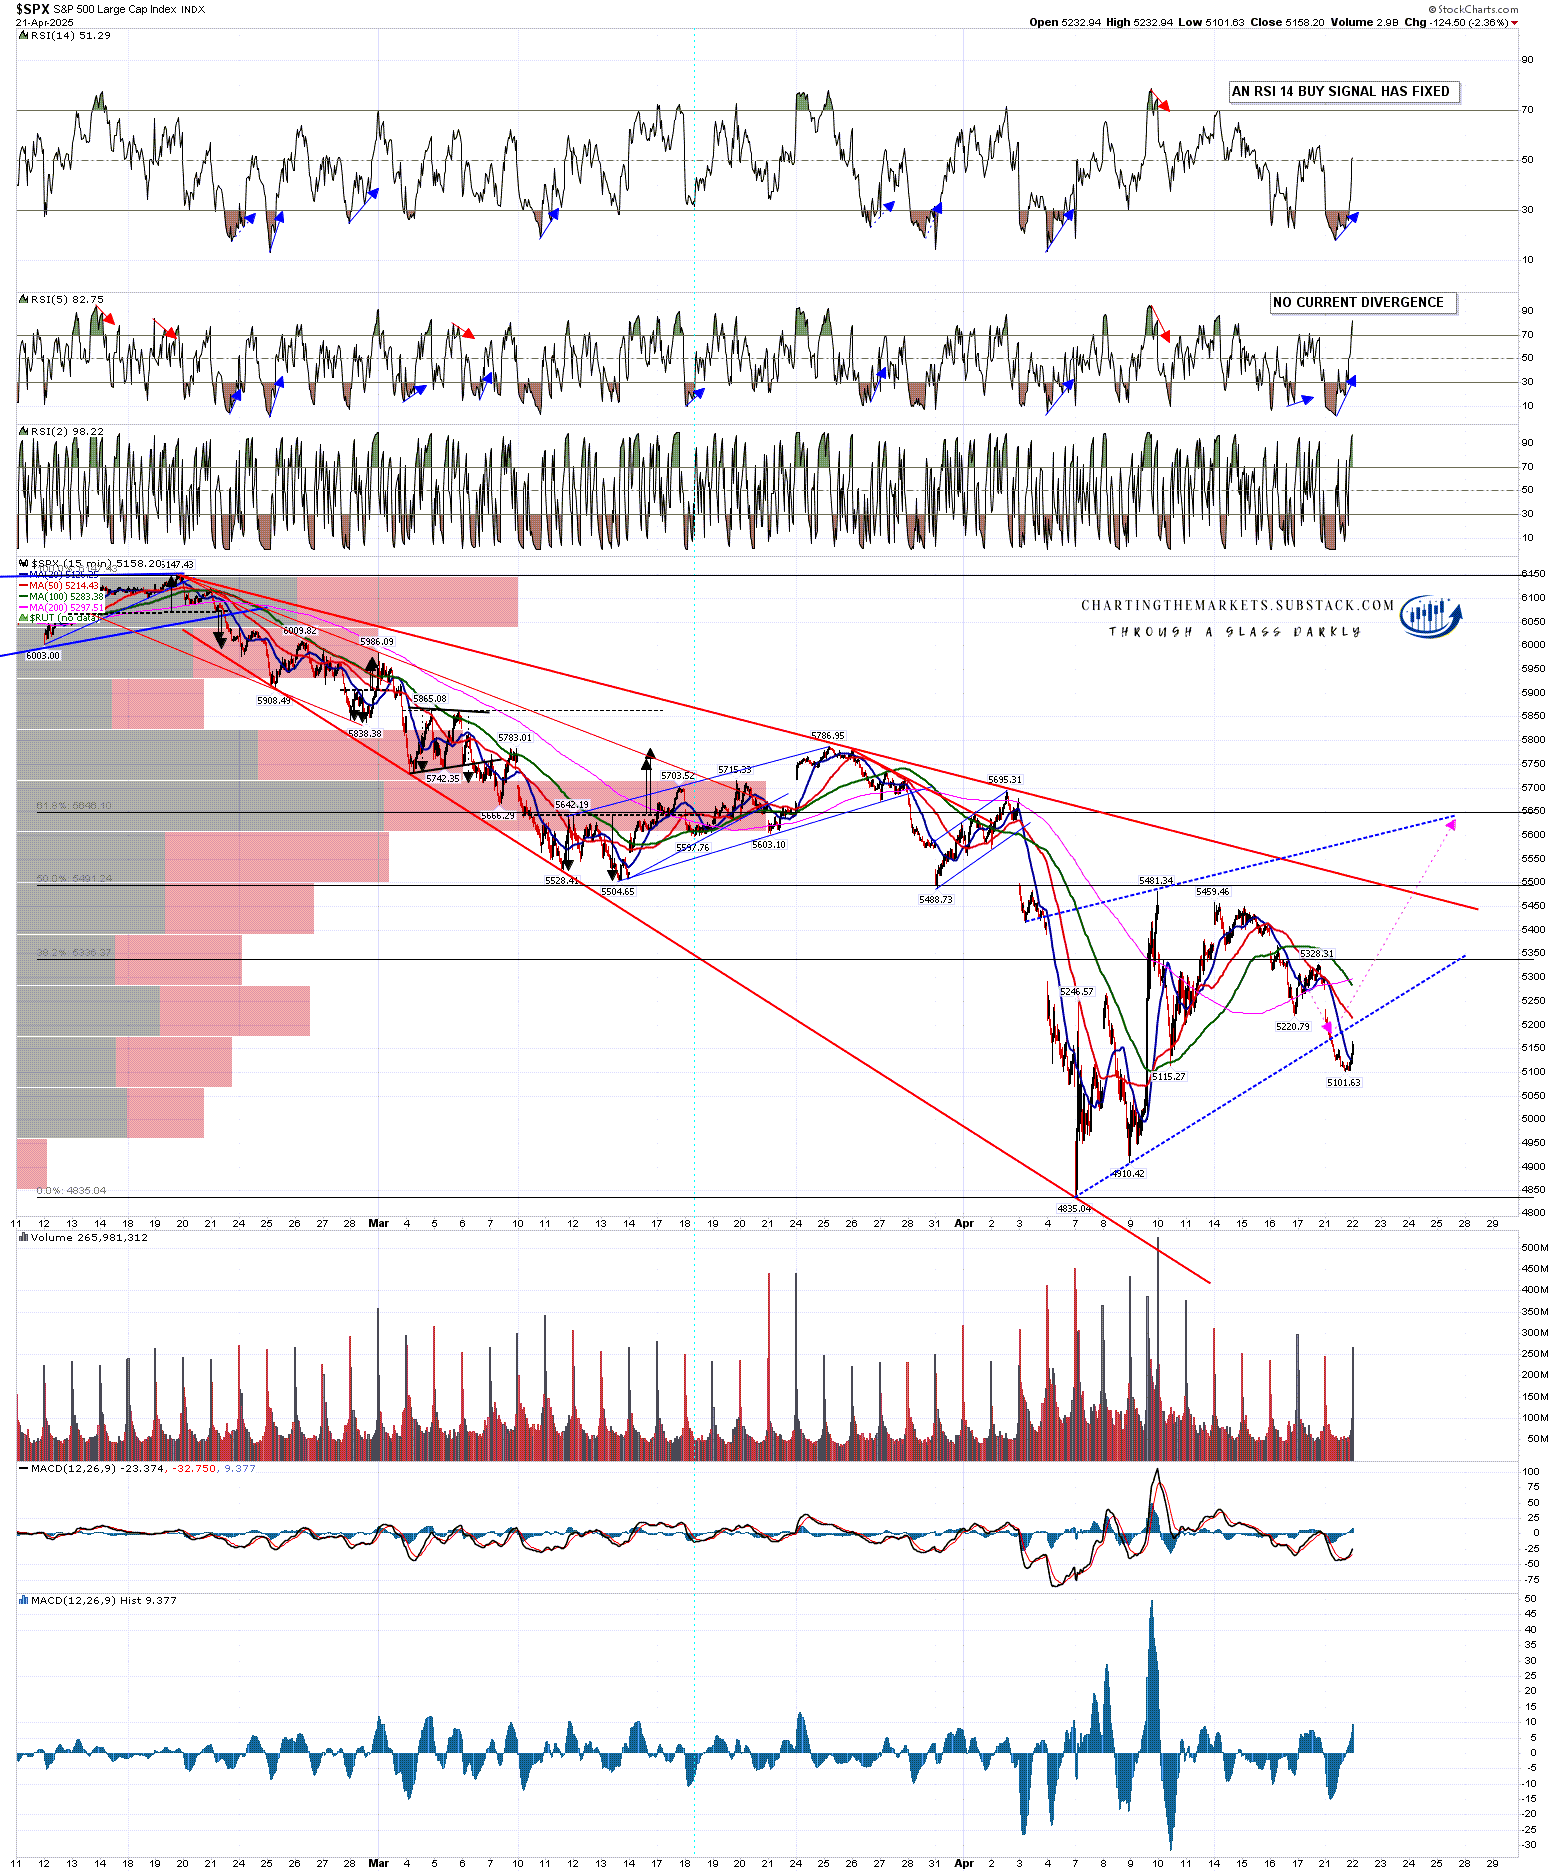
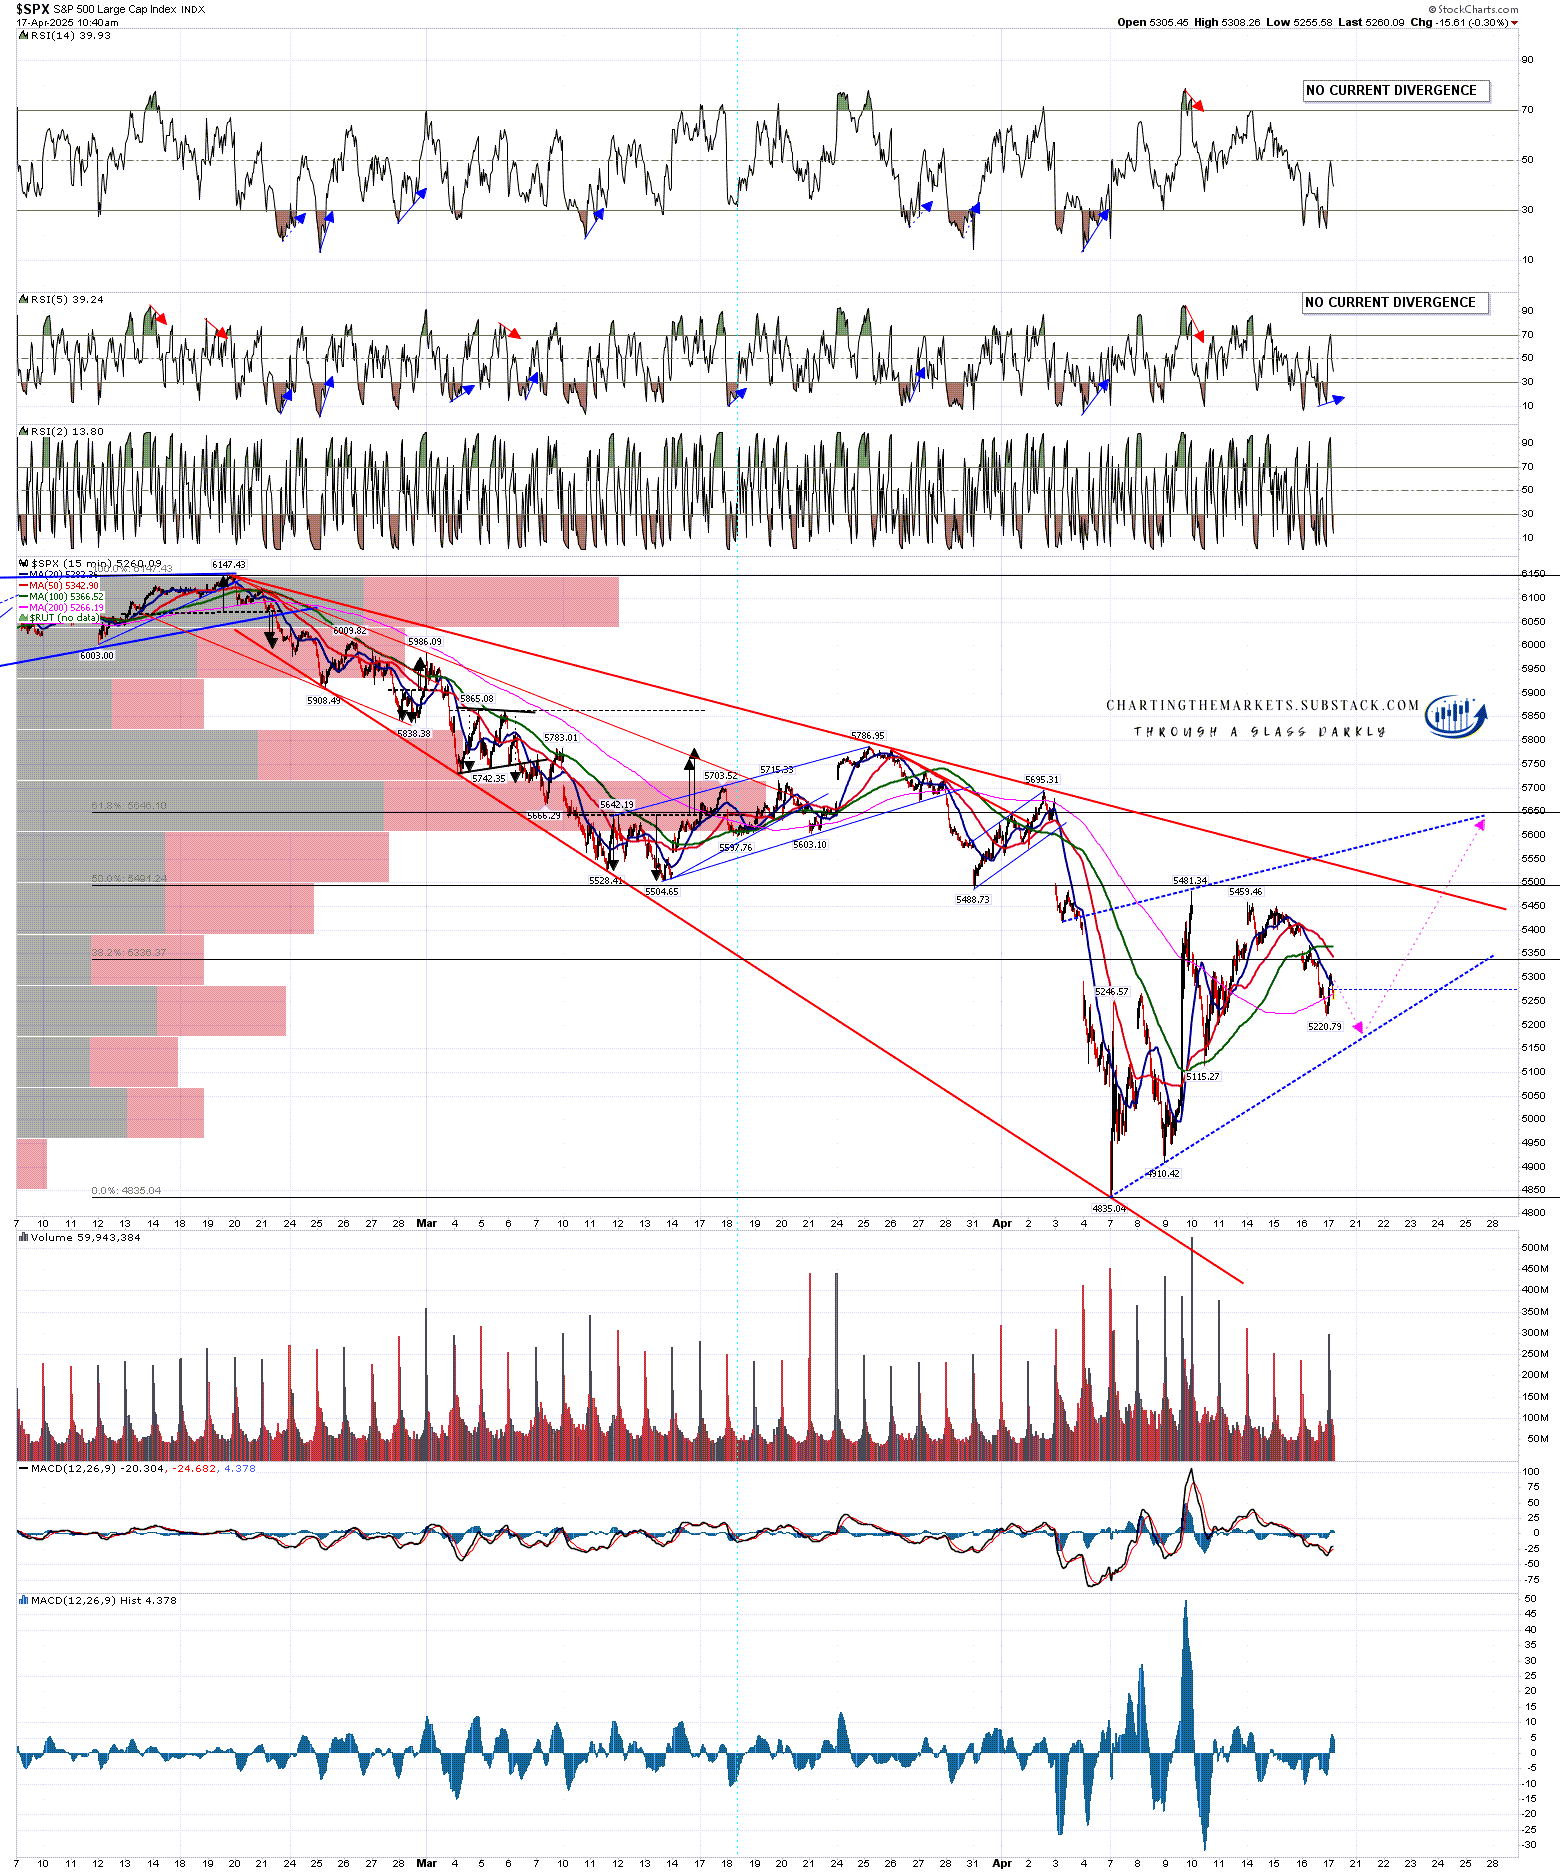
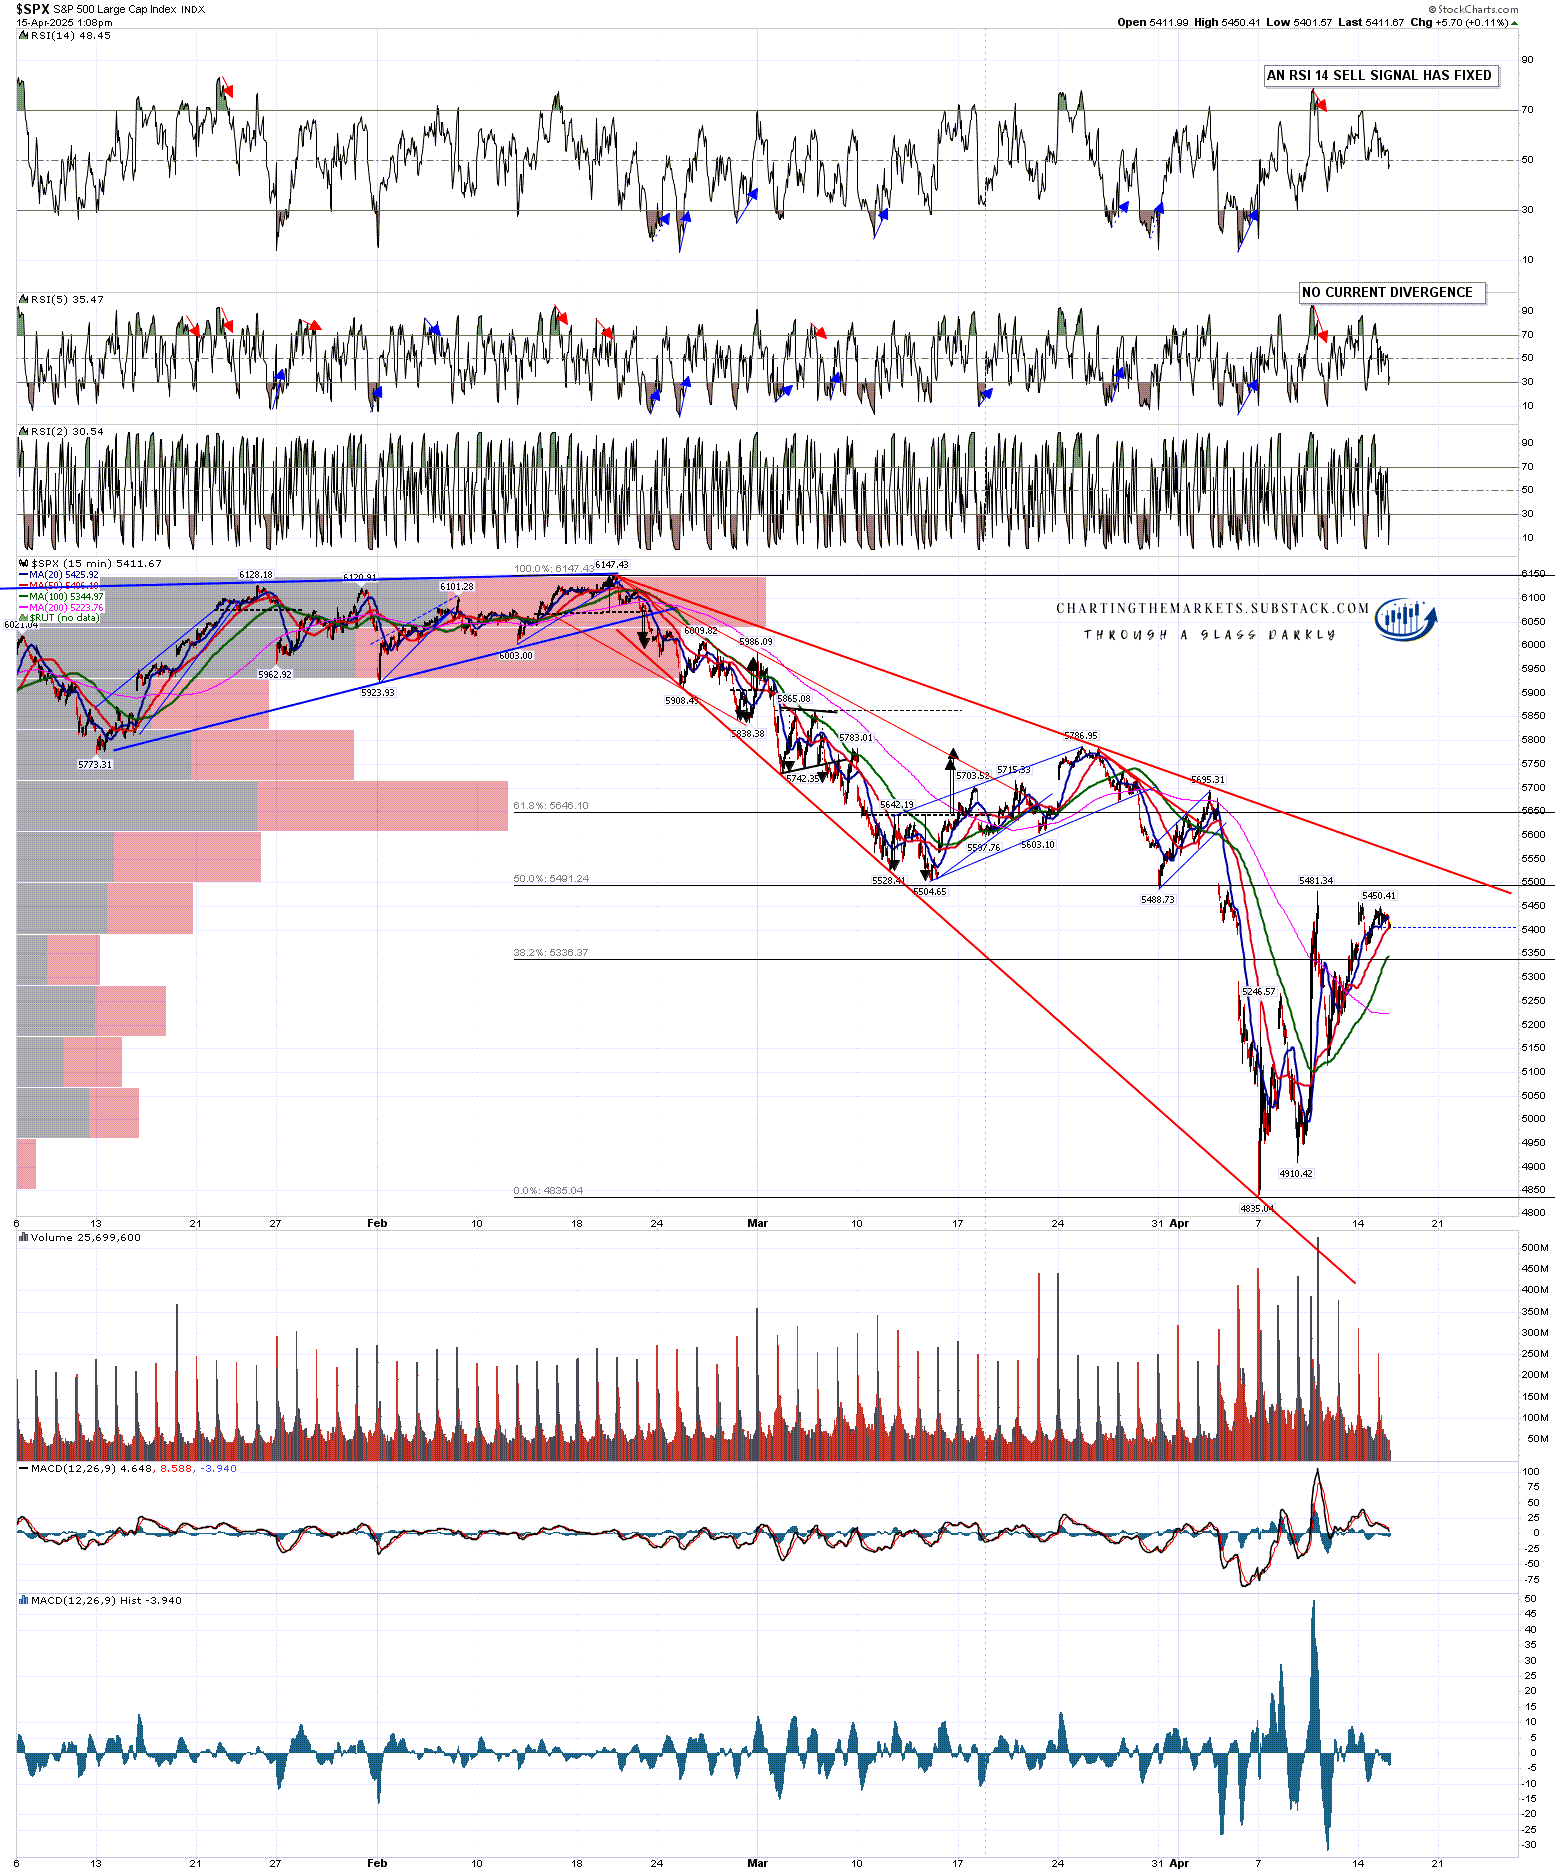
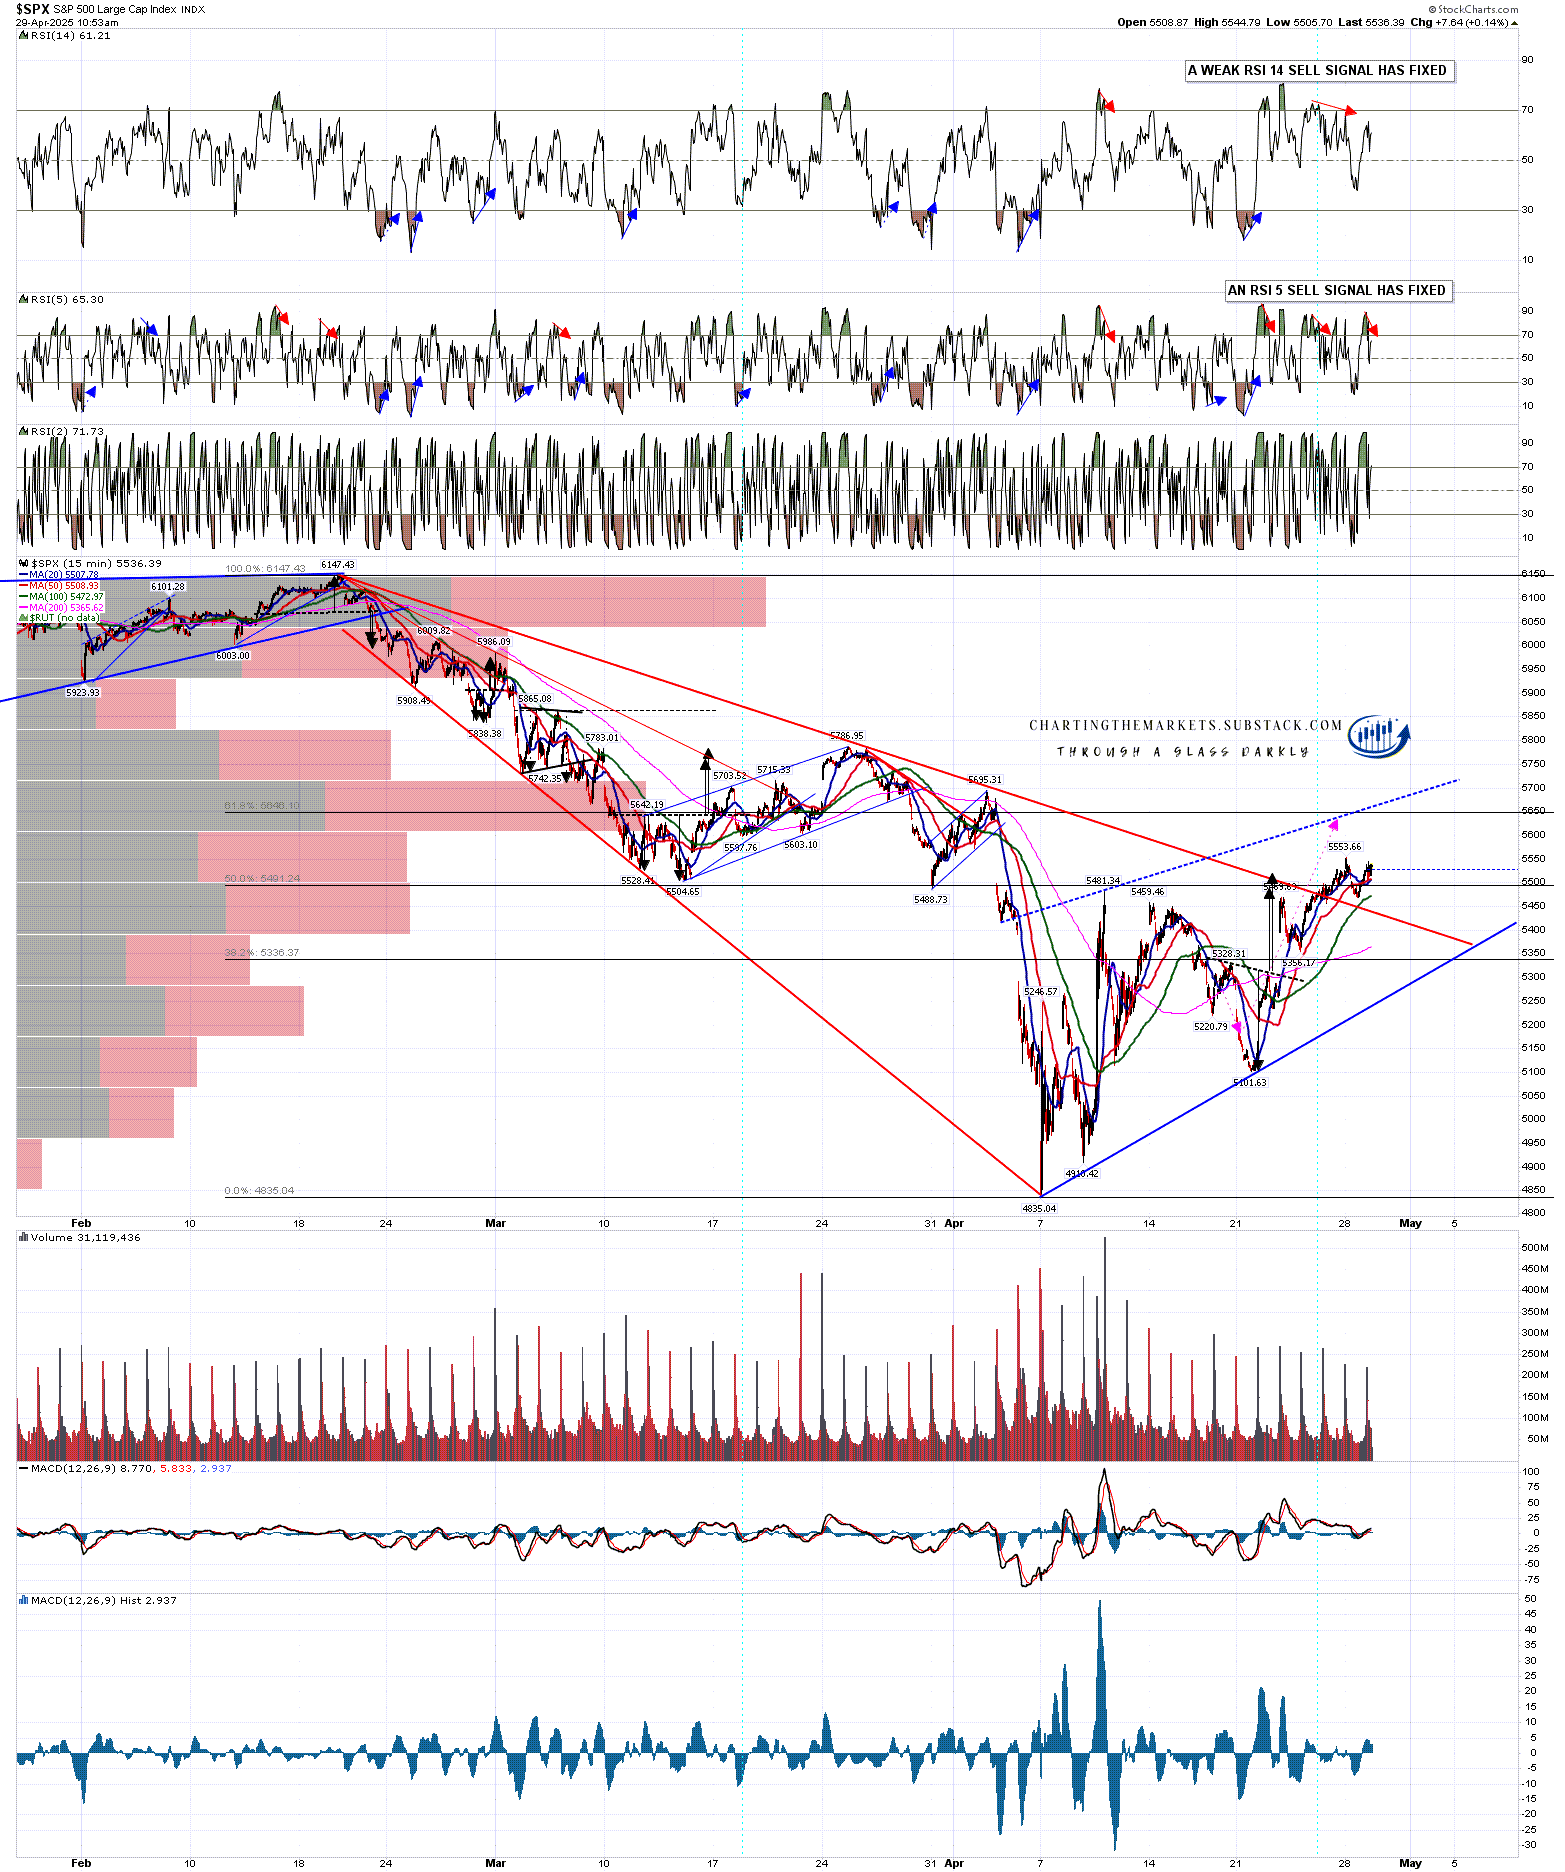
In terms of the ideal bear flag resistance trendline I drew on SPX on 17th April, that’s still looking good and the current rally high is about 110 handles below that (rising) trendline. I think that trendline may well be hit in the next few days and that SPX may well find resistance there. On the 15min chart a weak RSI 14 sell signal and a full RSI 5 sell signal has fixed and there is also a fixed weak hourly sell signal on ES.
SPX 15min chart:
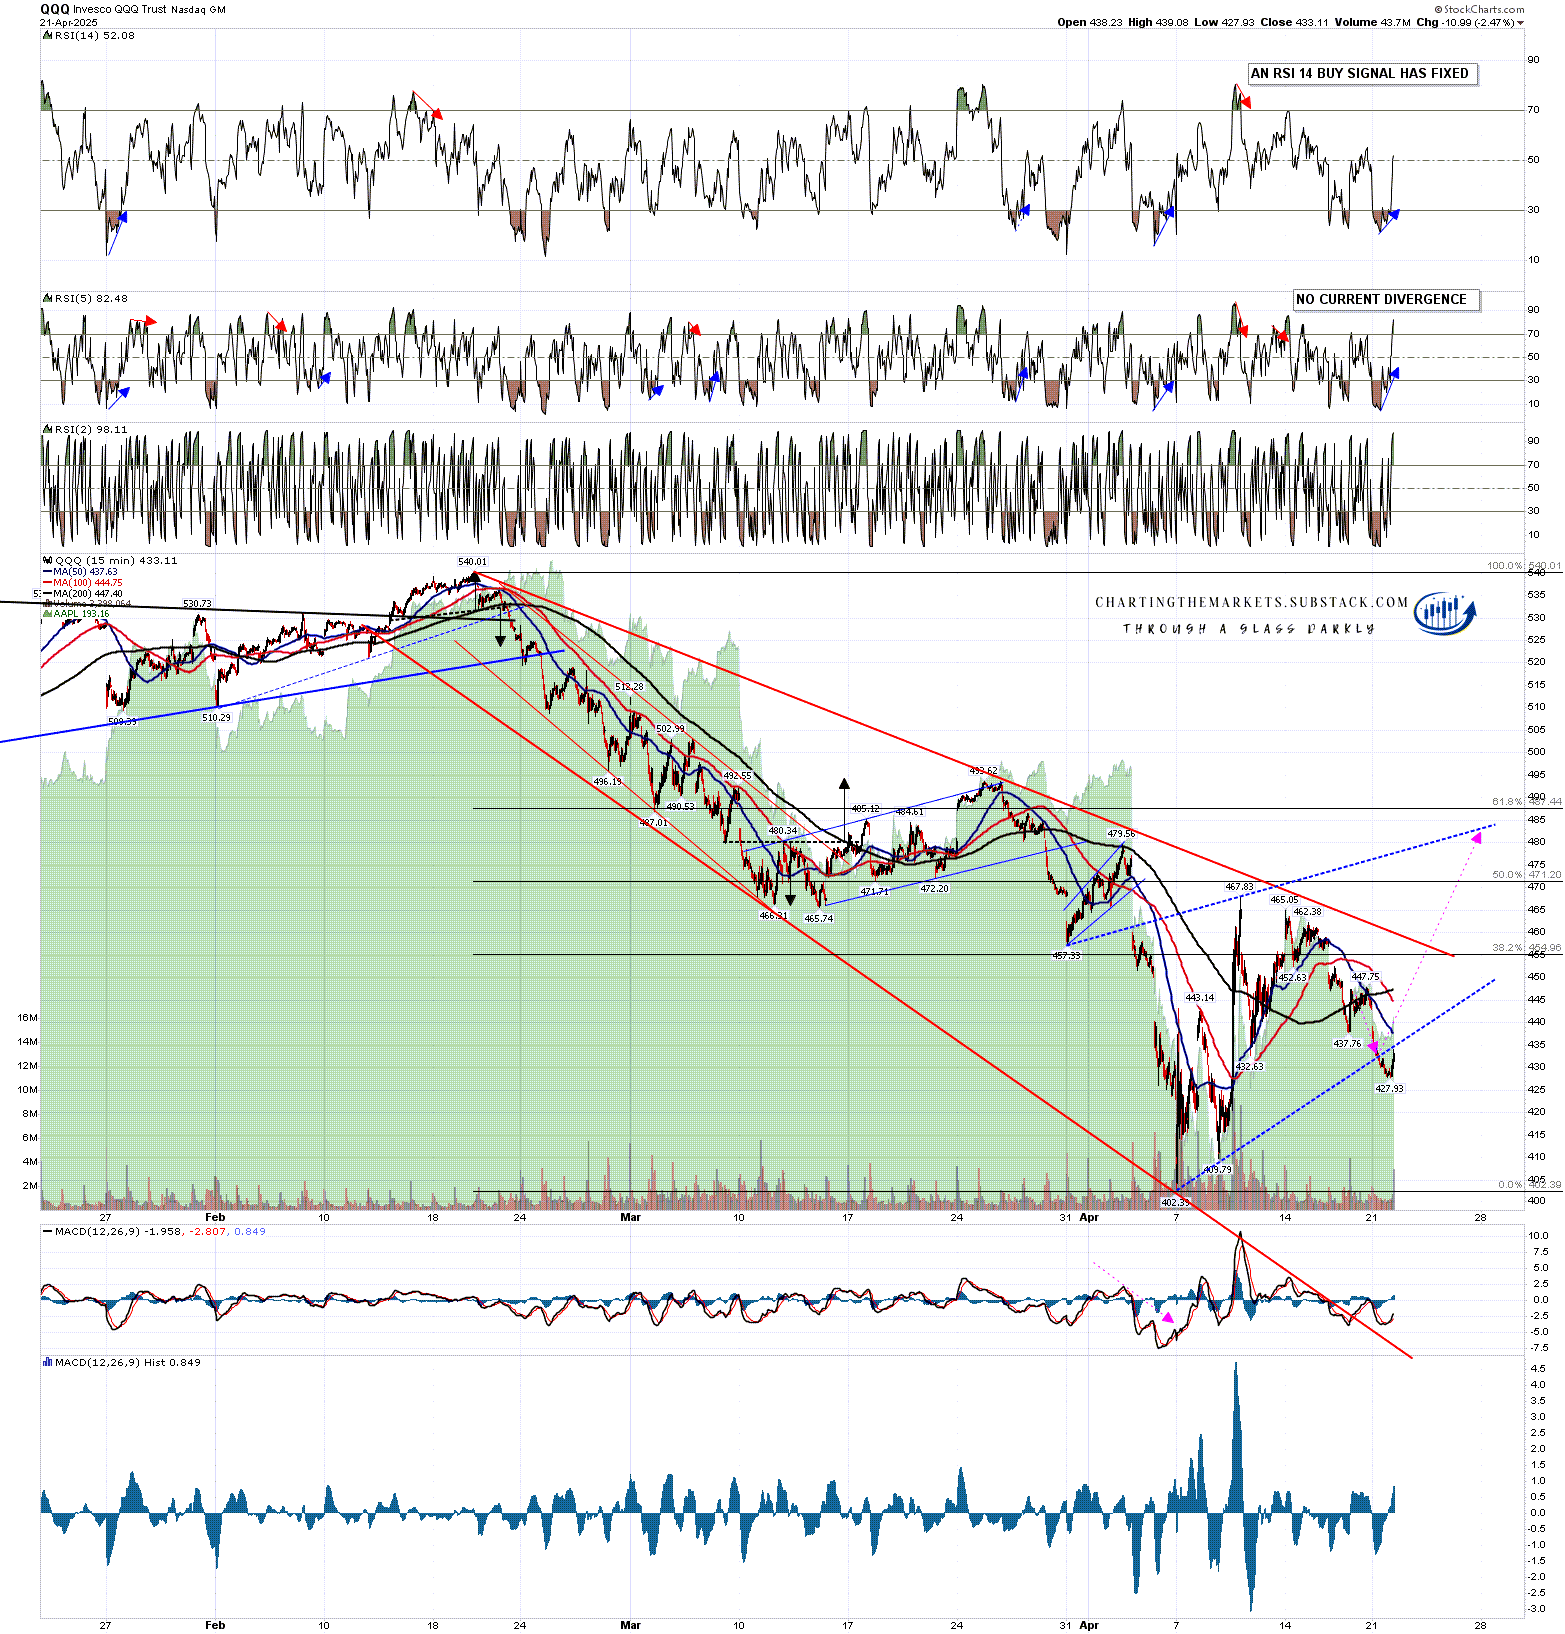
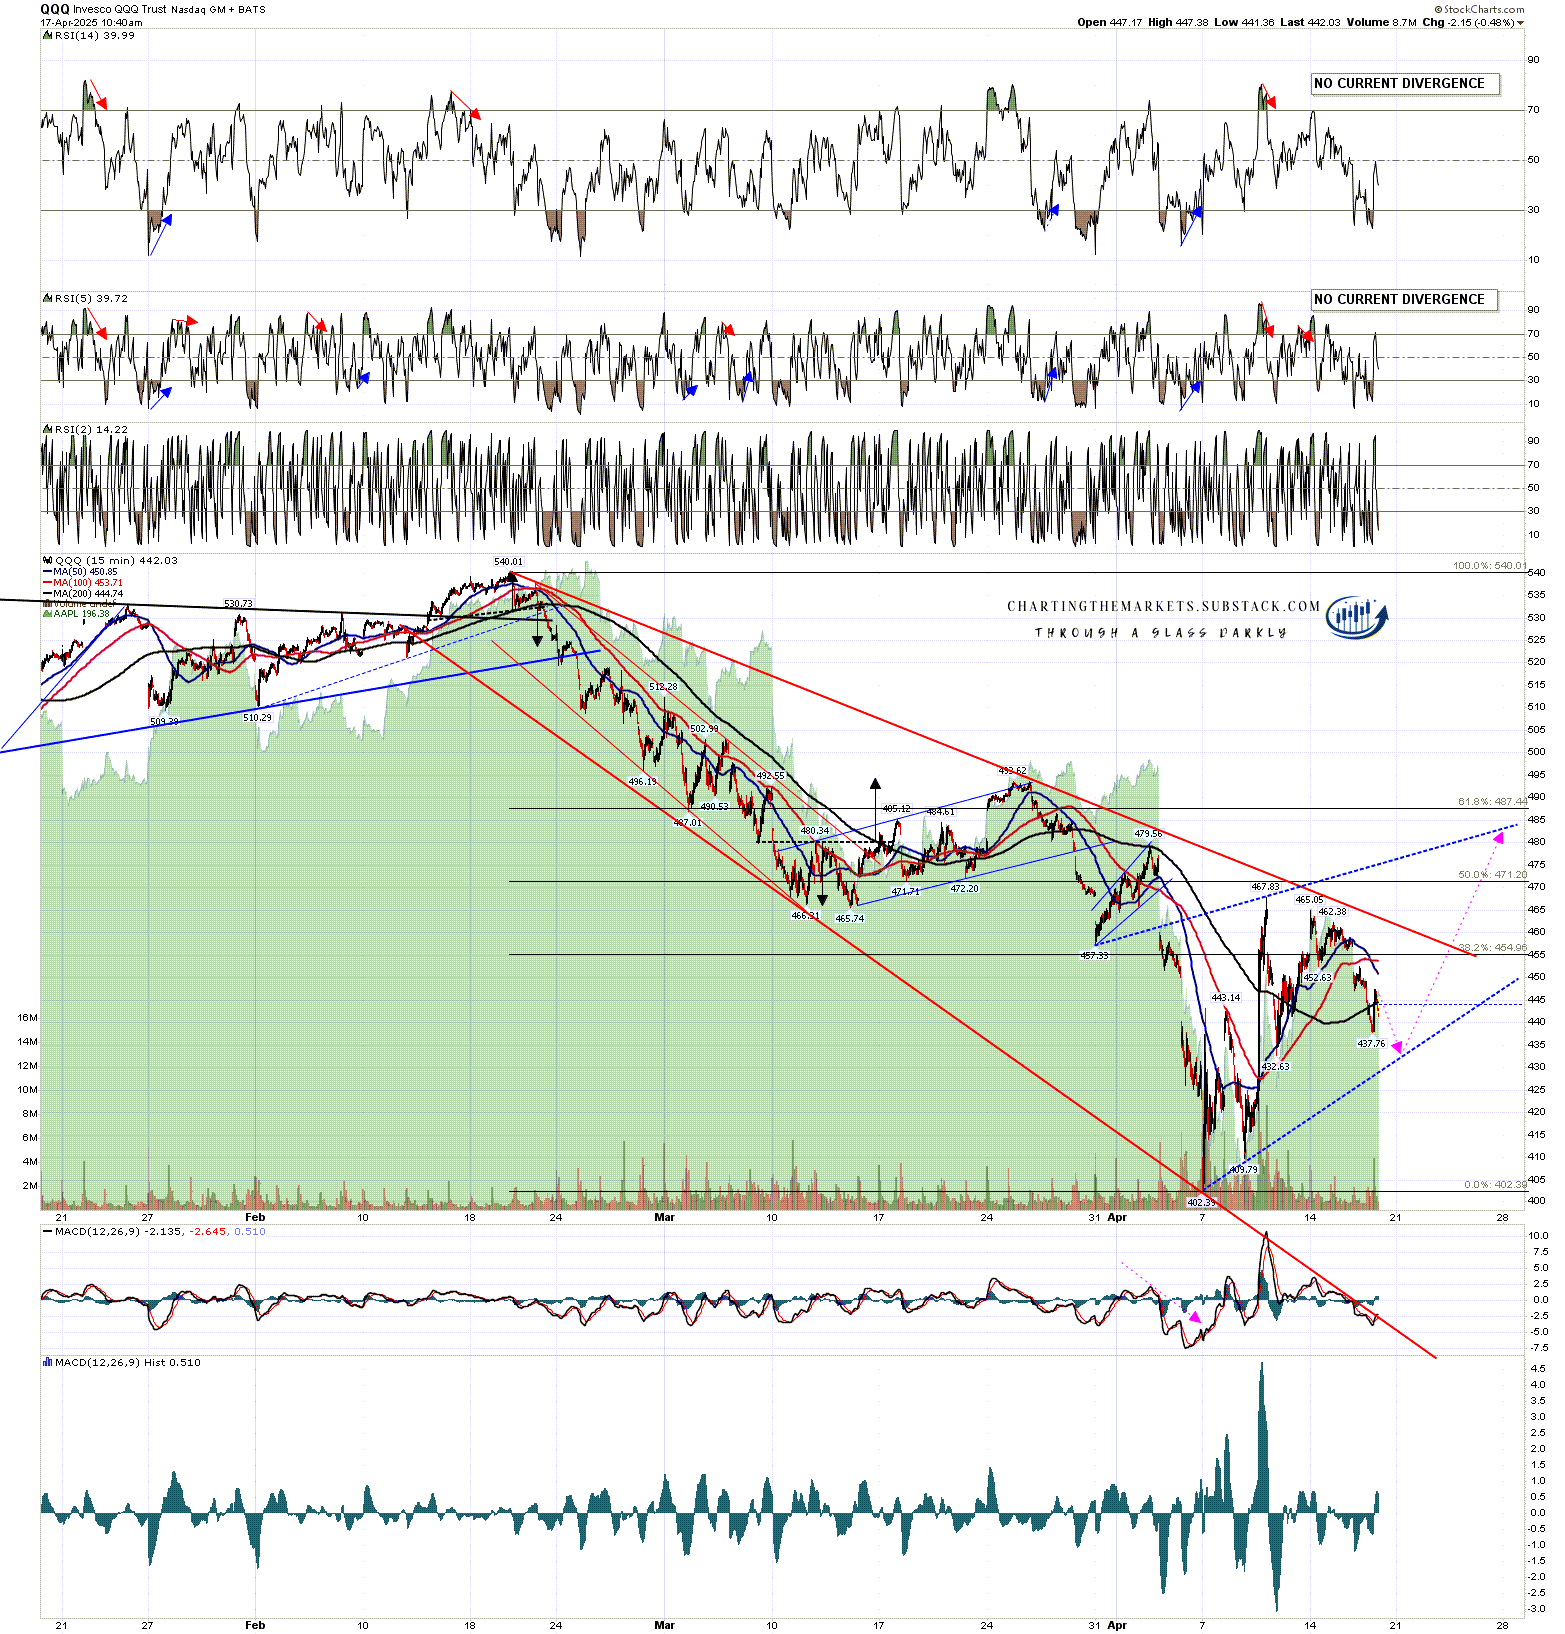
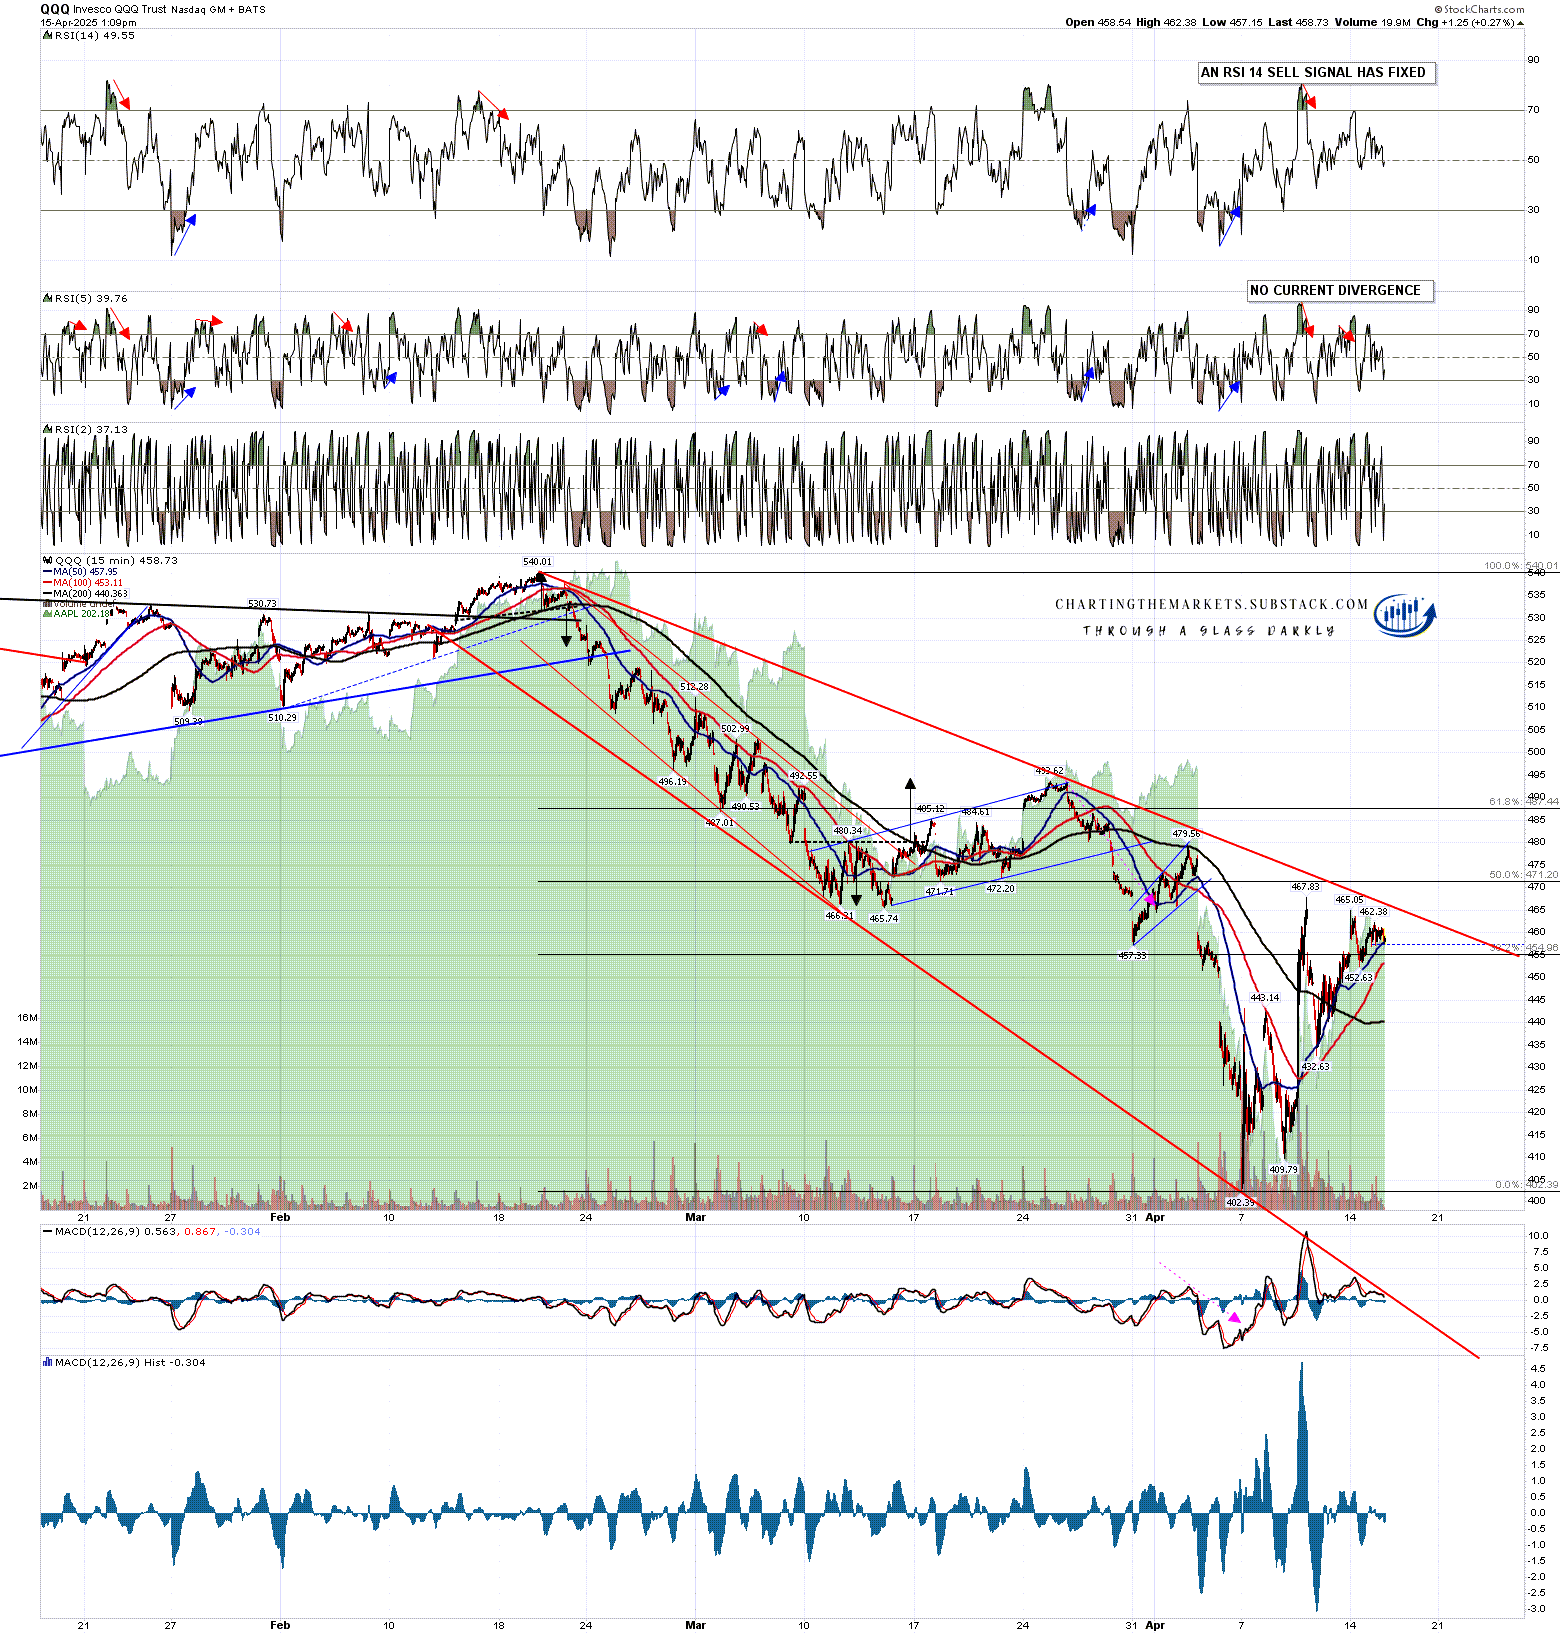
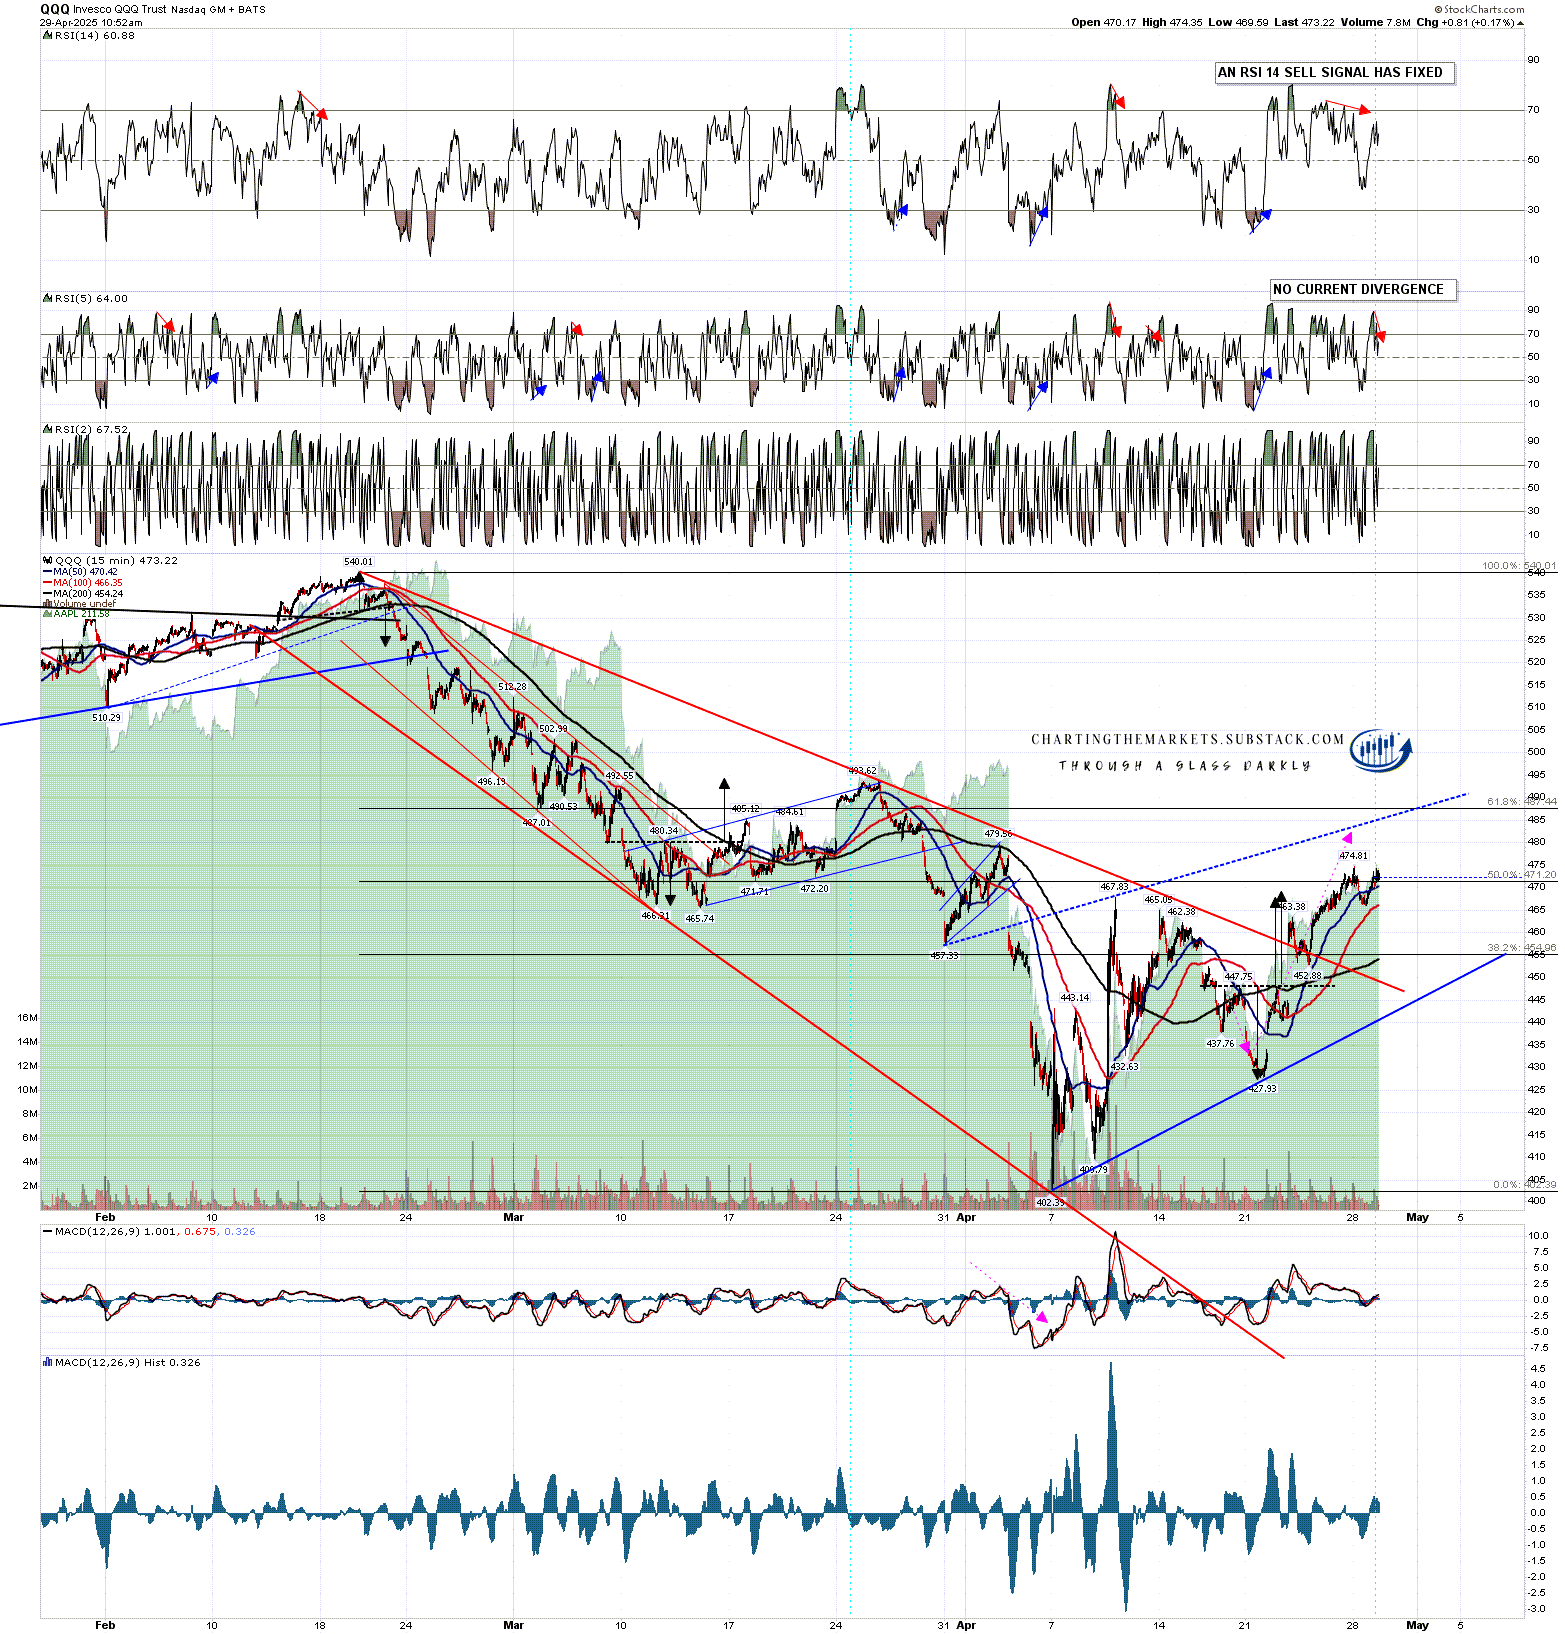
In terms of the ideal bear flag resistance trendline I drew on QQQ on 17th April, that’s still looking good and the current rally high is about ten handles below that (rising) trendline. On the 15min chart an both RSI 14 and RSI 5 sell signals have fixed and there is also a fixed hourly sell signal on NQ.
QQQ 15min chart:
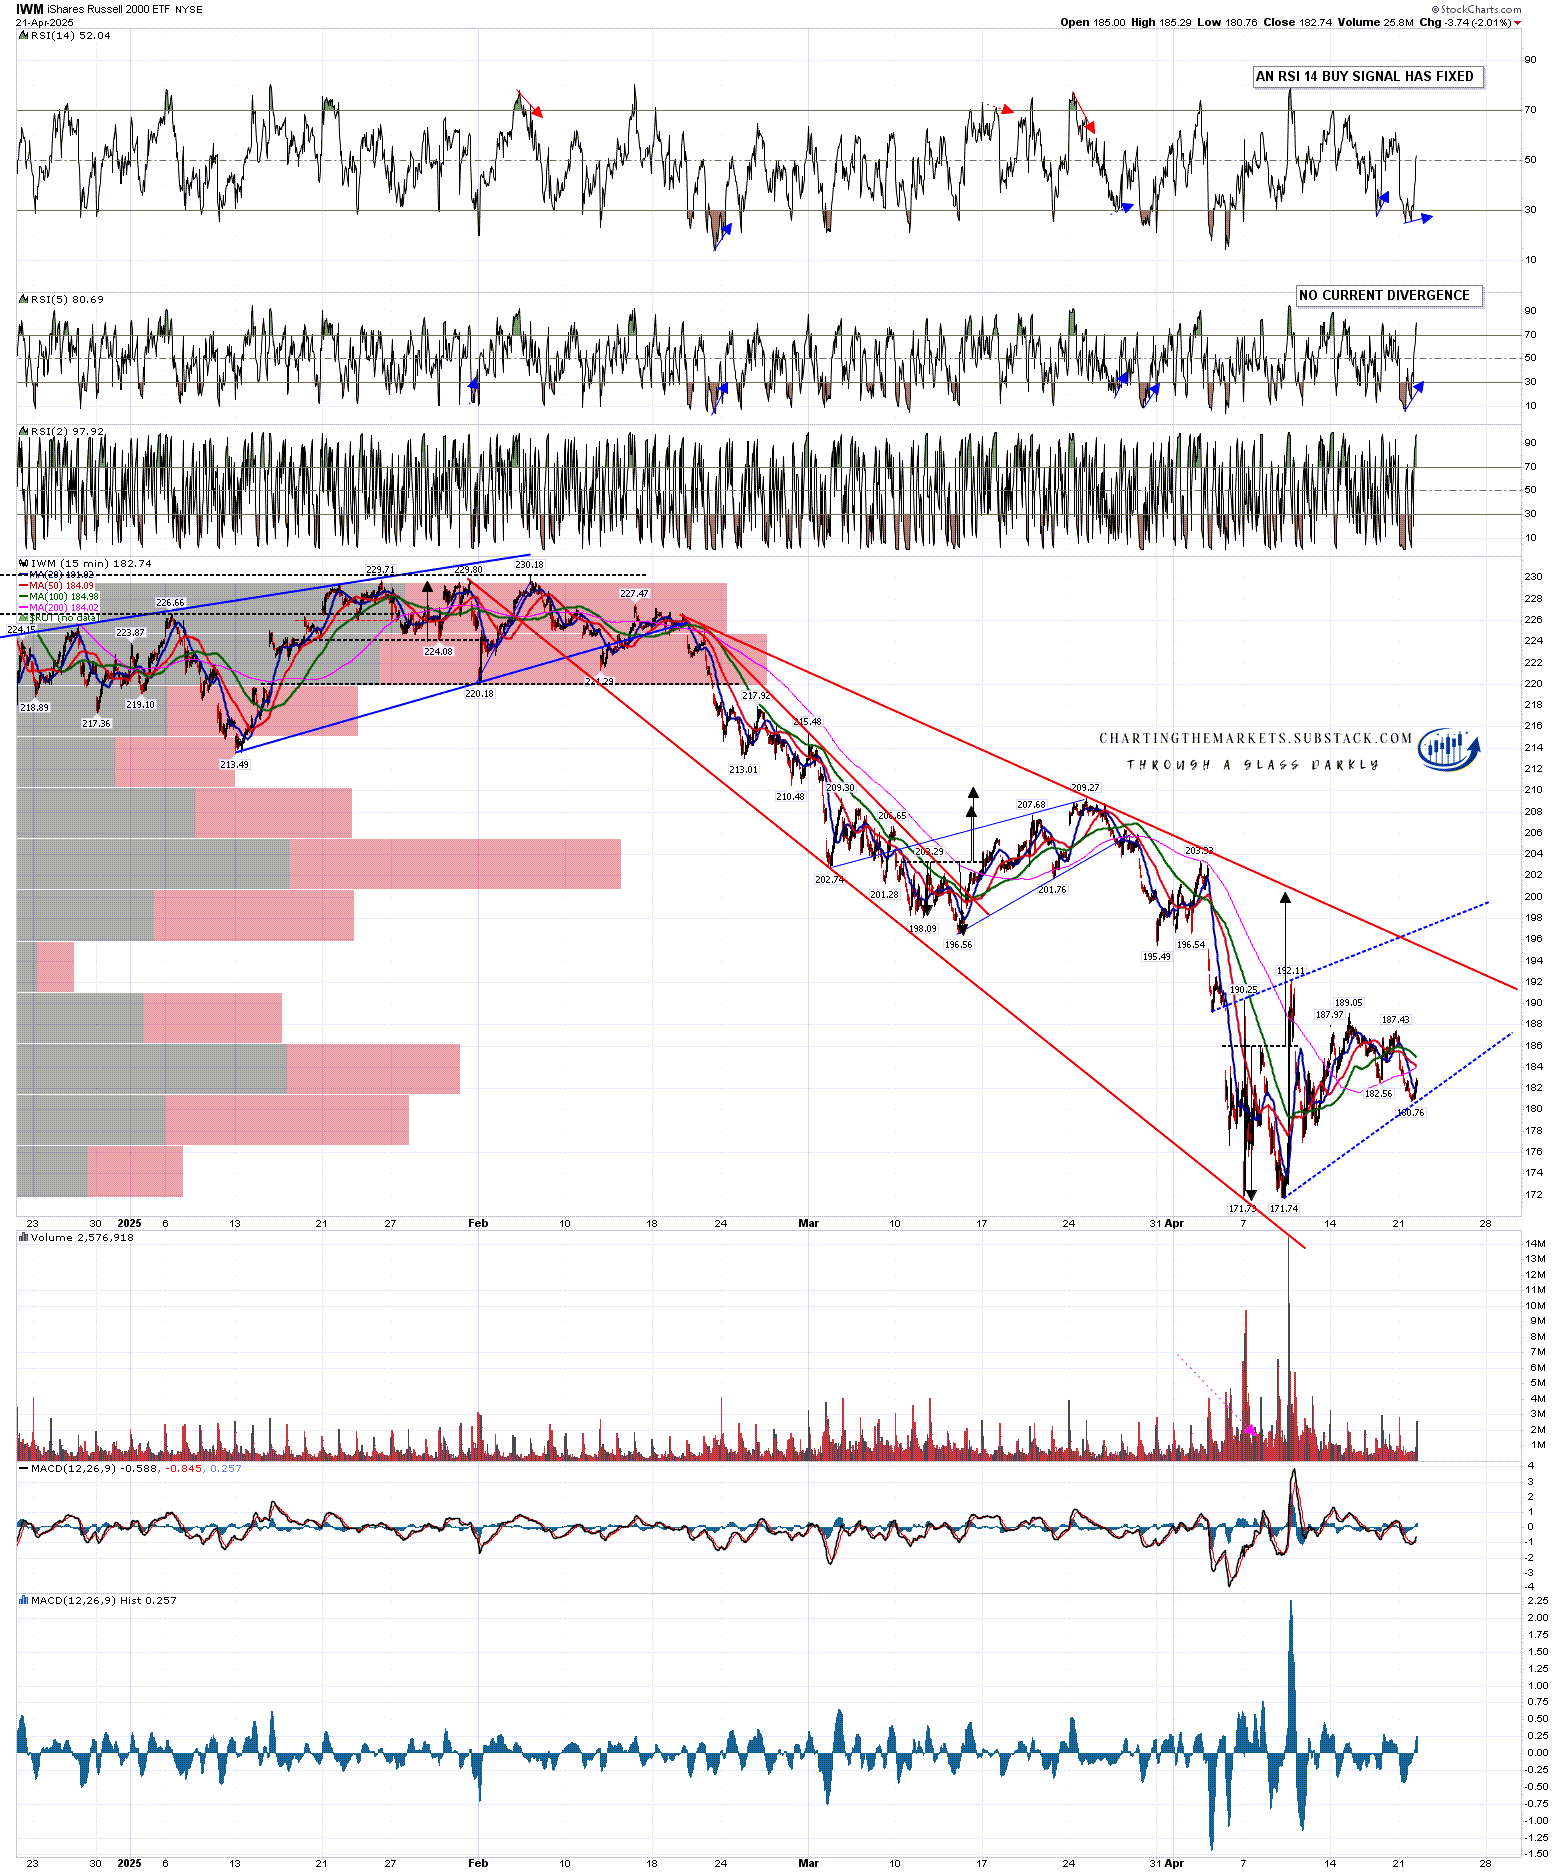
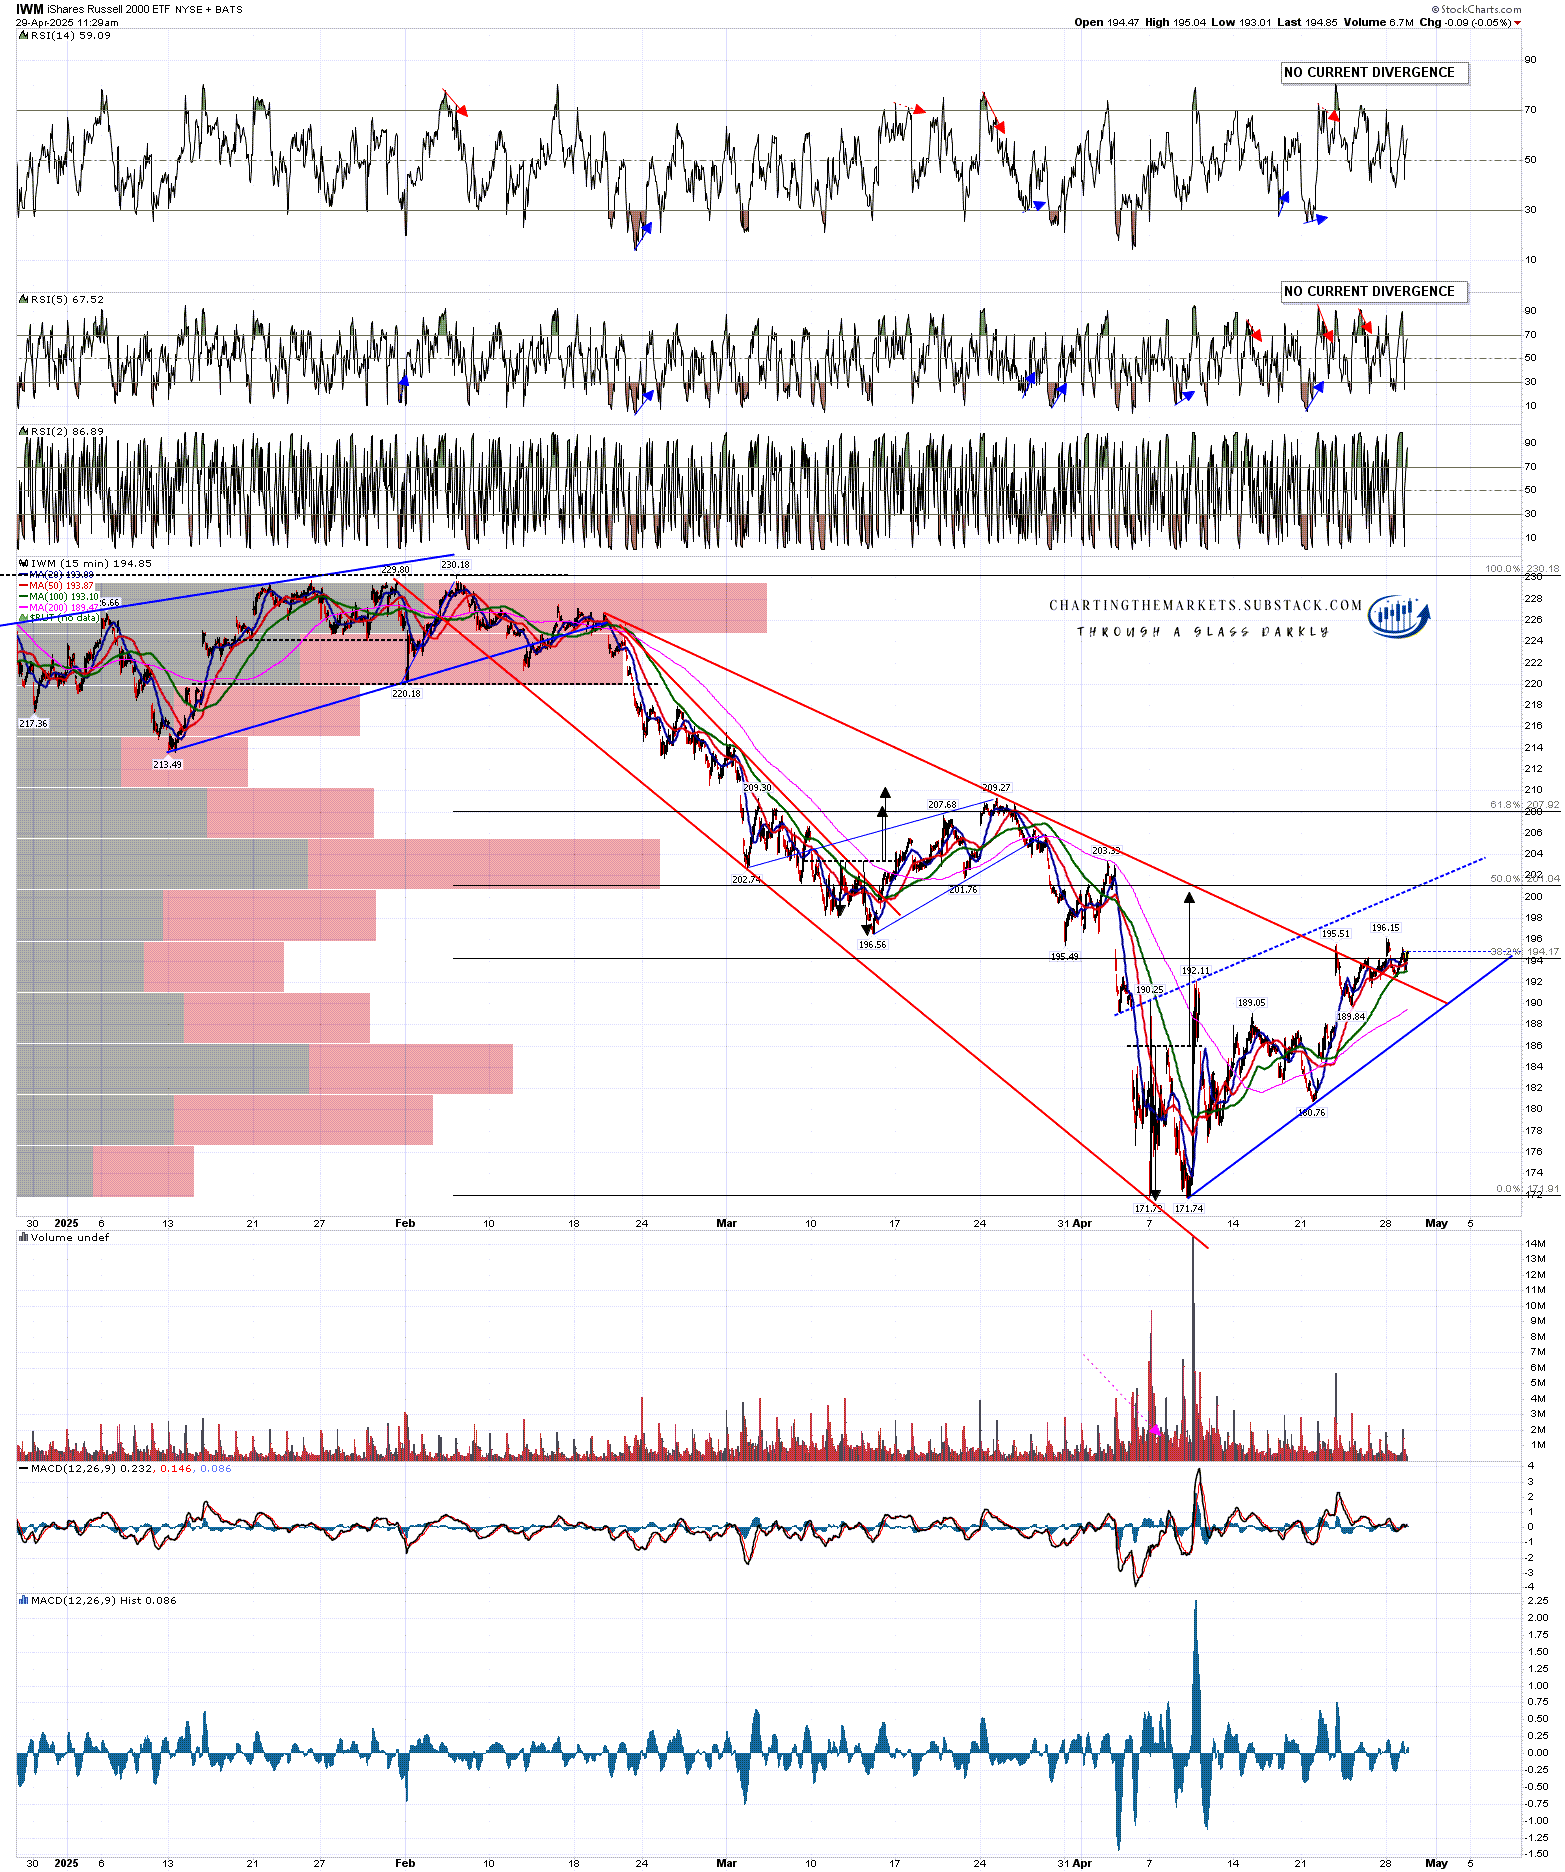
In terms of the ideal bear flag resistance trendline I drew on IWM on 17th April, that’s still looking good and the current rally high is about six handles below that (rising) trendline.
IWM 15min chart:
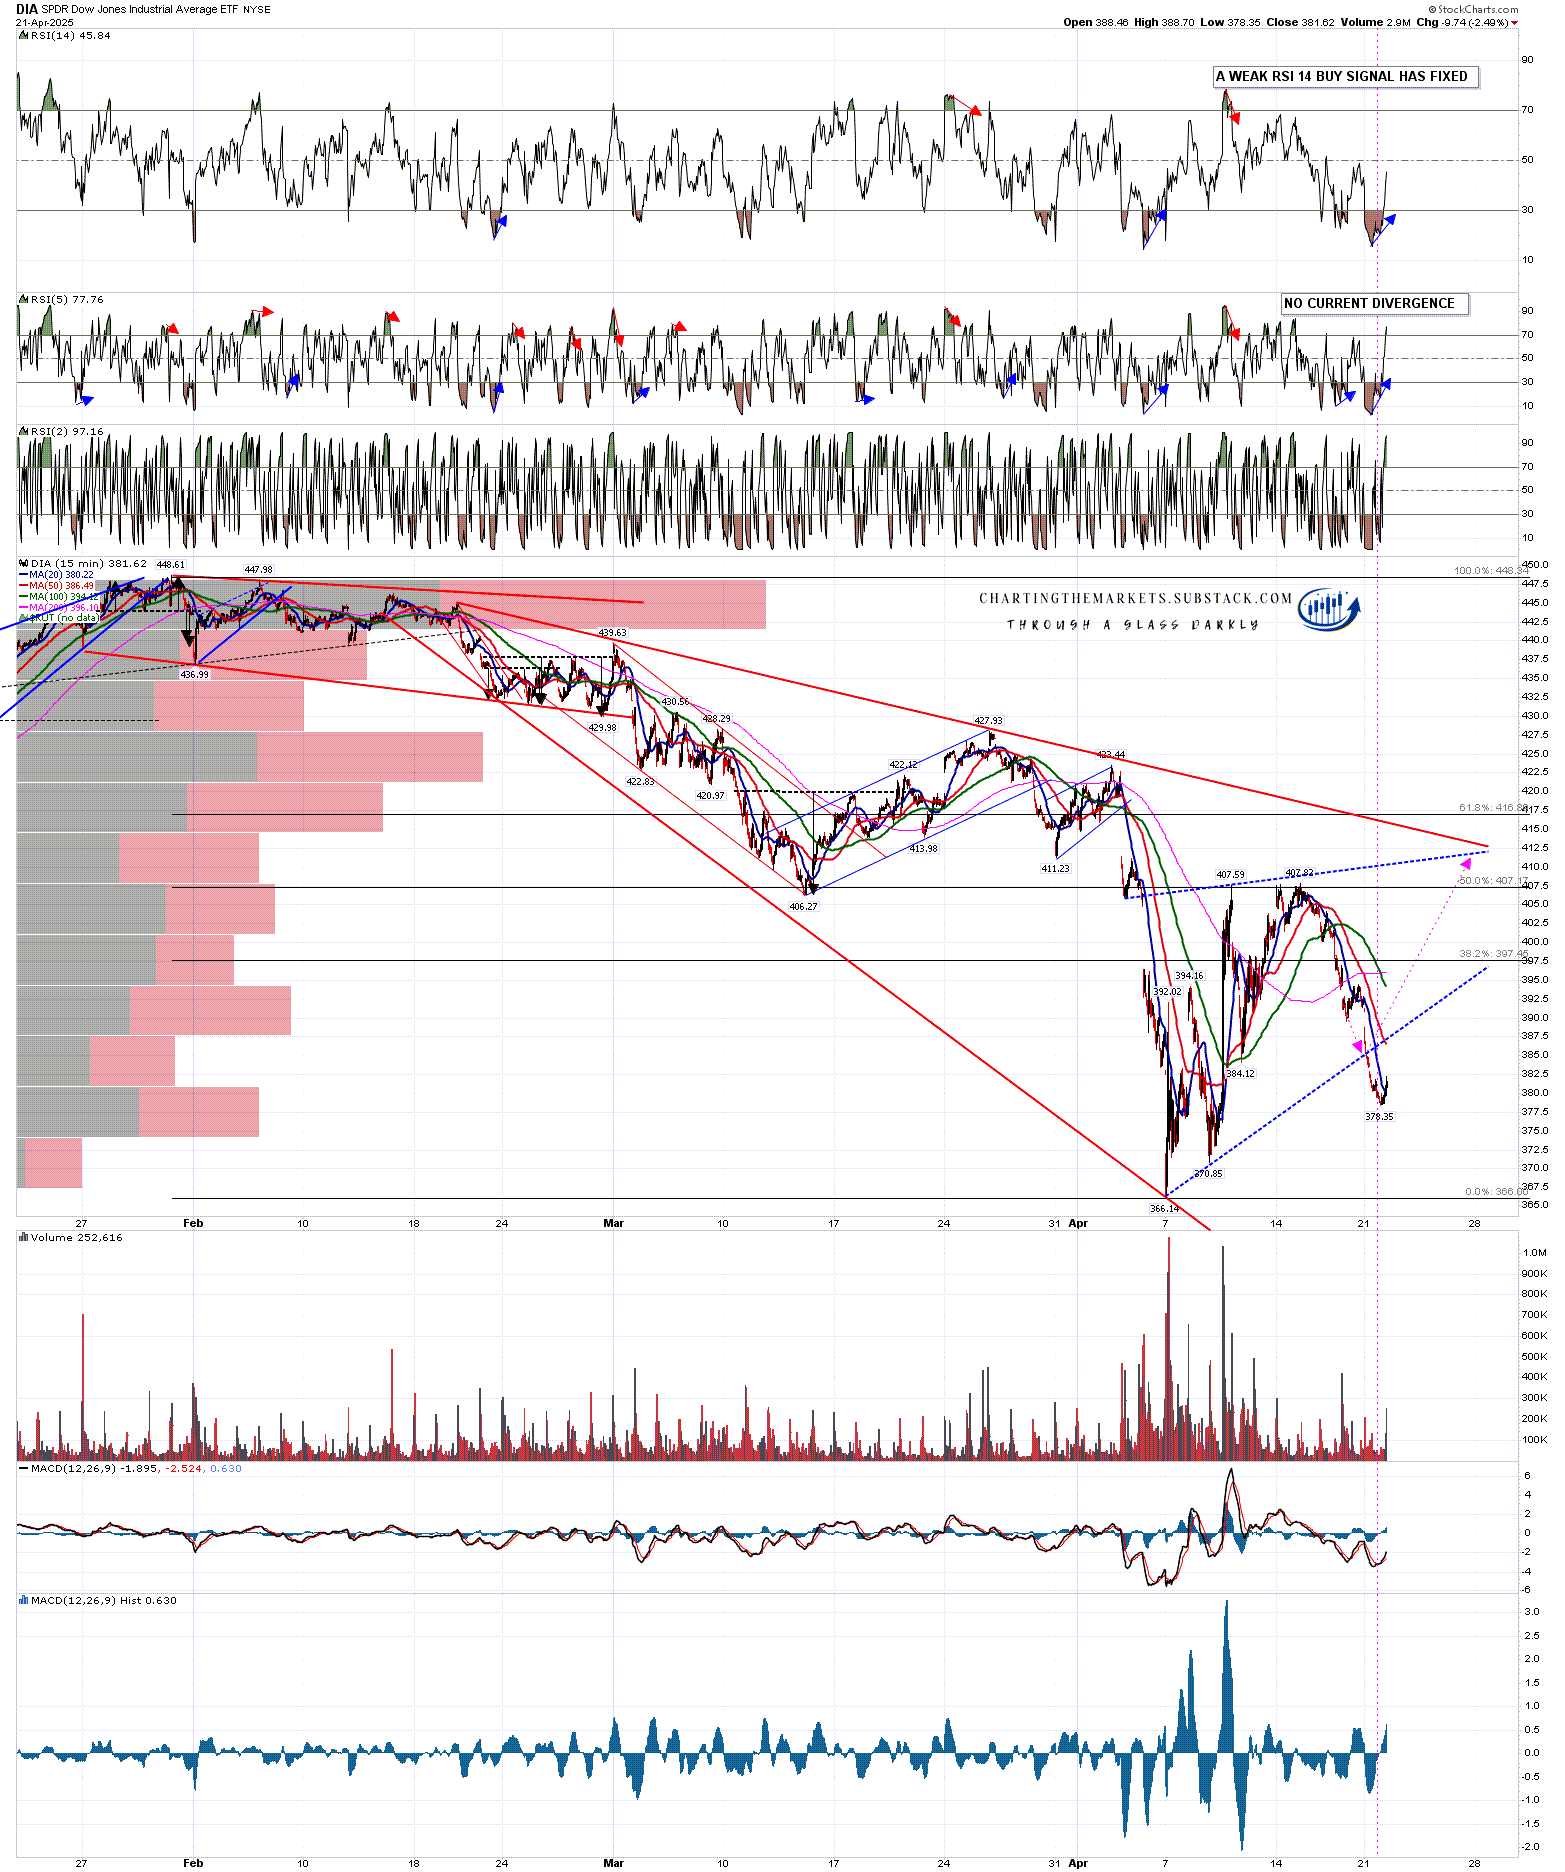
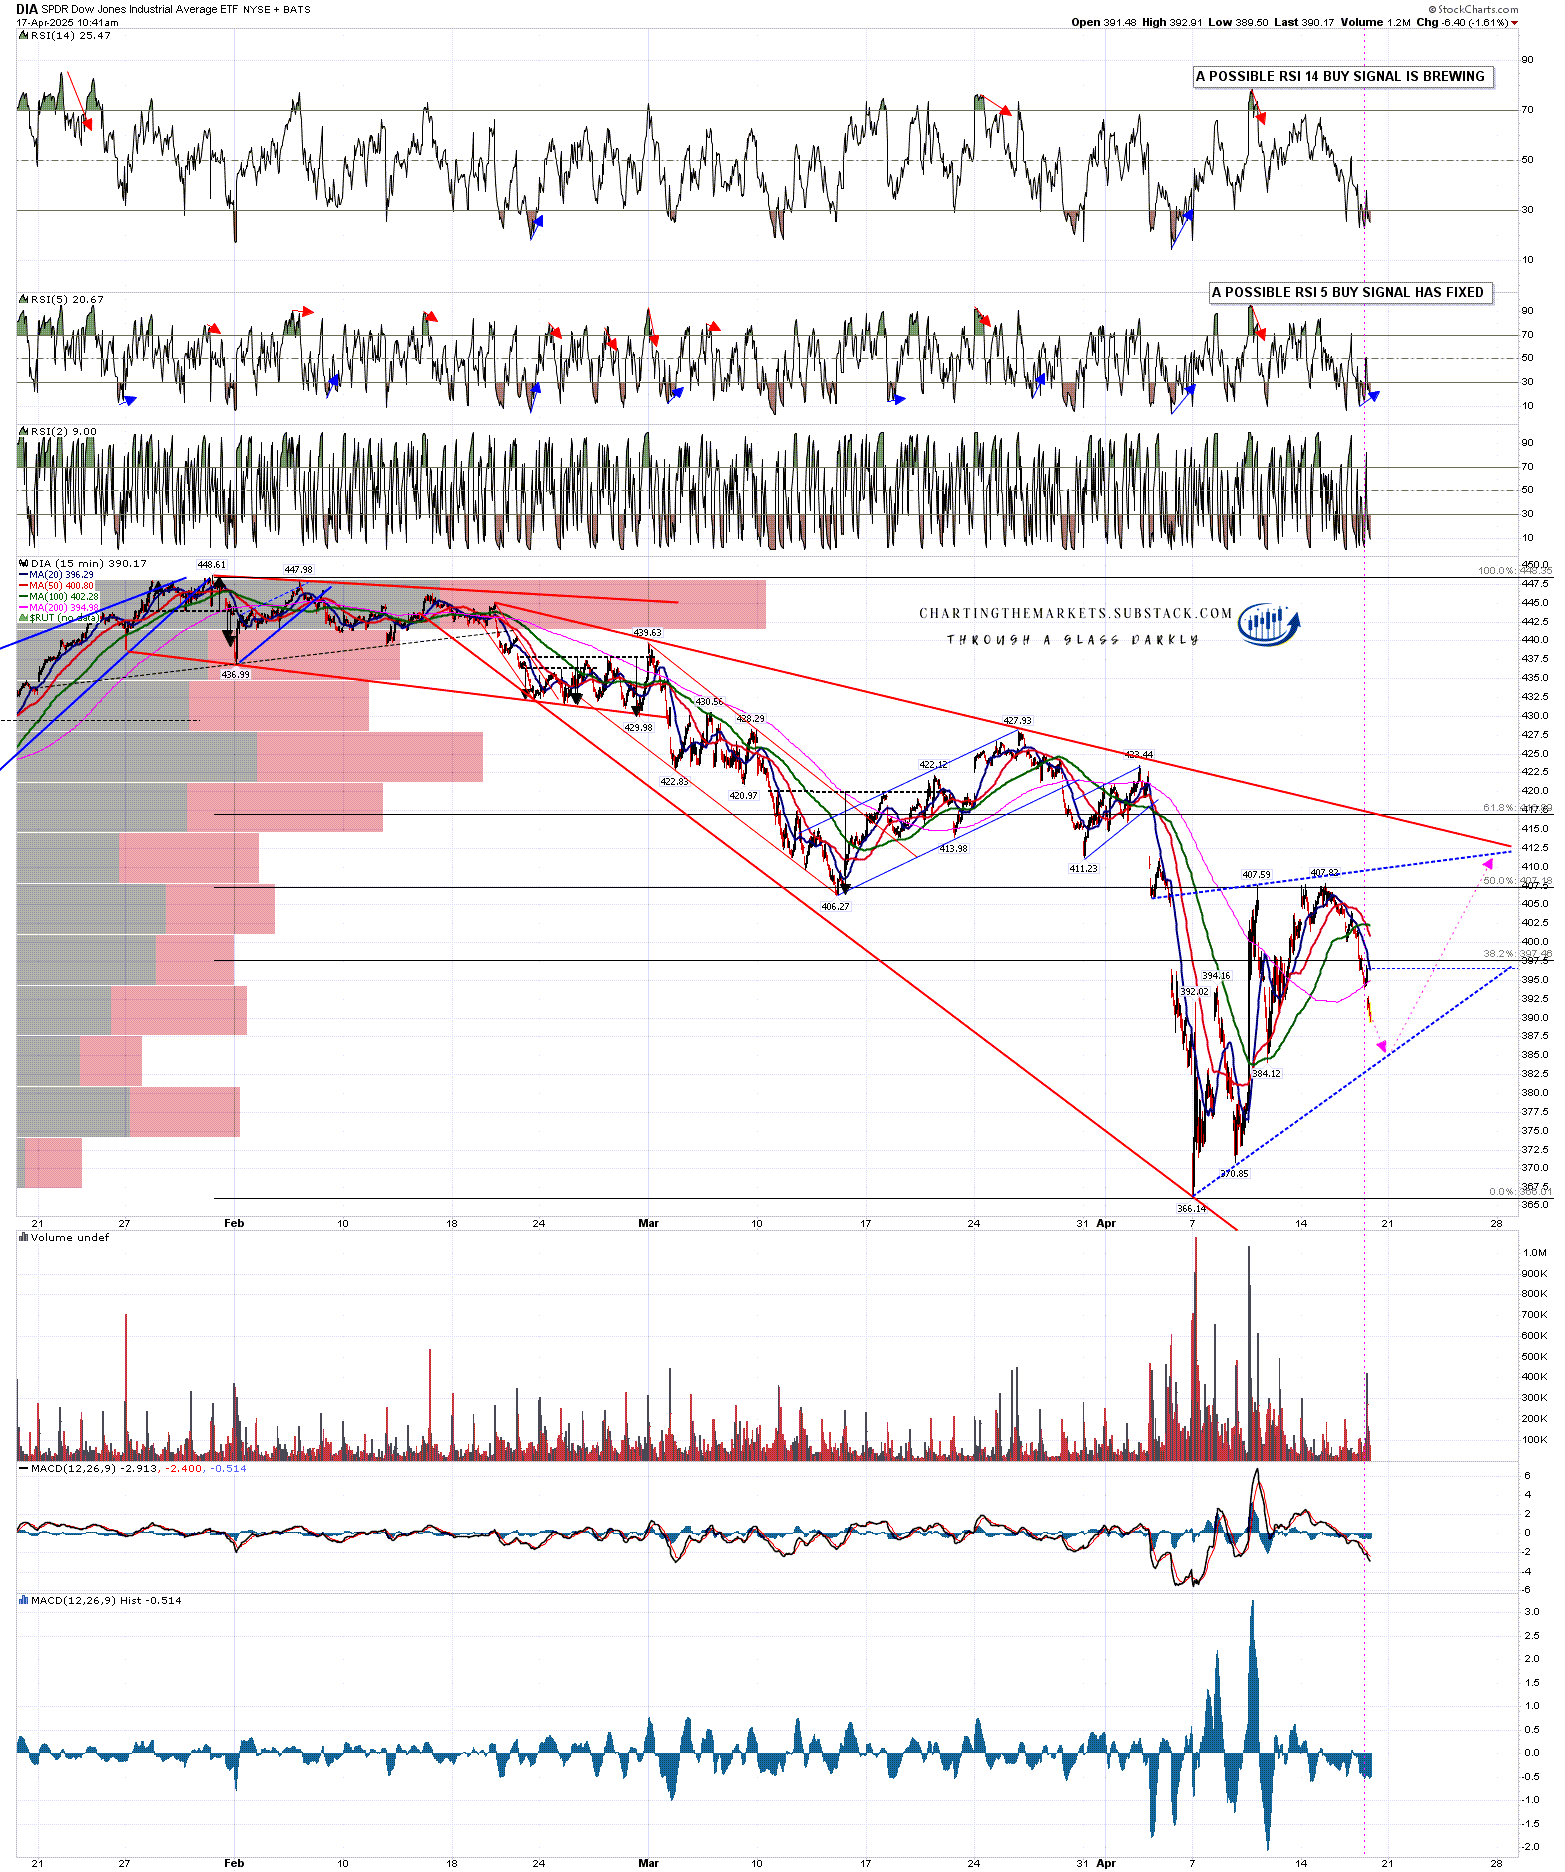
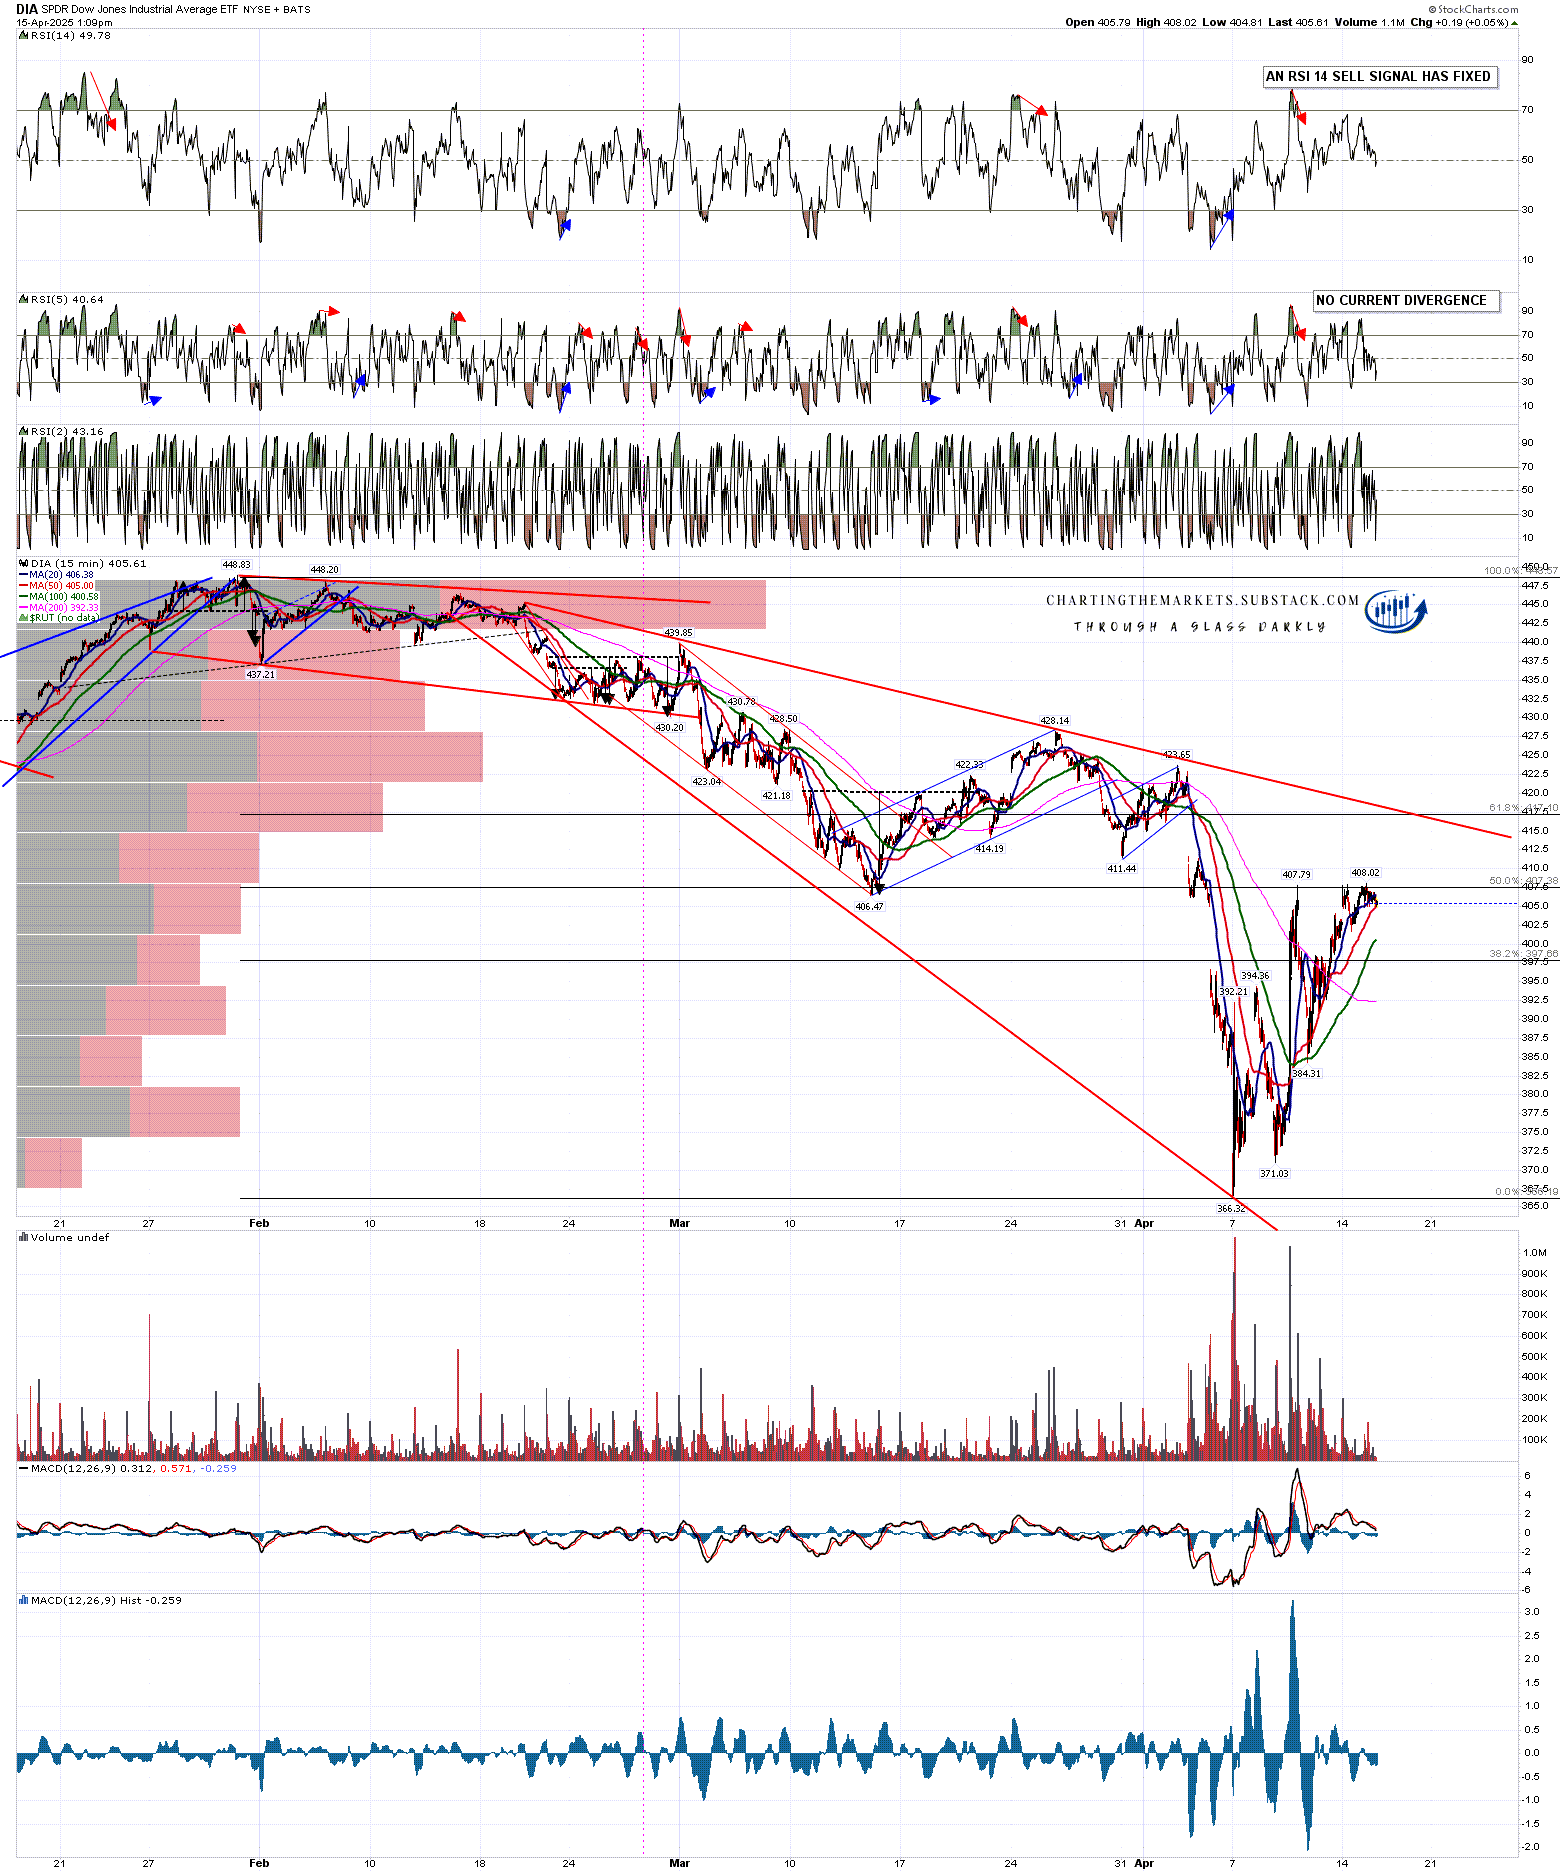
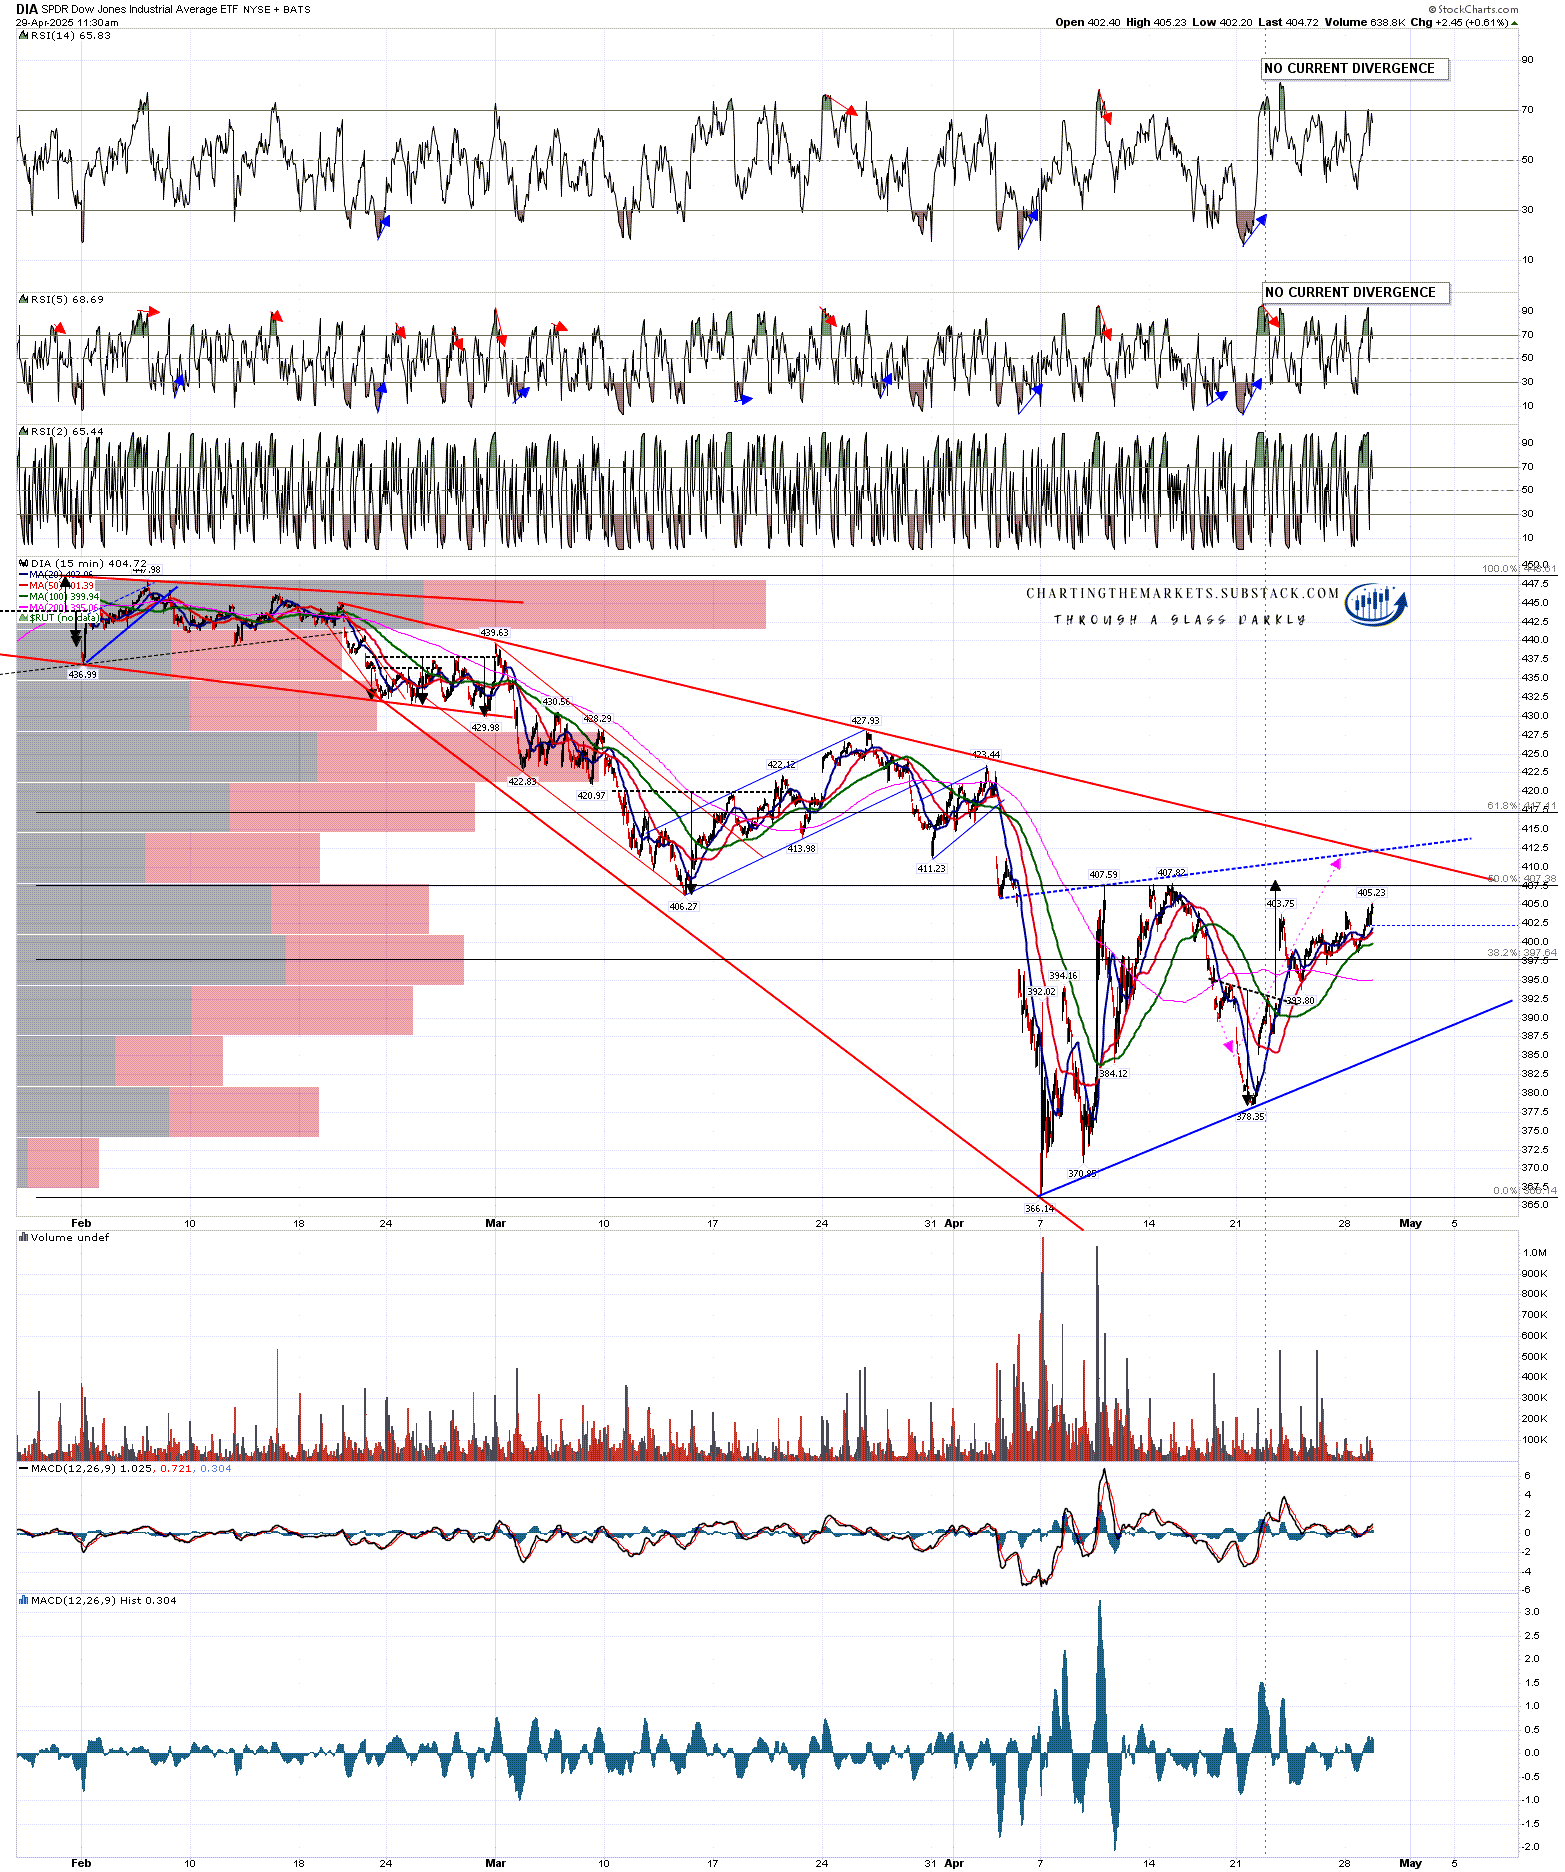
In terms of the ideal bear flag resistance trendline I drew on DIA on 17th April, that’s still looking good and the current rally high is about four handles below that (rising) trendline.
DIA 15min chart:
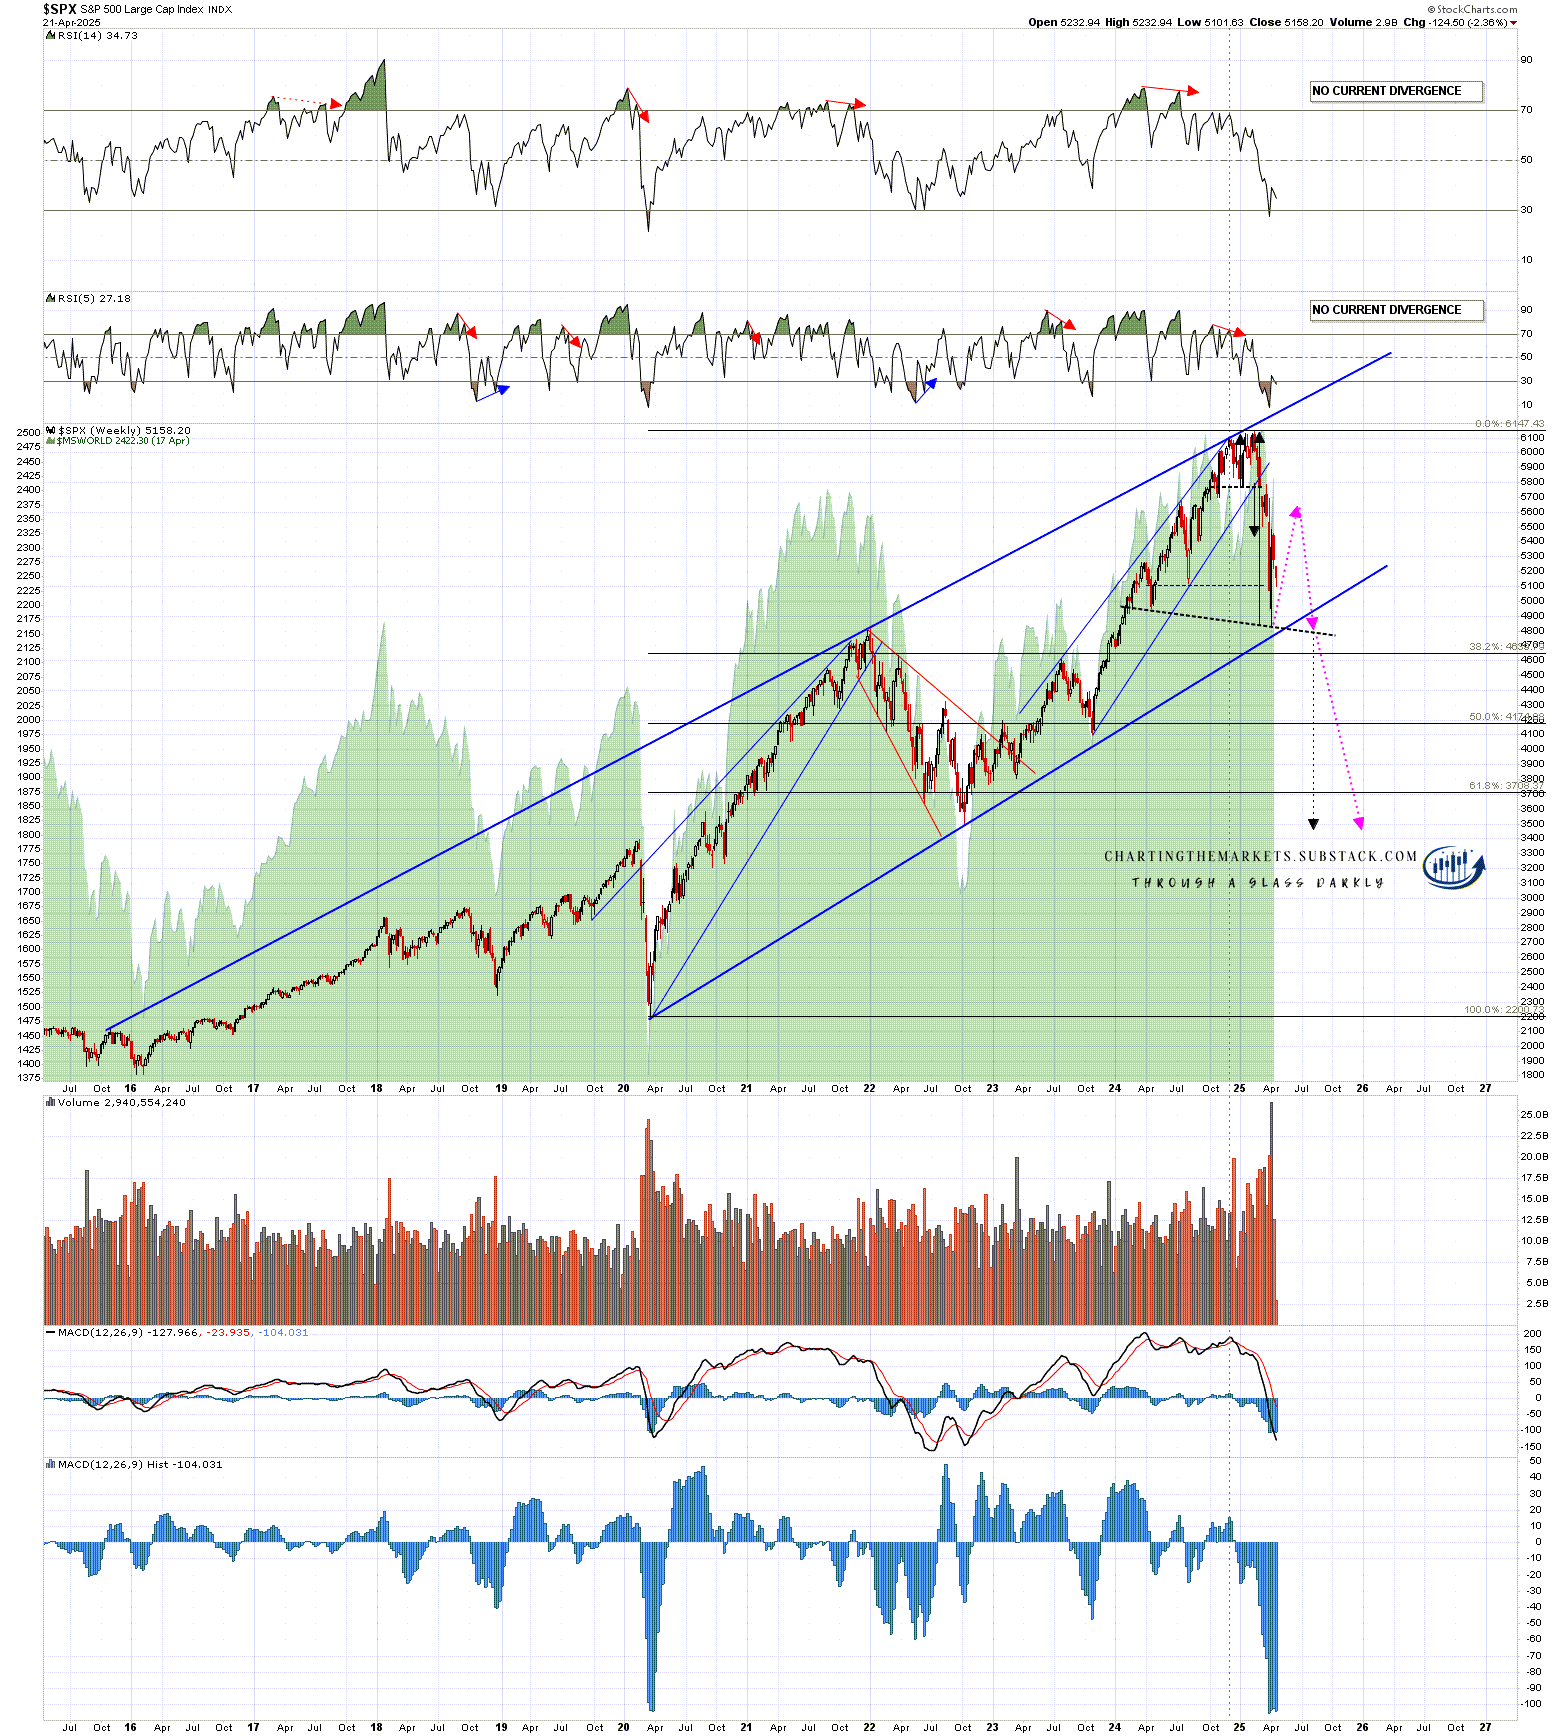
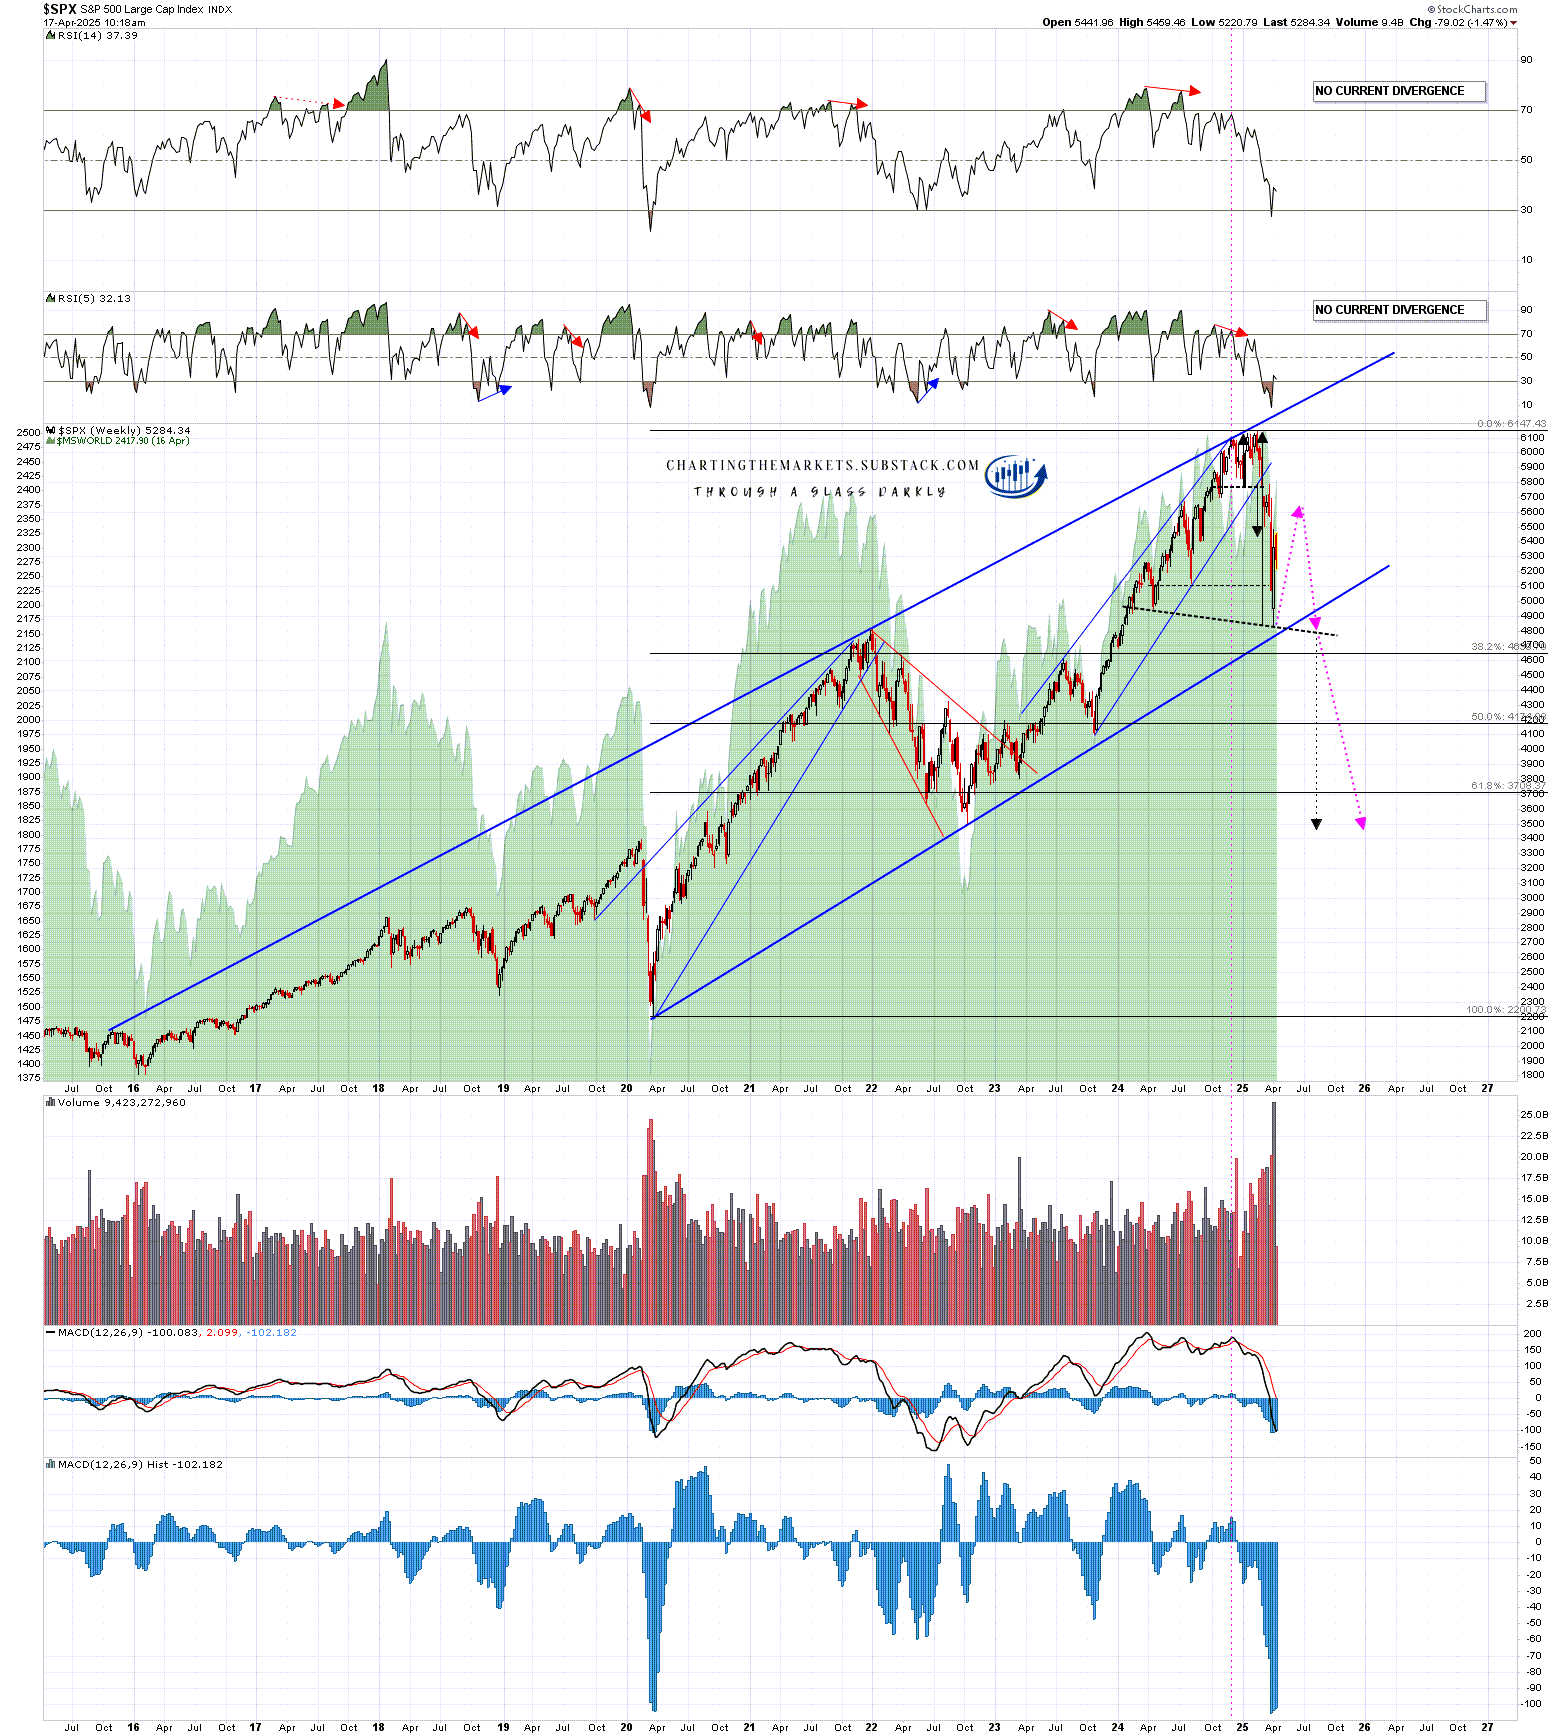
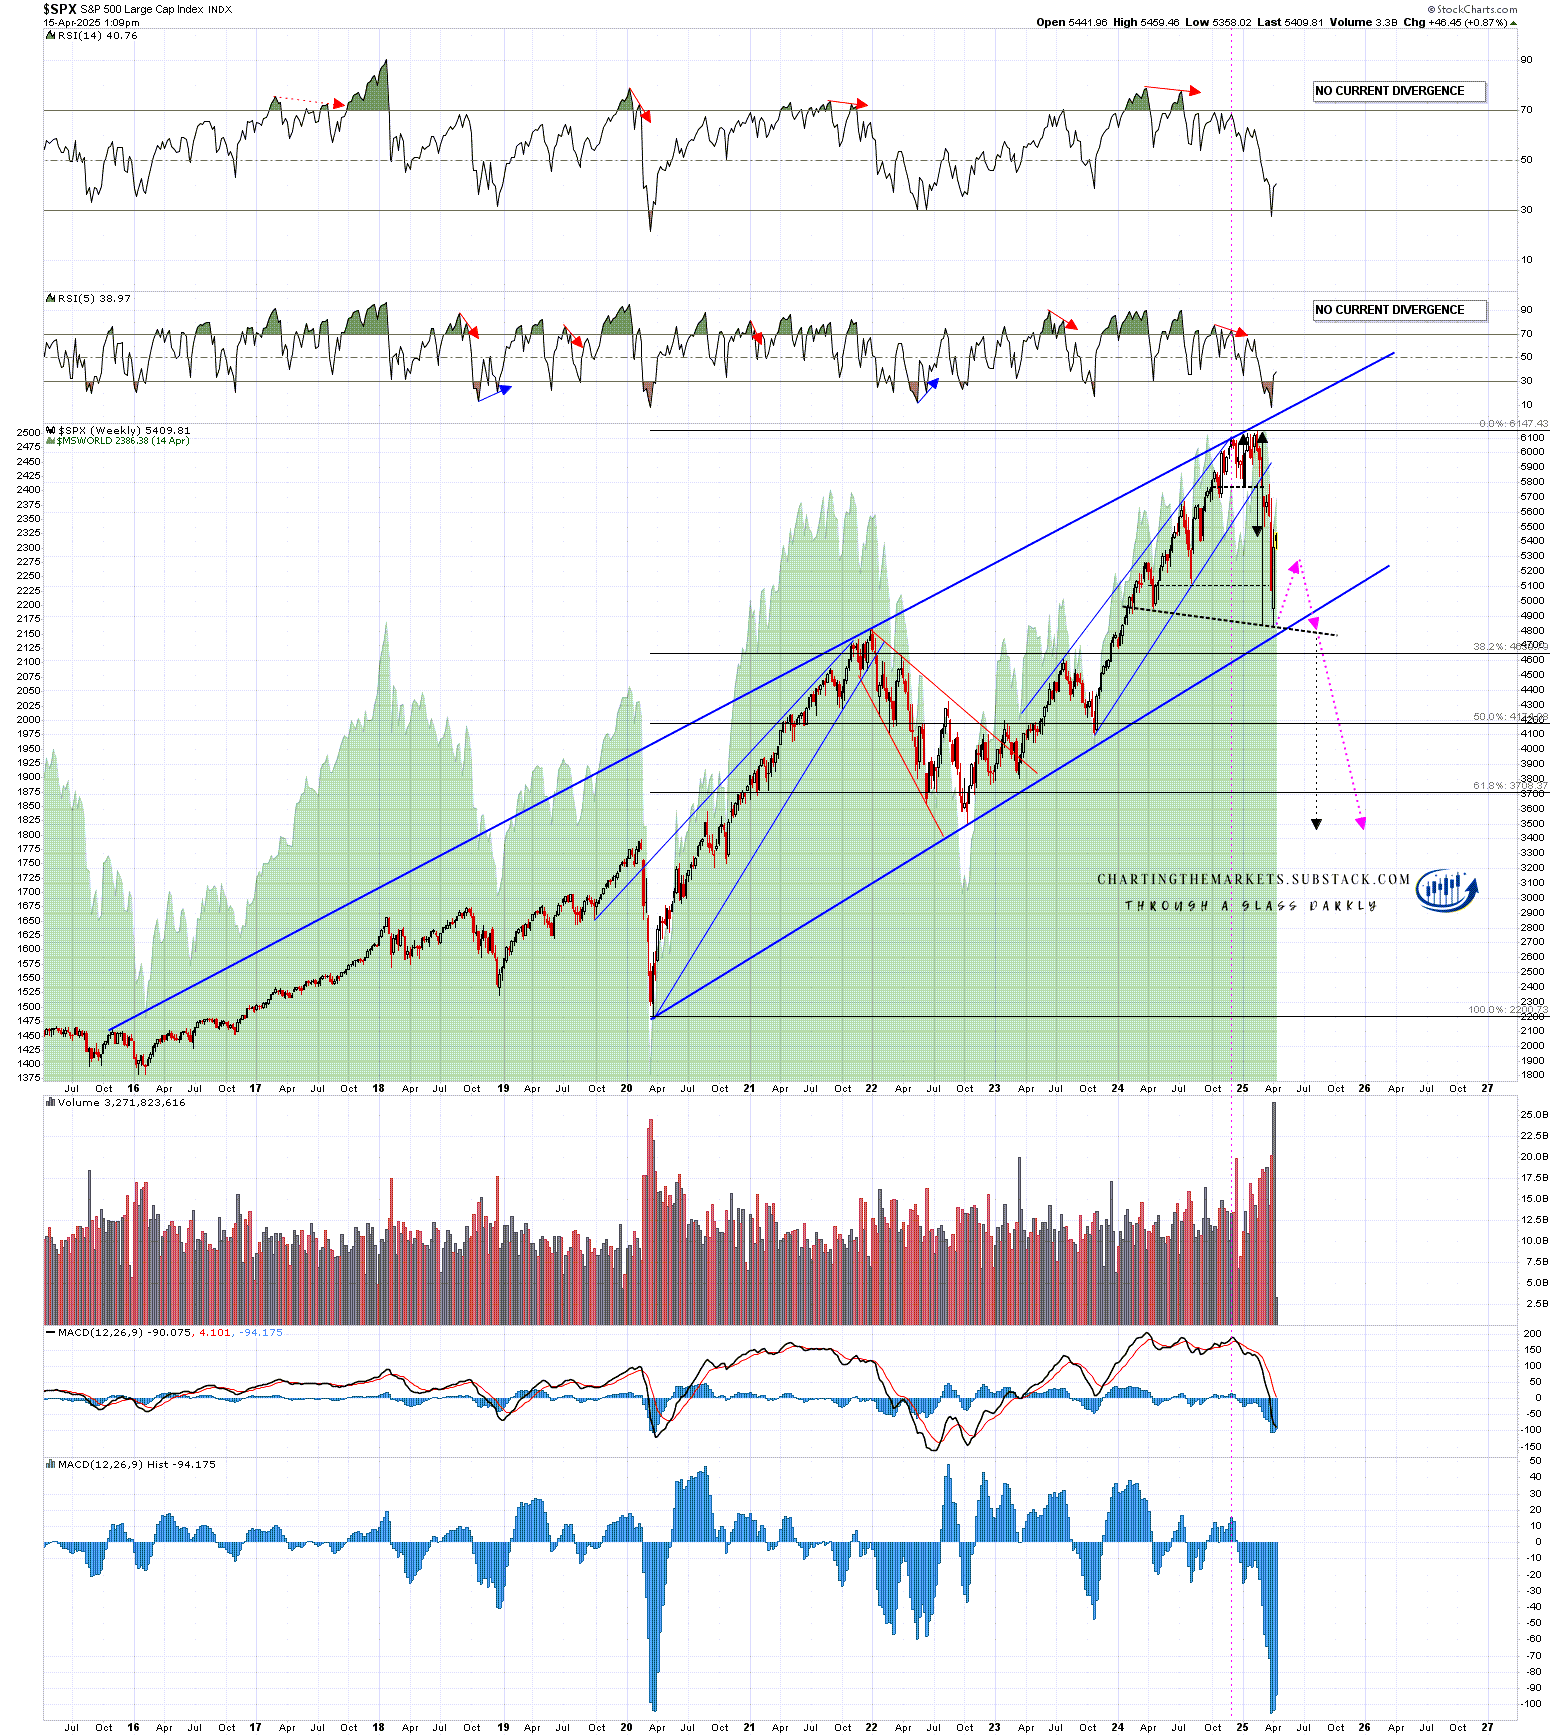
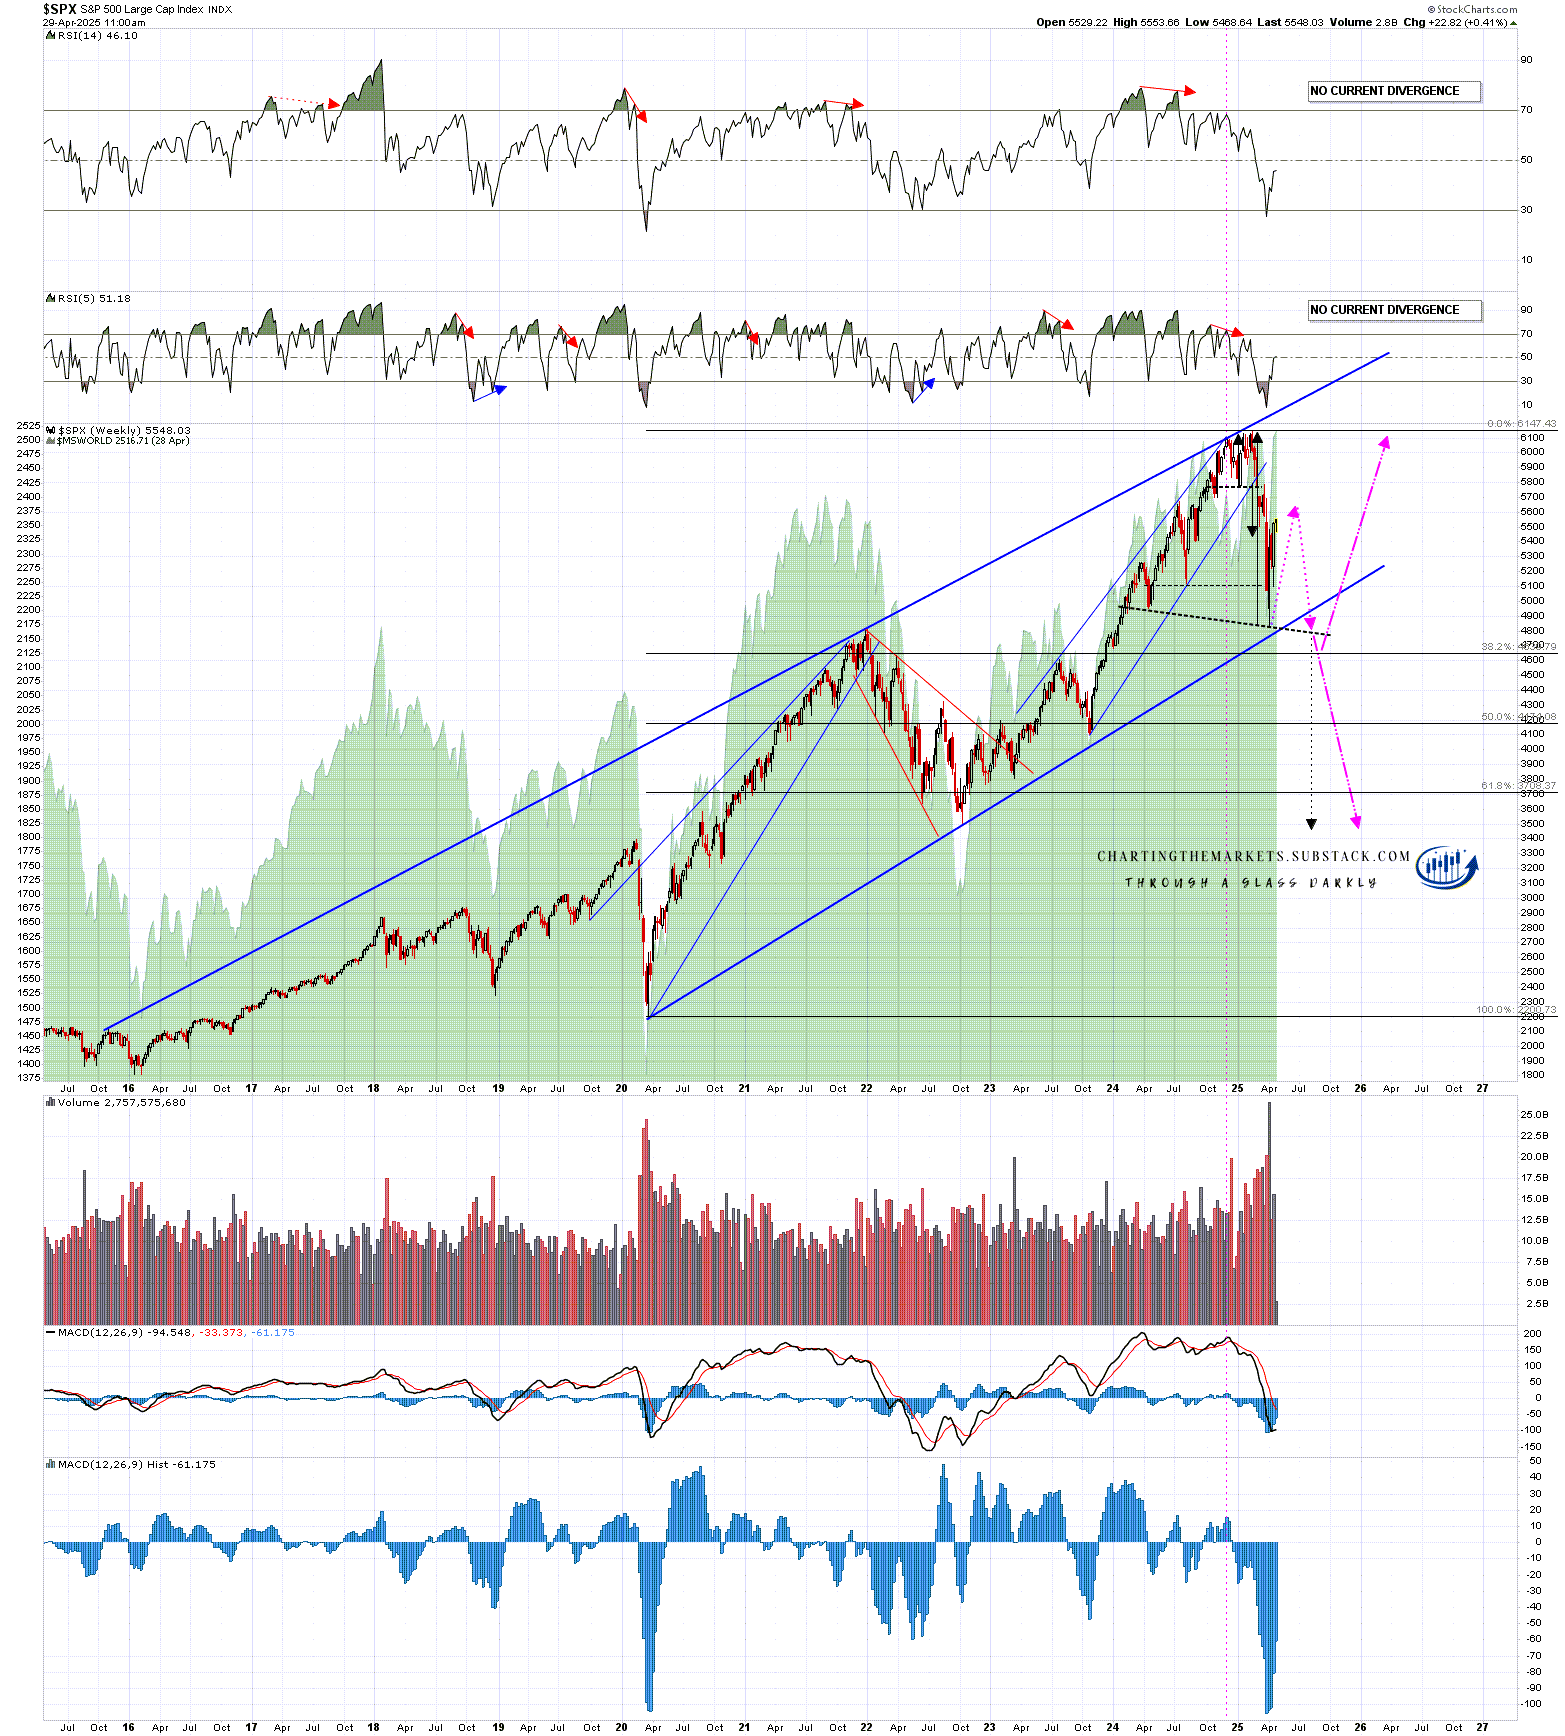
I also drew then a possible bear market projection for the rest of the year, with the current rally forming the right shoulder on a possible large H&S pattern that might be forming on this rally. That too is still looking good but the winds are changing, and it’s getting hard to predict what will be coming the market’s way in terms of tariffs and other economic news in the next few months.
More on that after this next chart, and I am still liking this rally as a bear flag rally at the moment, but I have added another arrow to the chart below for the possibility that this possible H&S finishes forming and breaks down, and then rejects back into the all time high.
SPX weekly chart - bear market projection:
So what is changing on the picture looking forward? Well I understand that today is the 100th day of this Trump administration, and it’s becoming increasingly clear that on almost every metric it has been a political and economic disaster so far.
In terms of approval ratings Trump is hitting new lows since the start of modern polling about 80 years ago for the end of the first 100 days. Looking at the poll numbers from Fox, which are by no means the worst, Trump is underwater on everything except border security (+15%), with overall job performance at -11%, foreign policy at -14%, the economy at -18%, taxes at -15%, tariffs at -25% and inflation at - 26%.
This is very important as Trump’s so far very impressive control of house and senate republicans is in large part due to them being more scared of primary challenges from Trump’s base than the electorate in terms of retaining their seats. As Trump’s popularity wanes, that math changes.
On the economy Jamie Dimon has been saying that a mild recession is now the best-case outcome of the ongoing trade war, and I agree. We’ll see some numbers on Wednesday that should shed some light on whether that recession has already started. Regardless of those at least a mild recession now looks very likely and, depending at least in part on policy going forward, that recession may not be a mild one.
On taxes, Trump has always said that foreign trade partners would pay most or all of his tariffs, and that was never likely to be true. As US consumers start to pay those tariffs in the form of higher prices the truth will become clear to all, and that truth is that these tariffs are the largest increase in taxes in modern US history, and that most of these new taxes will be paid by ordinary americans as they shop.
On tariffs these were never anything but nominally reciprocal and, as I noted before ‘Liberation Day’, this gameshow format used to effectively declare economic war on the world was not likely to be a successful one, for the reason that the size of US trade to all other trade partners other than Canada and Mexico is 5% or less of their economies, but the importance of the rest of the world’s trade to the US is about 24% of the US economy. Any negotiations should have been entered into on a case by case basis to avoid this potentially becoming an economic disaster for the US.
Trump was stating in his April 22 interview with TIME that:
‘We are a department store, and we set the price. I meet with the companies, and then I set a fair price, what I consider to be a fair price, and they can pay it, or they don't have to pay it. They don't have to do business with the United States, but I set a tariff on countries.’ ……….
‘We're a department store, a giant department store, the biggest department store in history. Everybody wants to come in and take from us. They're going to come in and they're going to pay a price for taking our treasure, for taking our jobs, for doing all of these things.’
In effect it seems that Trump is using tariffs to sell access to US markets to foreign trade partners. He feels very optimistic about this working, but it seems more likely that these policies, if sustained, will result in a large reduction in coming years with the amount of trade that the US does with the rest of the world, a big shock to the US economy as it is forced to reorganize to cope with that reduction, and a lot of angry US voters being forced to pay much higher taxes.
Are these tariffs likely to be sustained? Maybe, Trump is a big believer in tariffs and has been since the 1980s and may be very reluctant to abandon them, particularly the minimum 10% tariffs that he believes should be paid by all trade partners. I suspect most of the rest of the ‘reciprocal’ tariffs will likely be abandoned, and the trade war with China will likely be scaled down hard within weeks, but there are now a lot of huge question marks over the economy and trade over the next year or two and we’ll have to see how that develops.
I’ve been much more interested in the news than I usually am since Trump was elected, and that will likely continue to be the case in coming months, but mainly I’ll still be following the charts and am avoiding any strong preconceptions about where markets go from here.
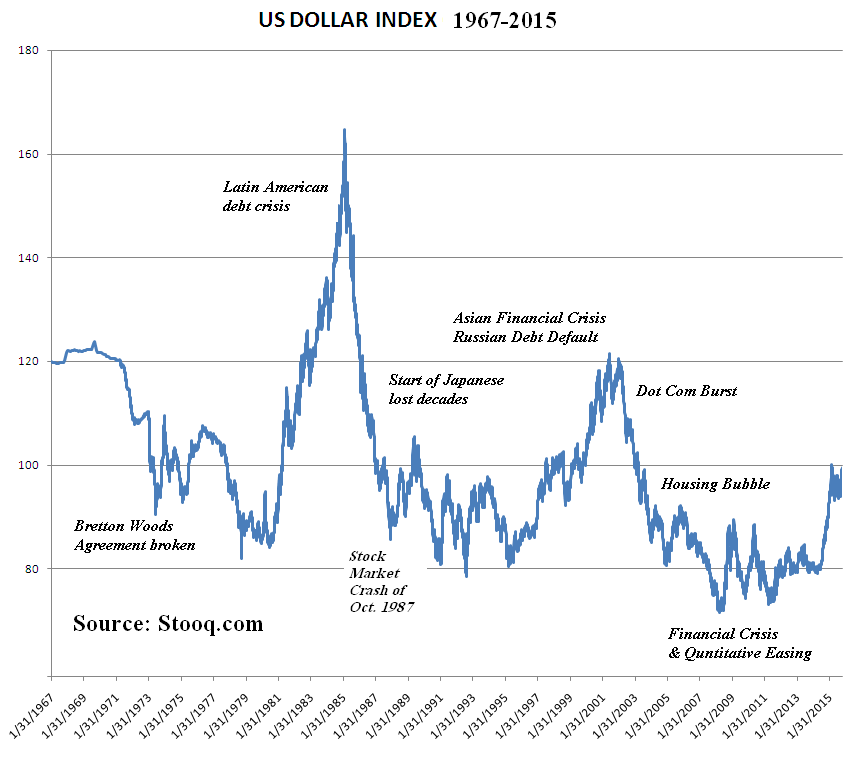
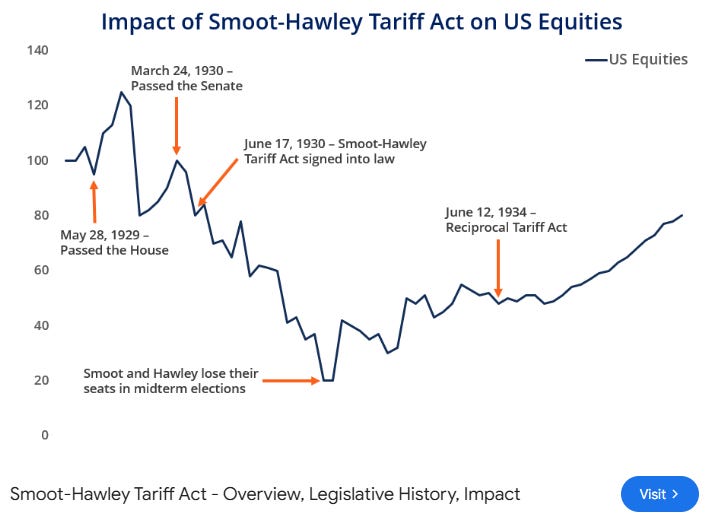
In terms of how markets went the last time the US economy was given a tariff shock comparable to this, I found this very interesting chart showing the Smoot-Hawley Tariff Act that was passed by the House on May 28 1929 and signed into law on June 17 1930. I’m not expecting to see the same here, not least because I’m expecting most the delayed ‘Liberation Day’ tariffs to be cancelled while Trump fights over the next few months to avoid becoming a lame duck president in 2025.
Smoot Hawley Tariff Act Impact Chart (from corporatefinanceinstitute.com) -
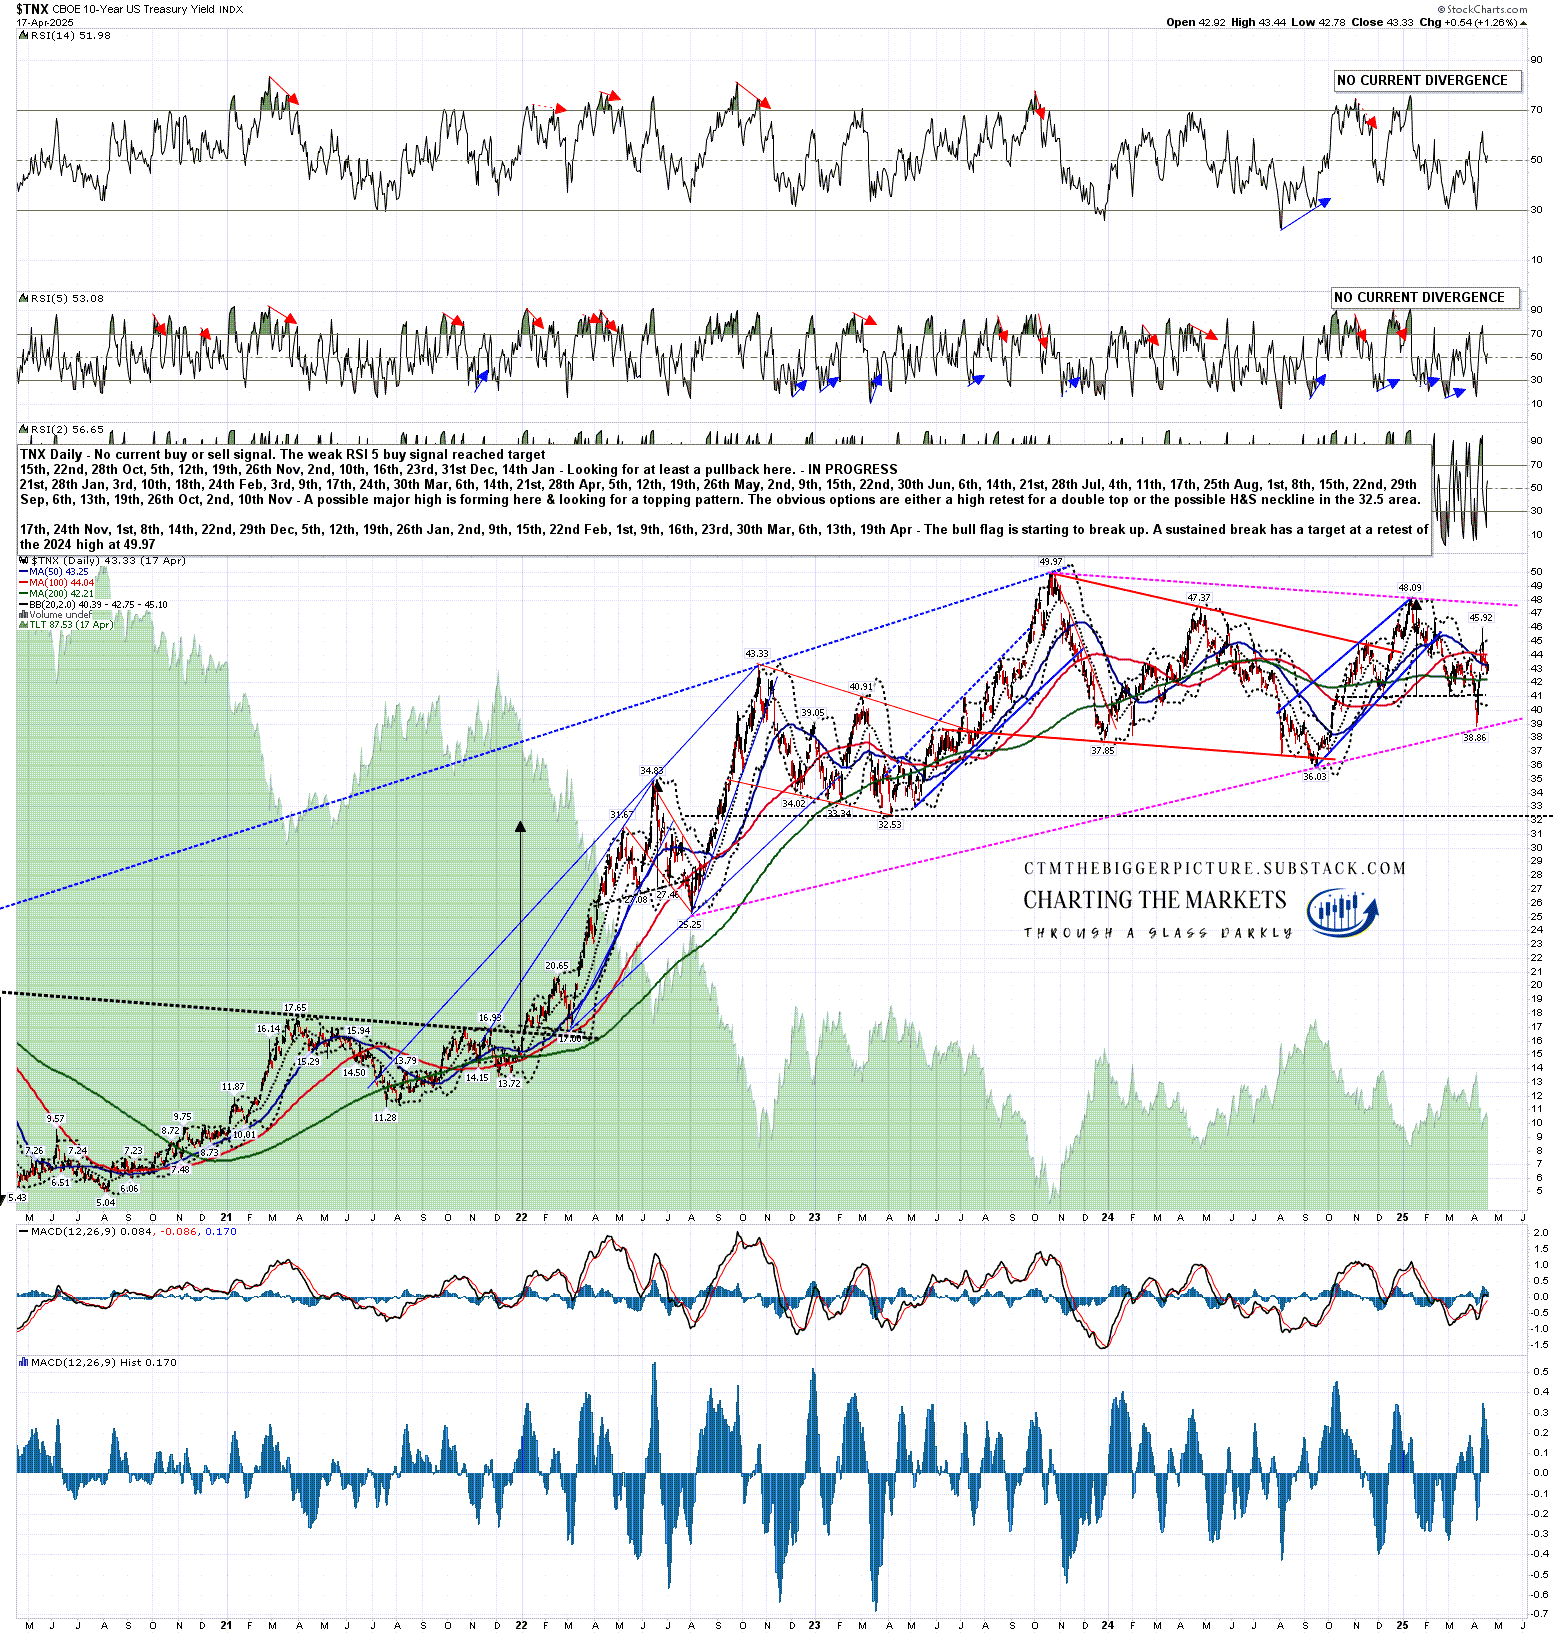
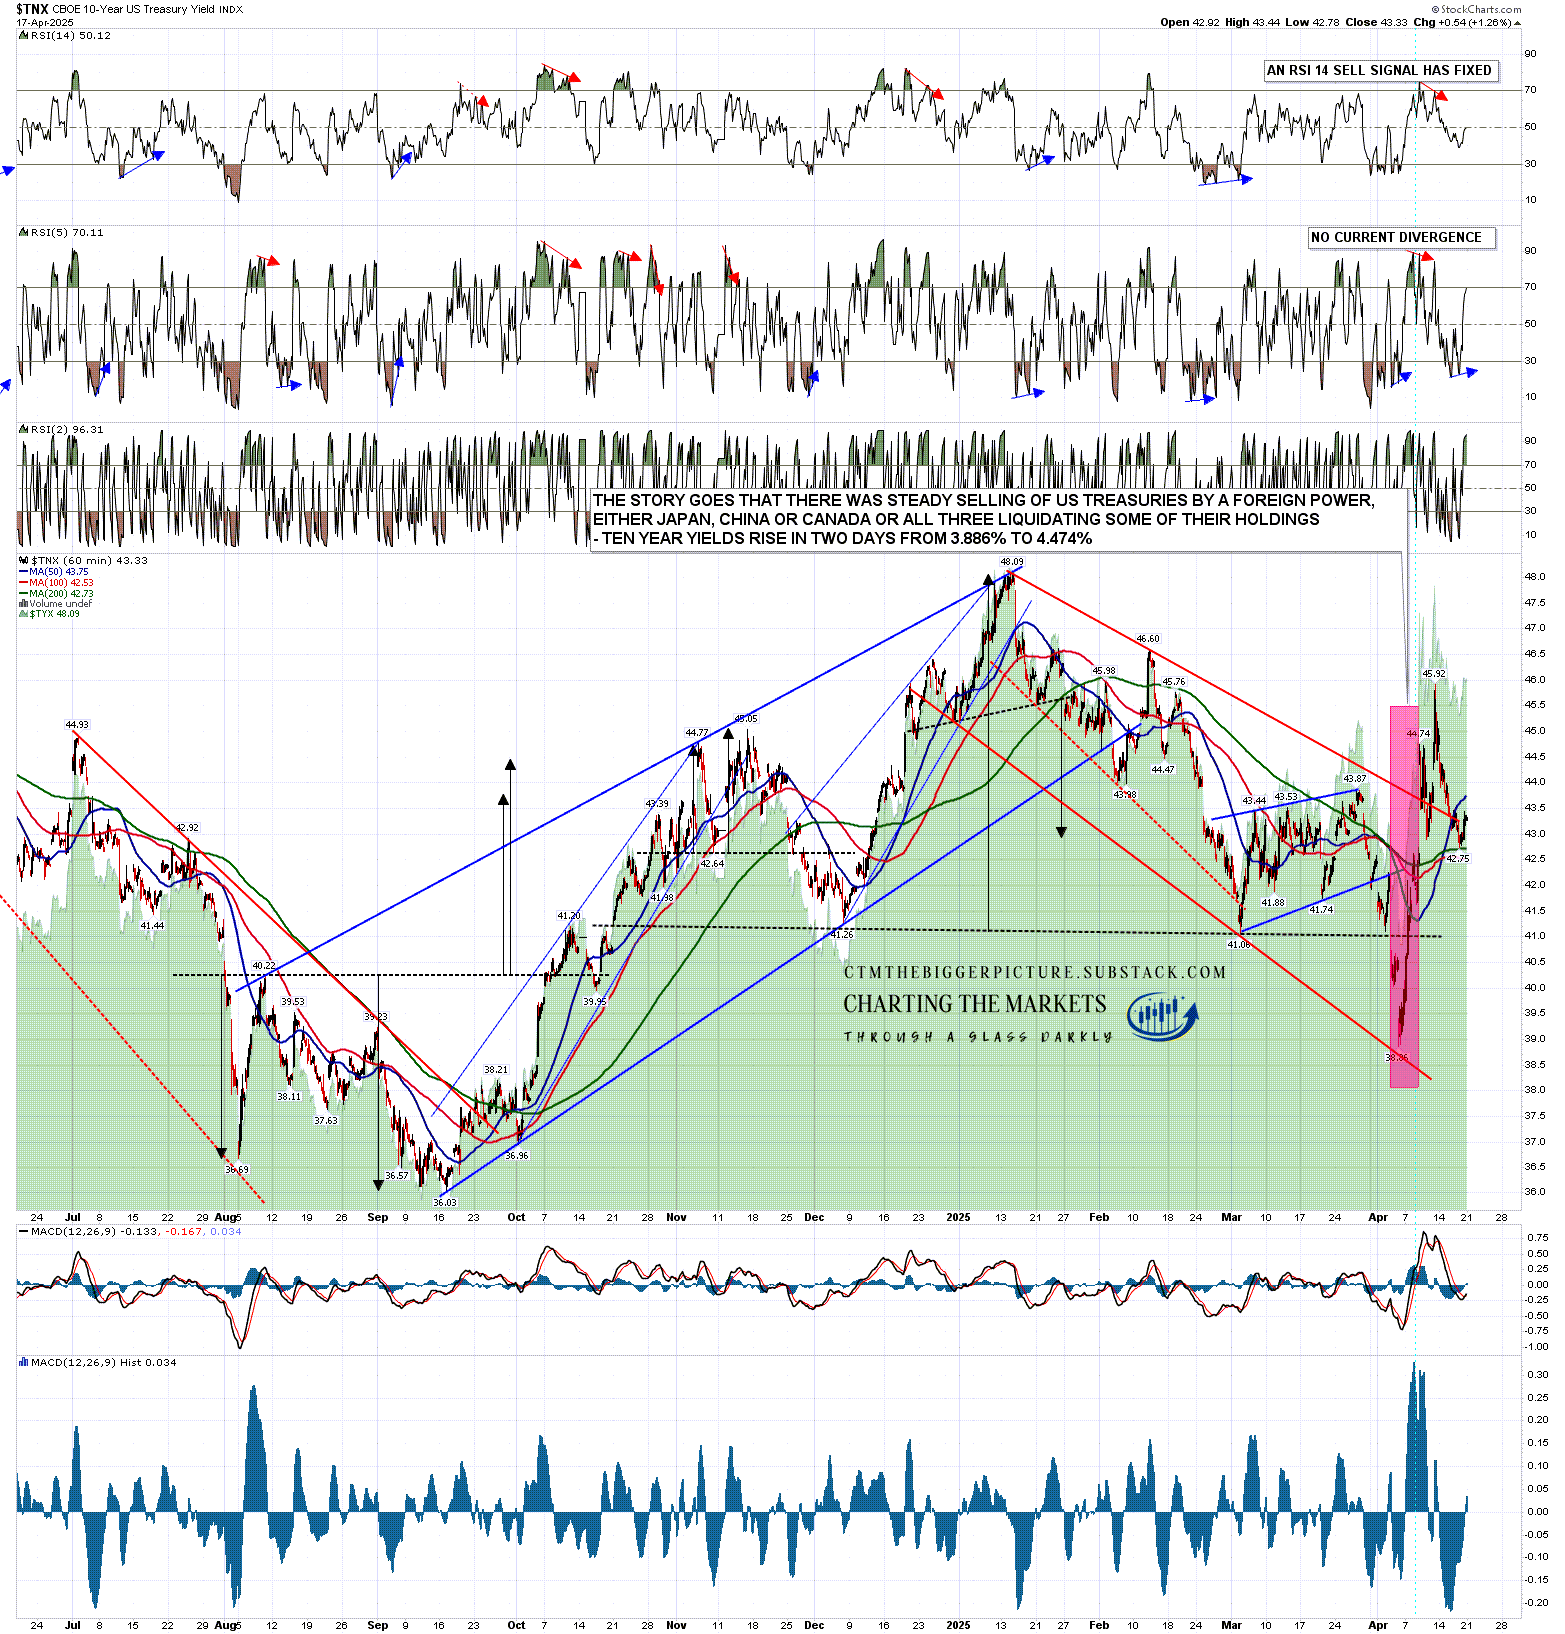
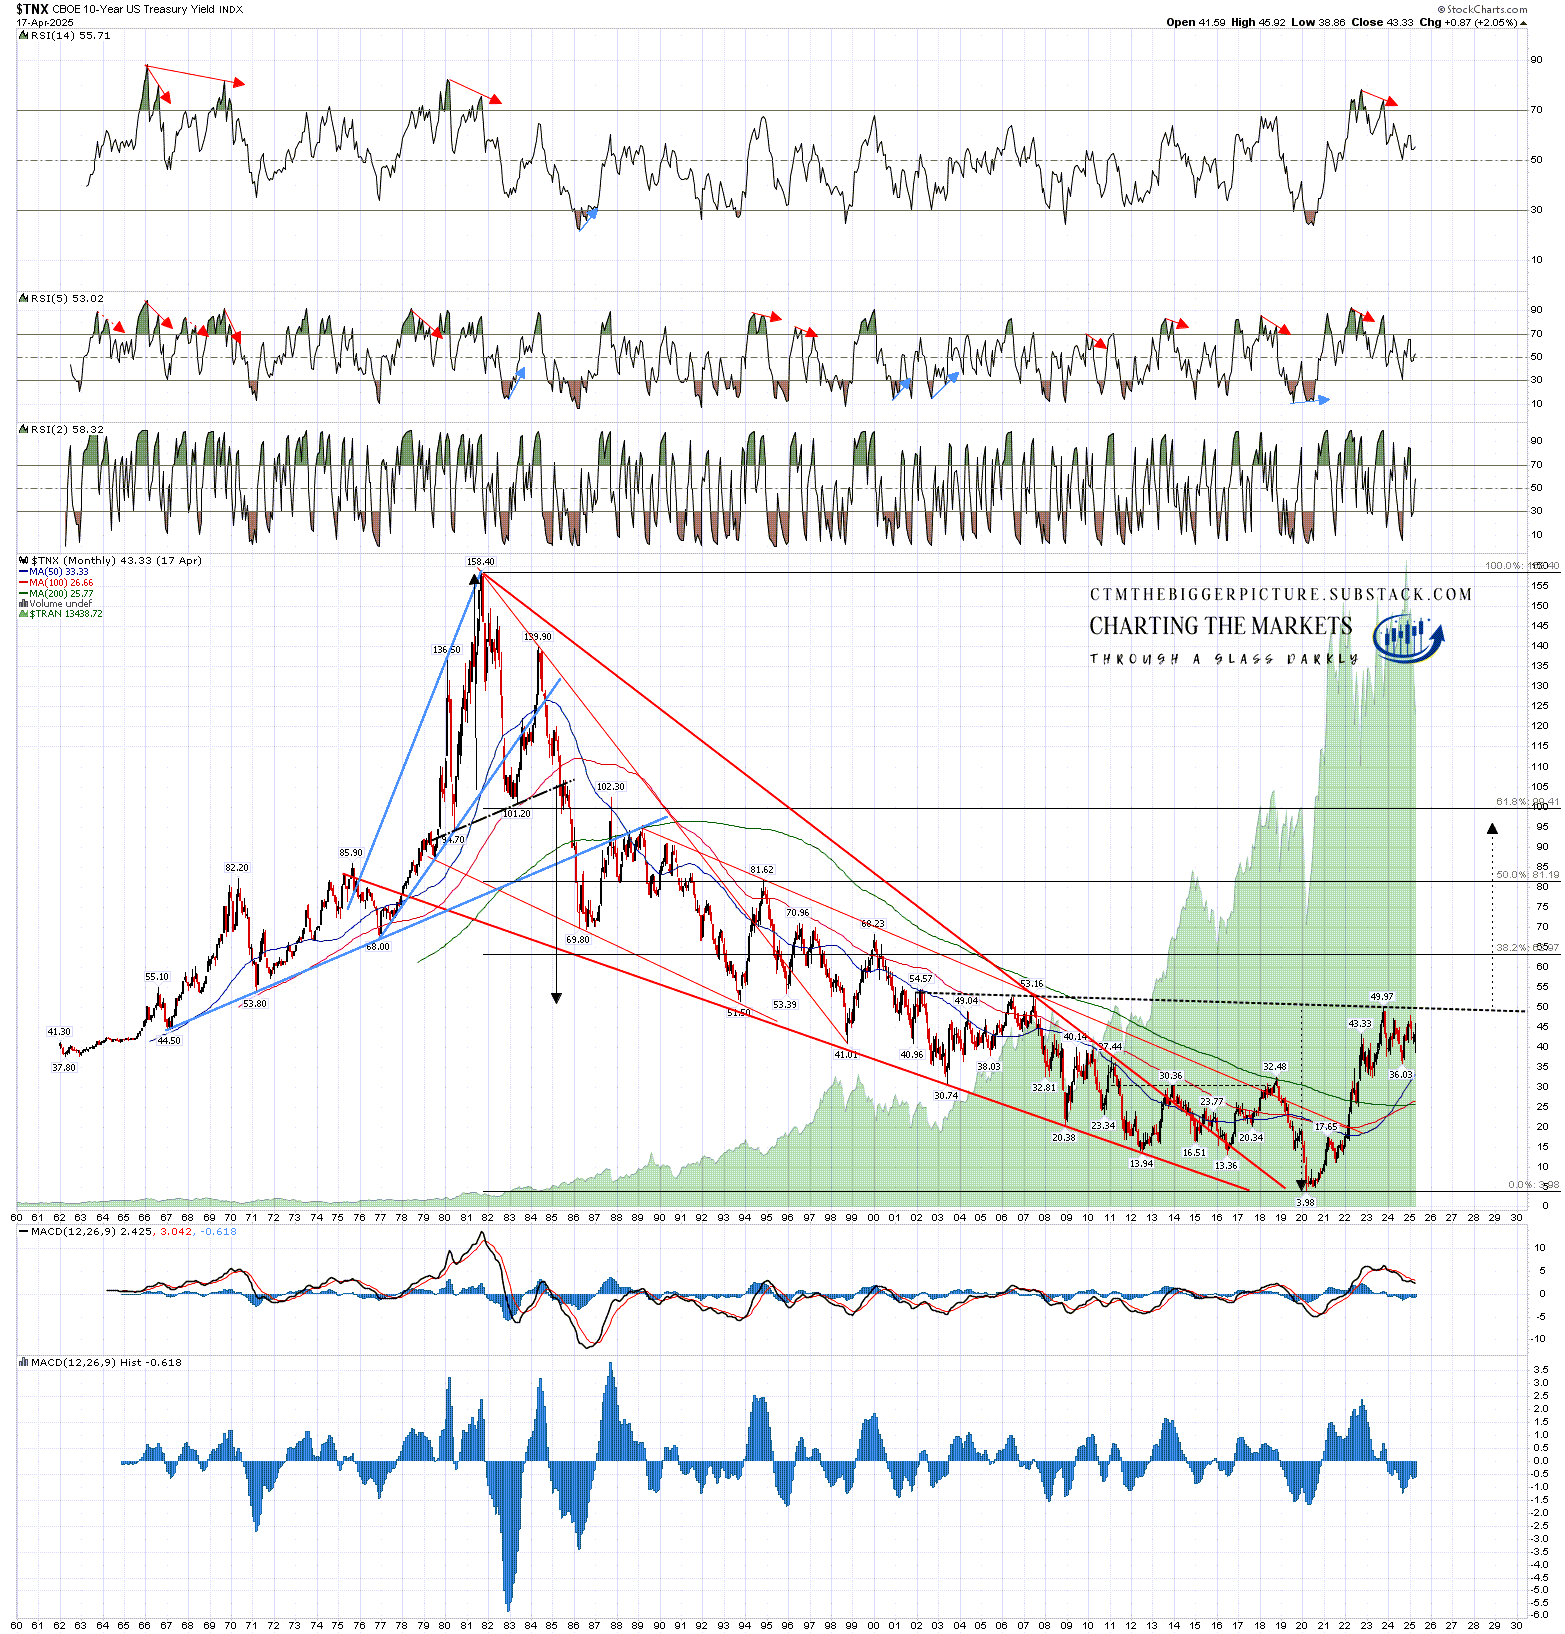
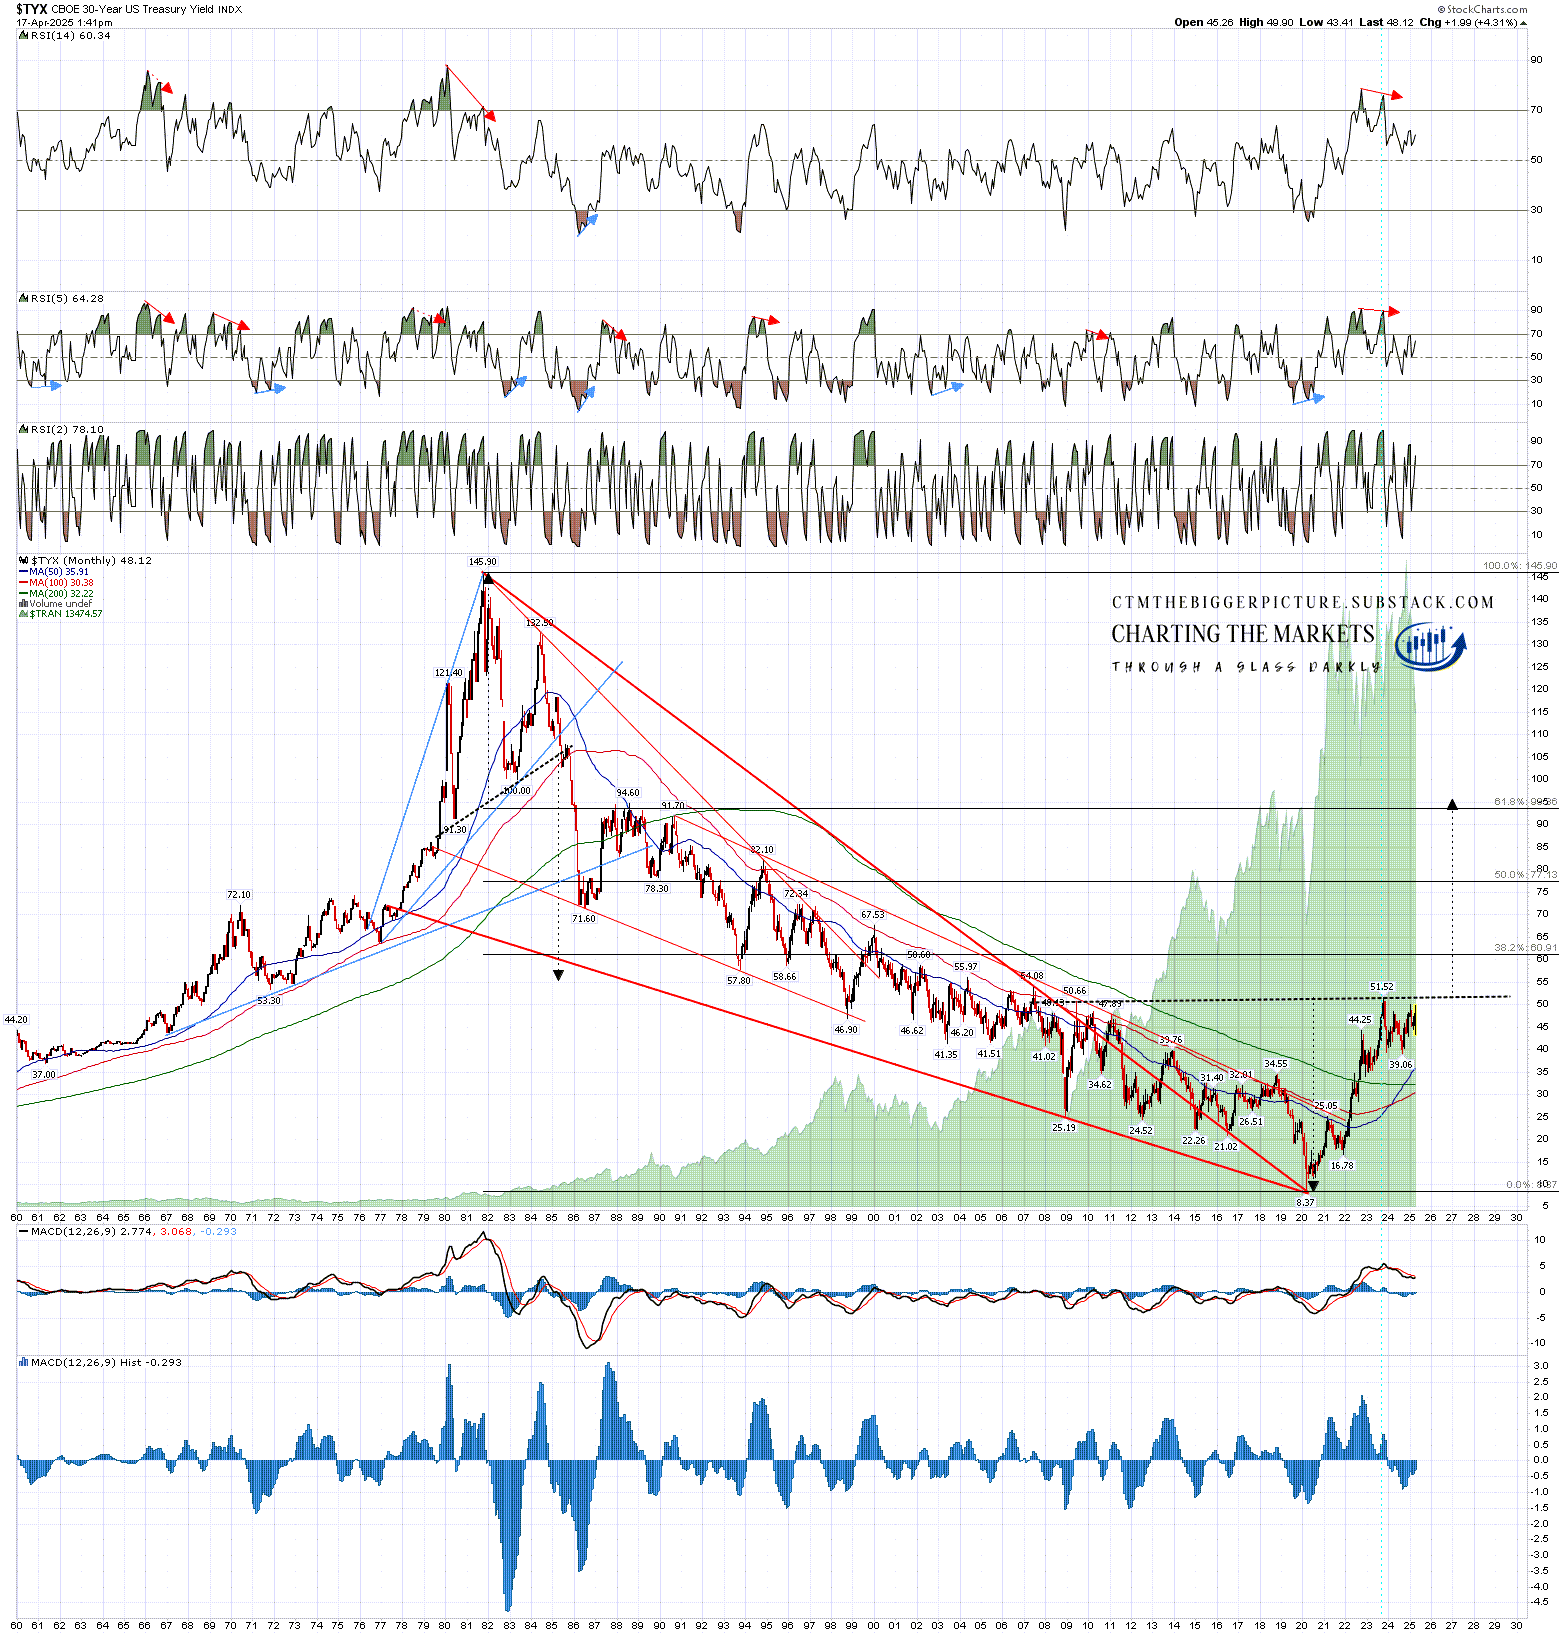
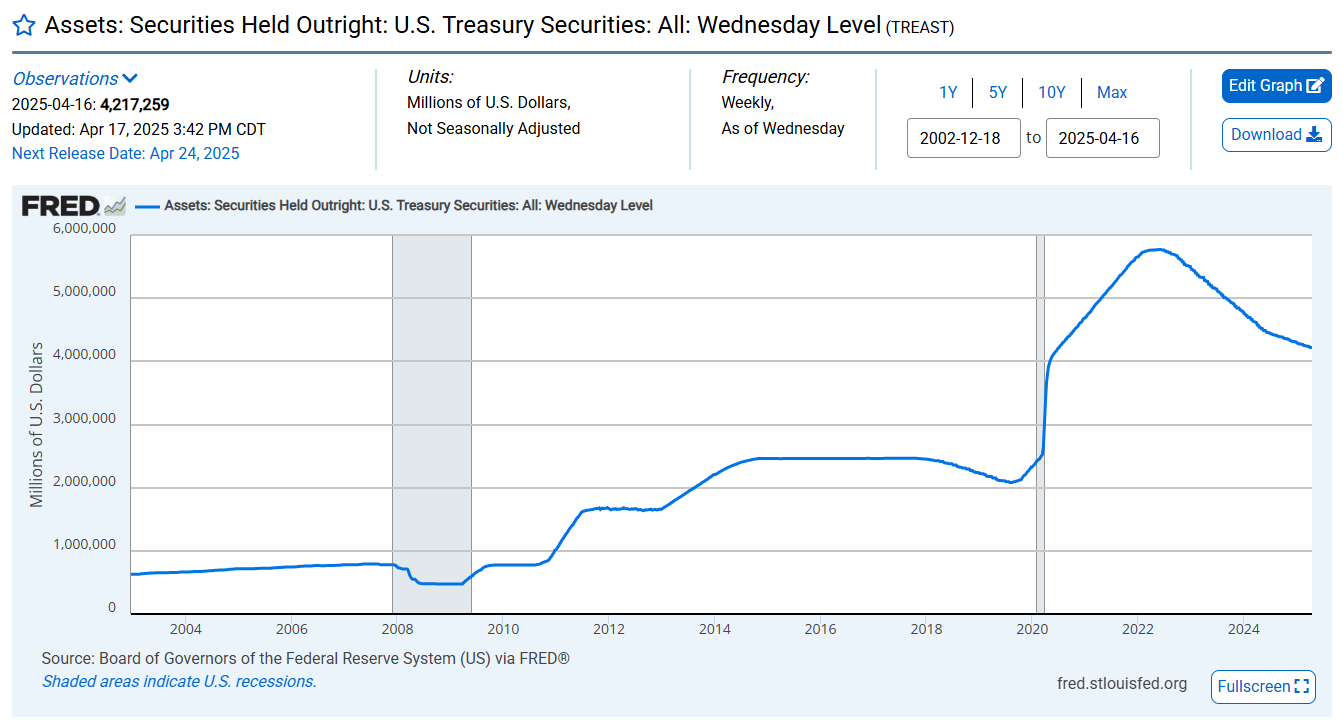
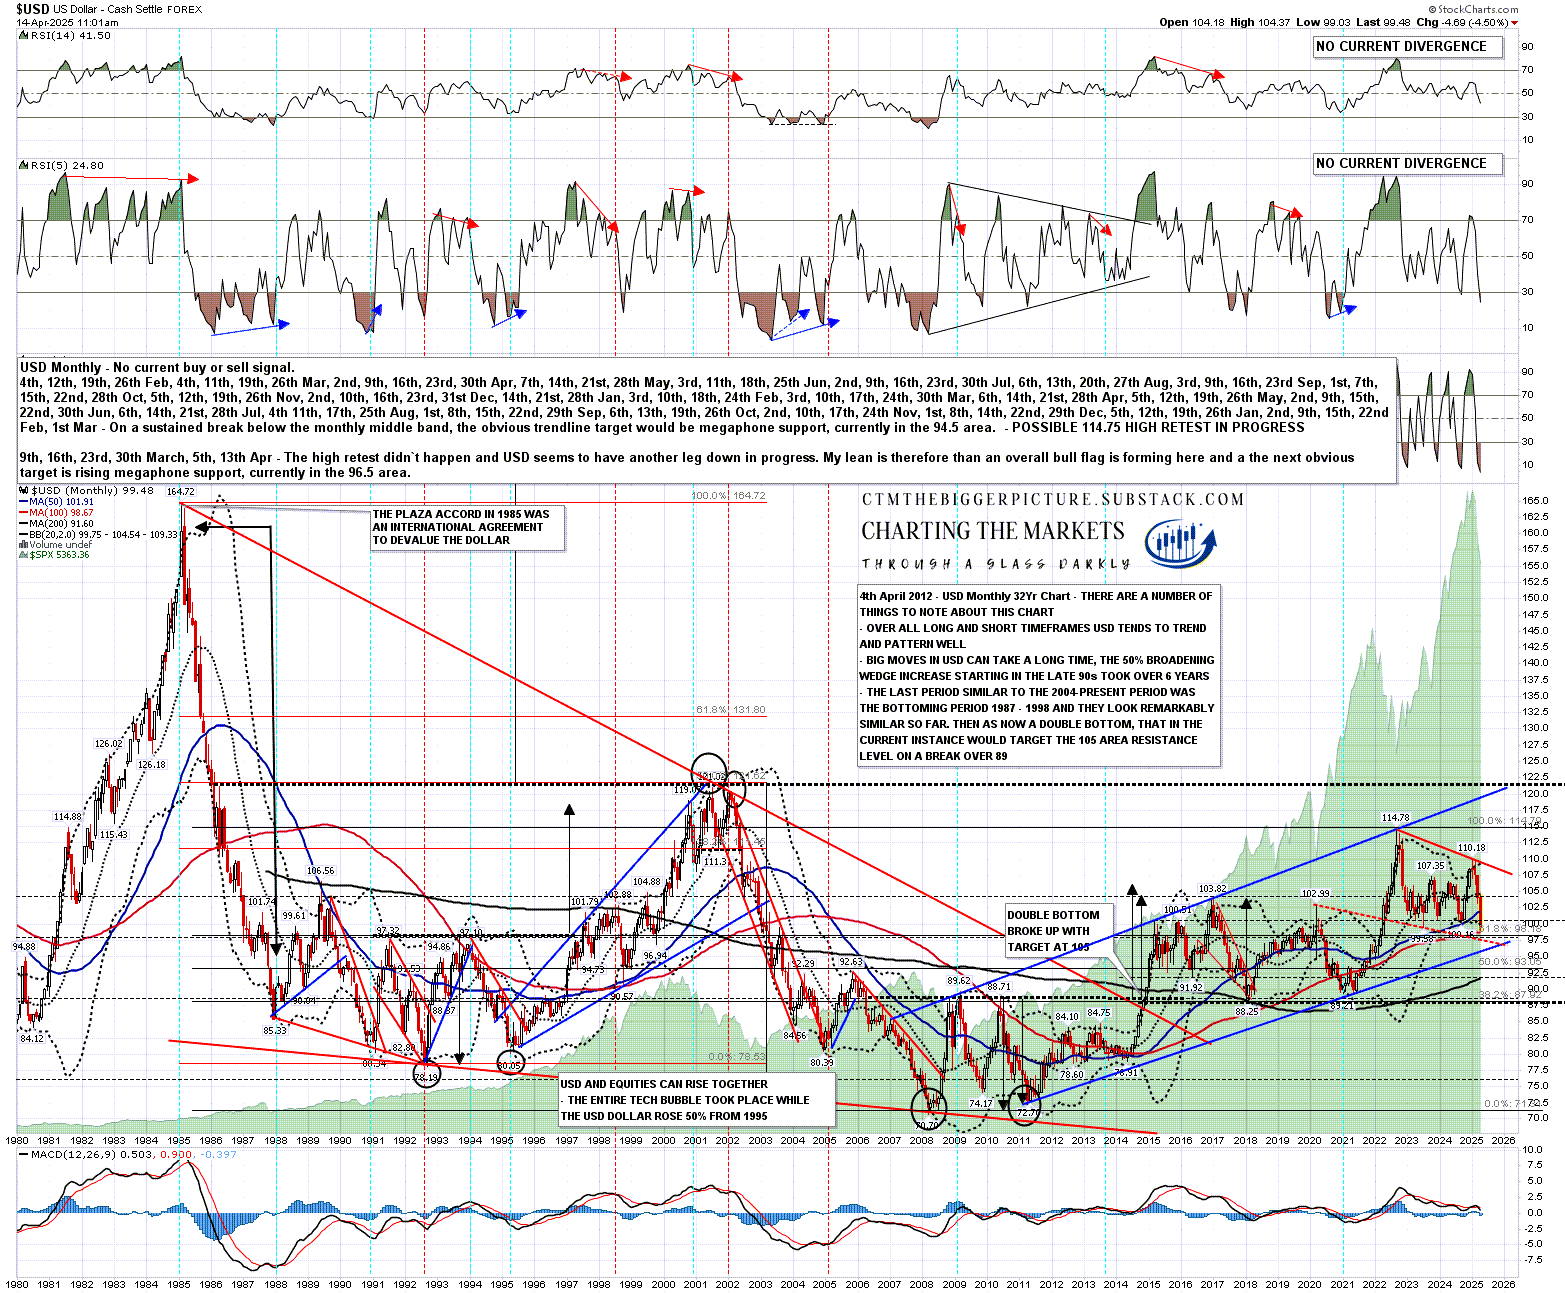
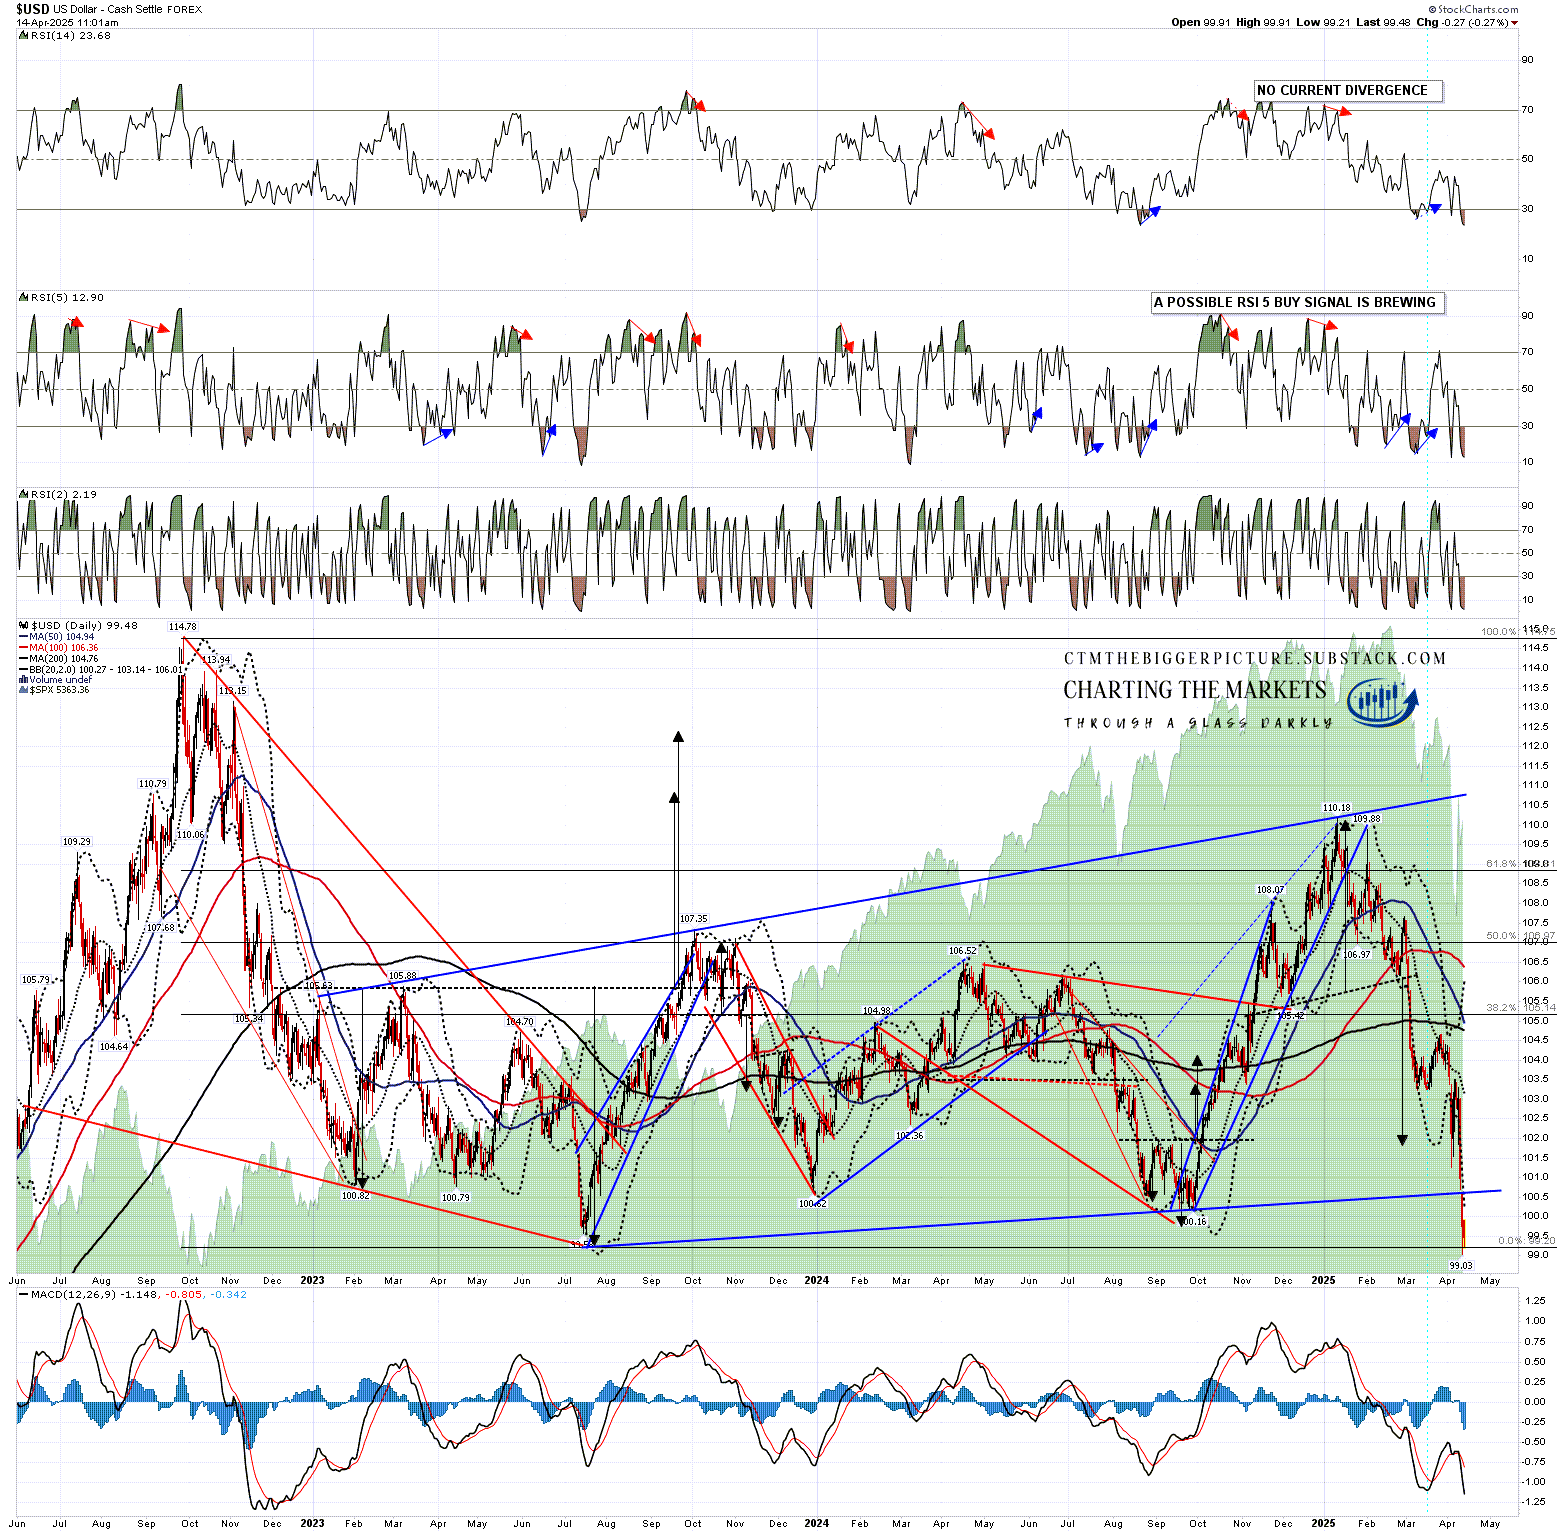
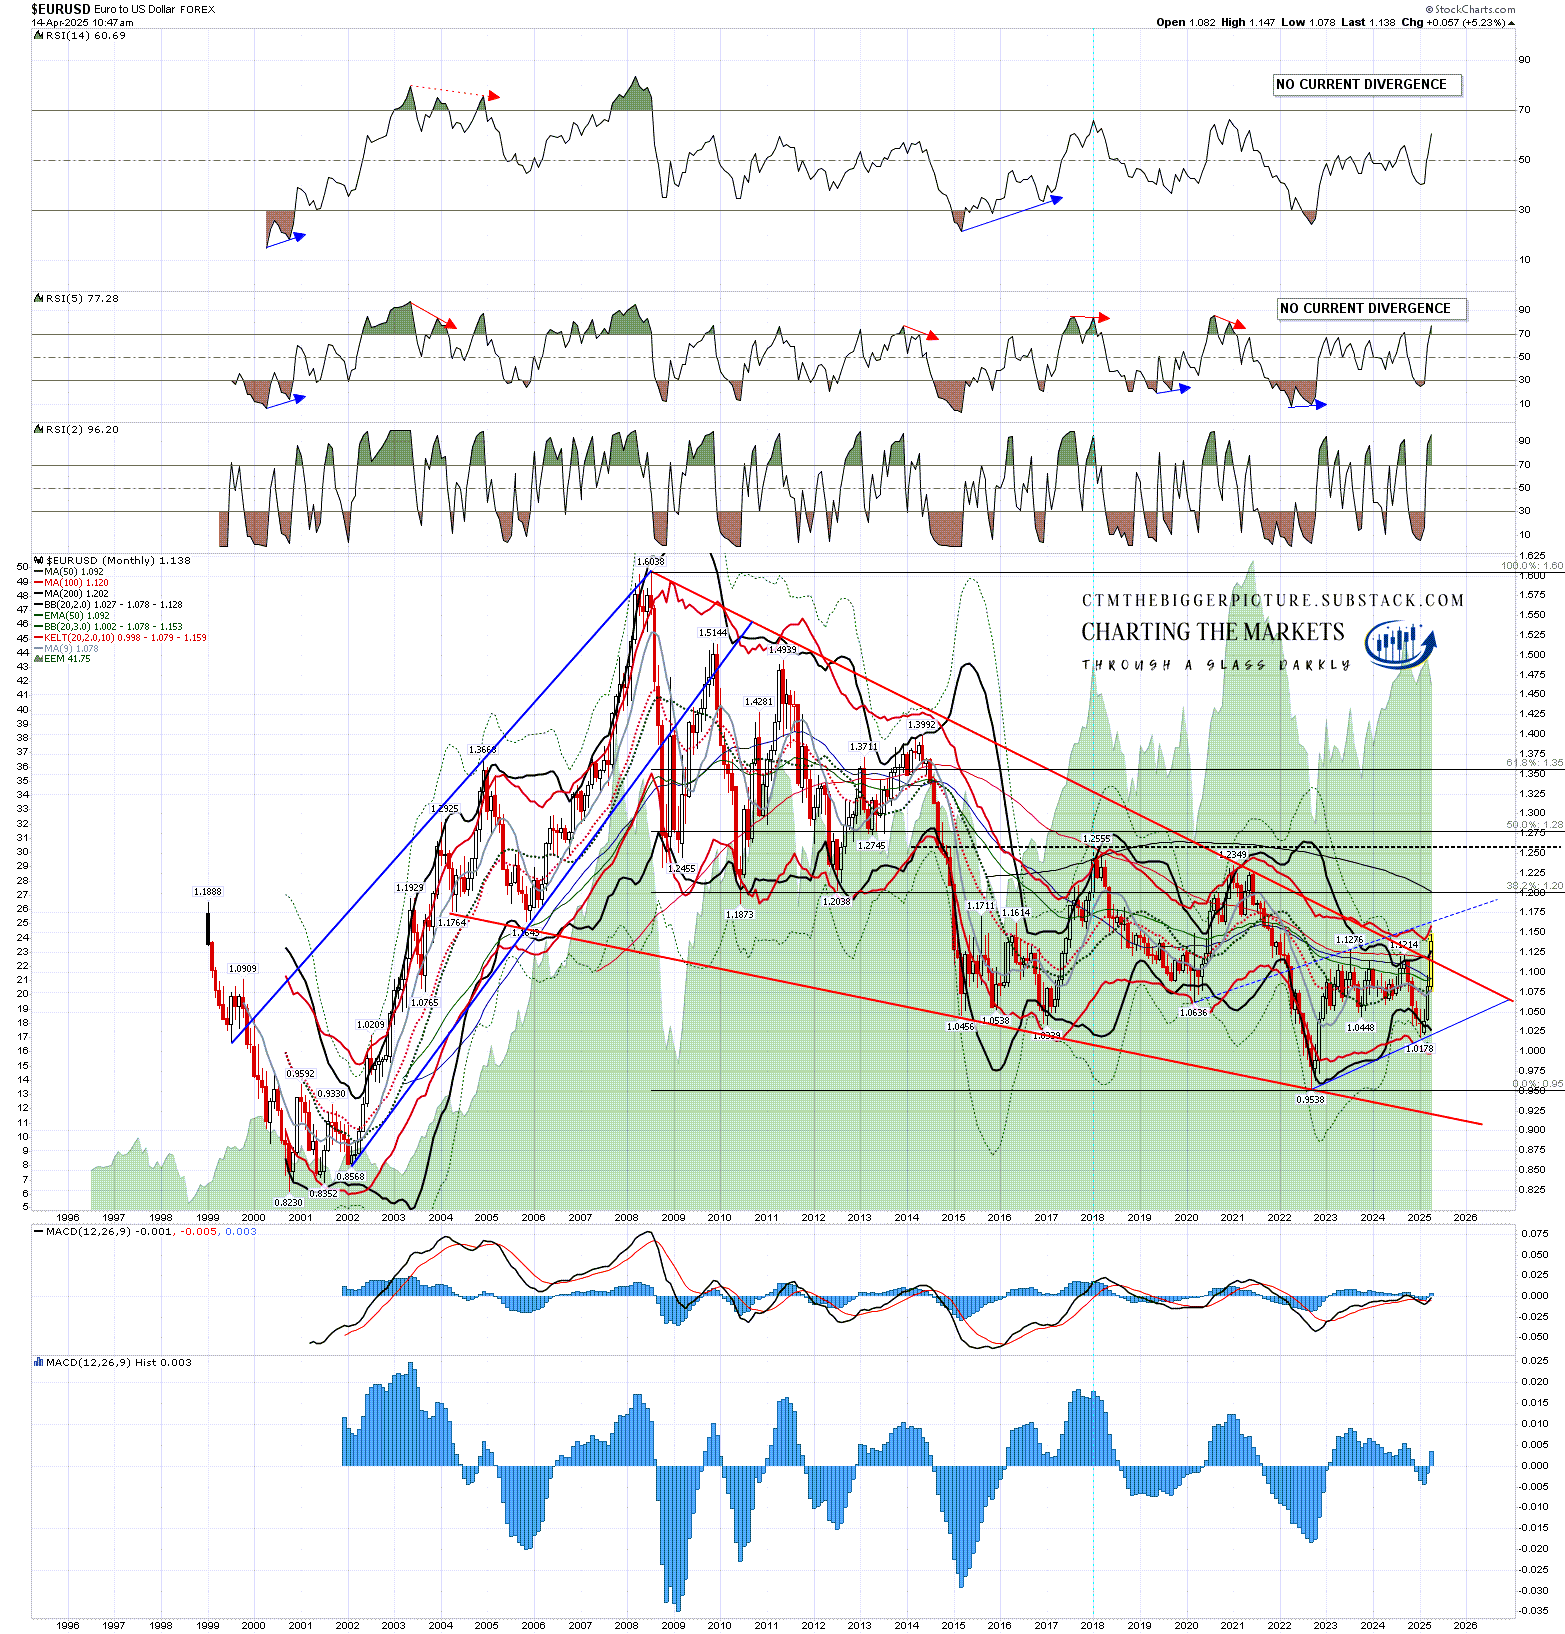
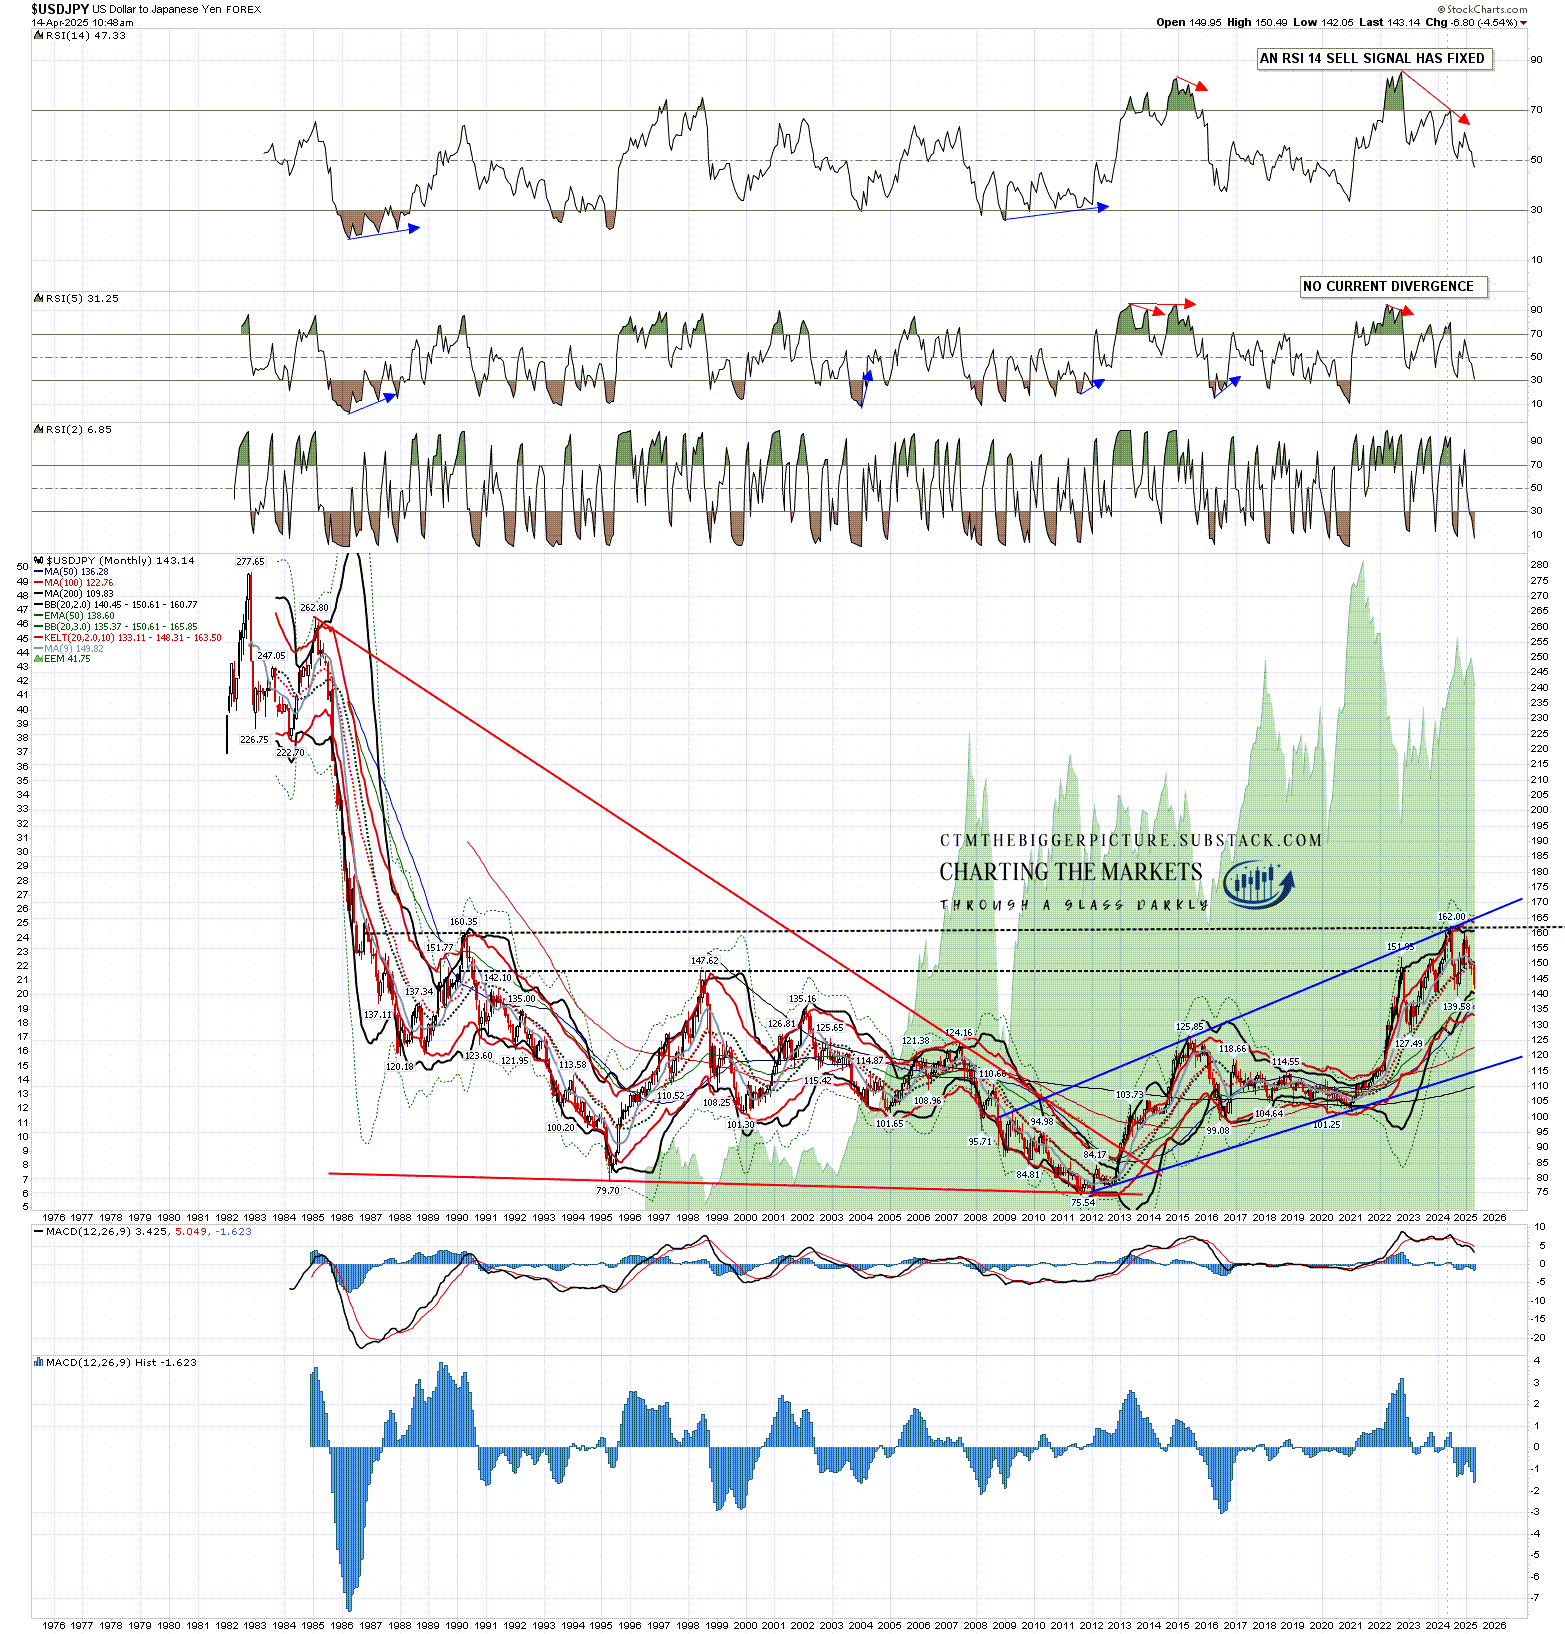
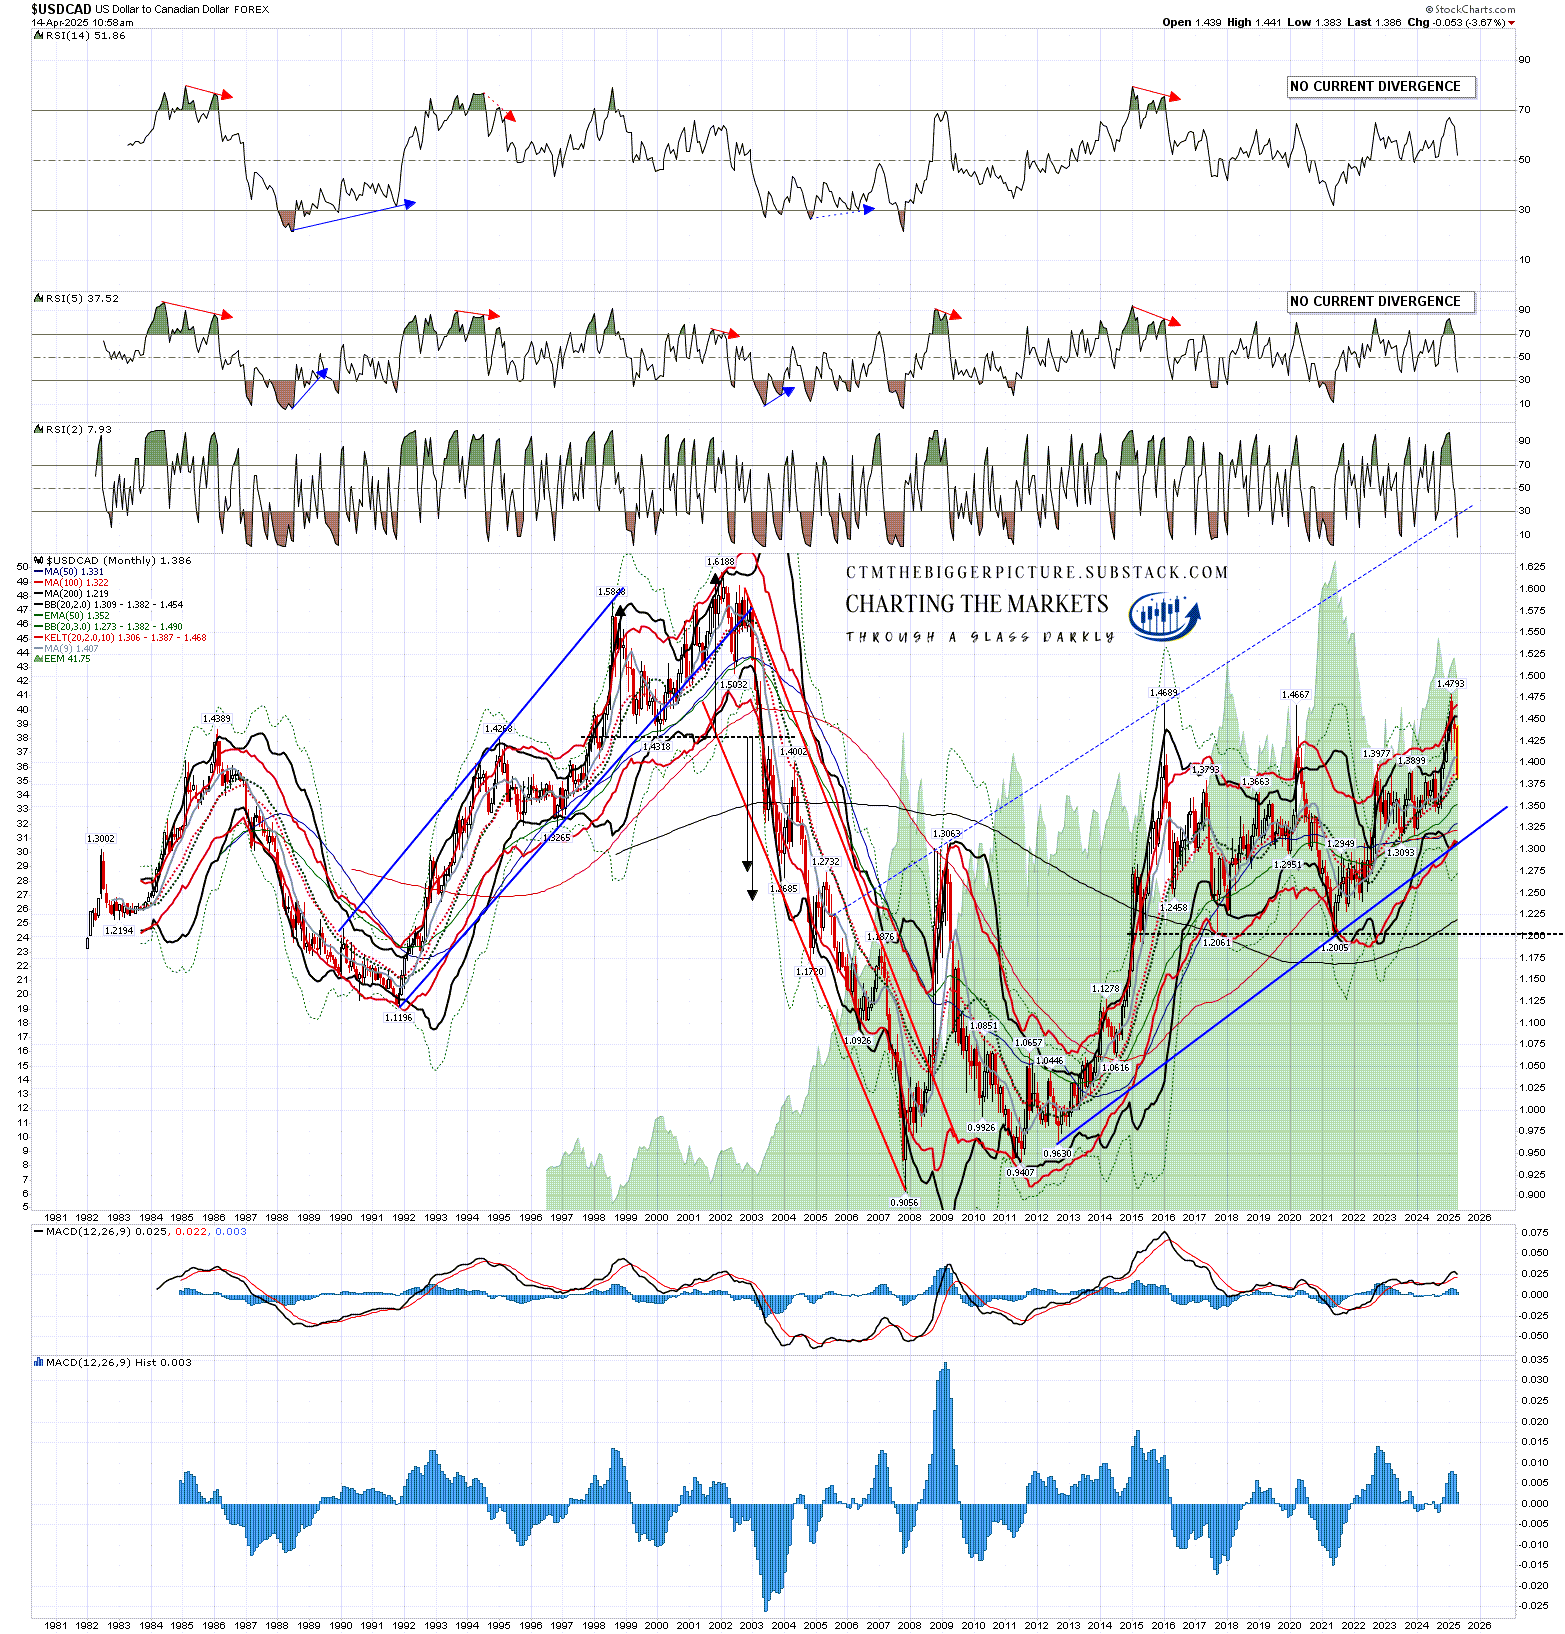
I’m doing a series of (currently four) posts at the moment on my The Bigger Picture substack on the US Dollar, US Treasuries, and the reasons to be very concerned about the possible further sharp declines on both that may be coming this year. The first of these posts is looking at the potentially bearish setup on the US Dollar, the second is looking at the potentially very bearish setup on US Treasuries, the third is looking at the reasons that we may see a bond market crisis this year, and will be published this week and the fourth will be looking at why the US Dollar may lose its status as the main reserve currency for the world, what that would likely look at and what other currencies and instruments might partly replace it. Everyone trading equities in this wild year should read these.
As I have been since the start of 2025 I’m still leaning on the bigger picture towards a weak first half of 2025 and new all time highs later in the year, very possibly as a topping process for a much more significant high. One way or another I think we’ll be seeing lower soon and I’m not expecting this to be a good year for US equities, not least because both of the last two years have been banner years for US equities. A third straight year of these kinds of gains looks like a big stretch. I could of course however be mistaken. UPDATE 11th March 2025 - I am wondering if this may be a bear market that dominates the whole of 2025.
If you like my analysis and would like to see more, please take a free subscription at my chartingthemarkets substack, where I publish these posts first. I also do a premarket video every day on equity indices, bonds, currencies, energies, precious commodities and other commodities at 8.45am EST. If you’d like to see those I post the links every morning on my twitter, and the videos are posted shortly afterwards on my Youtube channel.