I have really been nailing US equity markets so far this year. I published a post on Wednesday 19th February, the day the SPX made the current all time high, looking at the high quality double top setups on SPX, QQQ and DIA, and the ok quality H&S on IWM, and all those topping patterns have now reached target with DIA, the last to reach target, hitting that on Friday.
I published a post on Monday 18th March looking at touches of the weekly 3sd lower band over the last few years and calling for a rally lasting at least a week or two based on the past history of similar setups on the weekly 3sd lower band, and we saw that too.
I published a post on Tuesday 26th March looking at the bear flags that had formed on that rally and saying that they looked ready to break down towards at least retests of the March lows and they broke down and retested those directly from there.
I published a post on Tuesday 1st April on my bigger picture substack arguing that tariffs would likely go ahead, that the odds of seeing a serious bear market this year were now high and that a full market crash this year was now potentially on the cards. IWM was already in technical bear market territory (decline of over 20% from high), SPX and QQQ reached the 20% level late last week and, at the low yesterday, DIA is currently down 18.383% from the high.
I then published another post on Tuesday 1st April on my bigger picture substack looking for a downside target on SPX at 5100, and that was reached on Friday.
I published the third and last post in this 'Liberation Day’ series on Wednesday 2nd April looking for downside targets in the 17450 or 17000 areas on NDX and in the 370 or 380 areas on DIA. NDX reached both target on Friday and DIA reached both targets yesterday morning.
What’s my point? I have two points really. The first is that everyone should join my substacks and read my posts, and the second is that unfortunately the markets have reached a stage where it is getting harder to call, with all topping patterns having now made target, limited RSI divergence and overall decline patterns not yet obvious. What I would say though is that if a serious swing low was going to be made here, we would likely see some or all of the US indices with clearly bullish pattern setups. That is not the case here so I am leaning strongly towards more downside coming soon, but ideally not for at least two or three weeks.
My post three weeks ago was looking at the weekly 3sd lower bands and and I was looking again at those yesterday as US indices delivered rare punches below the weekly 3sd lower bands last week. We also saw a very rare move with the 10% decline in two days seen on SPX and other indices over Thursday and Friday last week, and I’ve been looking at what happens historically when these two rare occurrences have happened in the past. If you aren’t interested in market statistics you should skip this part and go directly on to the charts.
In terms of the 10% two day decline, the three previous instances I looked all had a more than 10% decline in two days and had a closing punch below the weekly 3sd lower band at the weekly close and they are as follows:
1987 Oct - 25% 2 day decline, punch below weekly 3sd lower band at weekly close. Major low made the following day.
2008 Nov - 12.8% 2 day decline, punch below weekly 3sd lower band at weekly close. Significant low made the following day into 6 week 27% rally.
2020 Mar - 12.3% 2 day decline, punch below weekly 3sd lower band at weekly close. 1 day rally, lower low after 2 days, major low made after 7 days.
2025 Apr - 10.5% 2 day decline, punch below weekly 3sd lower band at weekly close, lower low on following day and then ?
So what’s the takeaway? These 10%+ two day declines tend to come shortly before major lows (2x) or rallies (1x). The punches (clear weekly close below) below the weekly 3sd lower bands over the last 95 years (weekly data sketchy before 1930) are as follows:
1940 May - No rally. Major low 4 weeks later.
1962 Aug - 1 week & 2% rally. Major low 7 weeks later.
1981 Aug - No rally. Significant low 10% lower & 4 weeks later. 44 weeks before major low.
1994 Mar - Major low following week.
2001 Sep - 16 week & 24.5% rally. 56 weeks before major low.
2008 Sep - 1 week & 24.4% rally. 22 weeks before major low.
2015 Aug - 1 week & 1% rally. 5 weeks before major low.
2020 Mar - No rally. Marginal lower low & major low following week.
So what’s the takeaway on these weekly punches? There is no clear takeaway except that combined with the 10% two day declines stat there is a clear, though not very strong, lean towards seeing a rally that lasts at least a week.
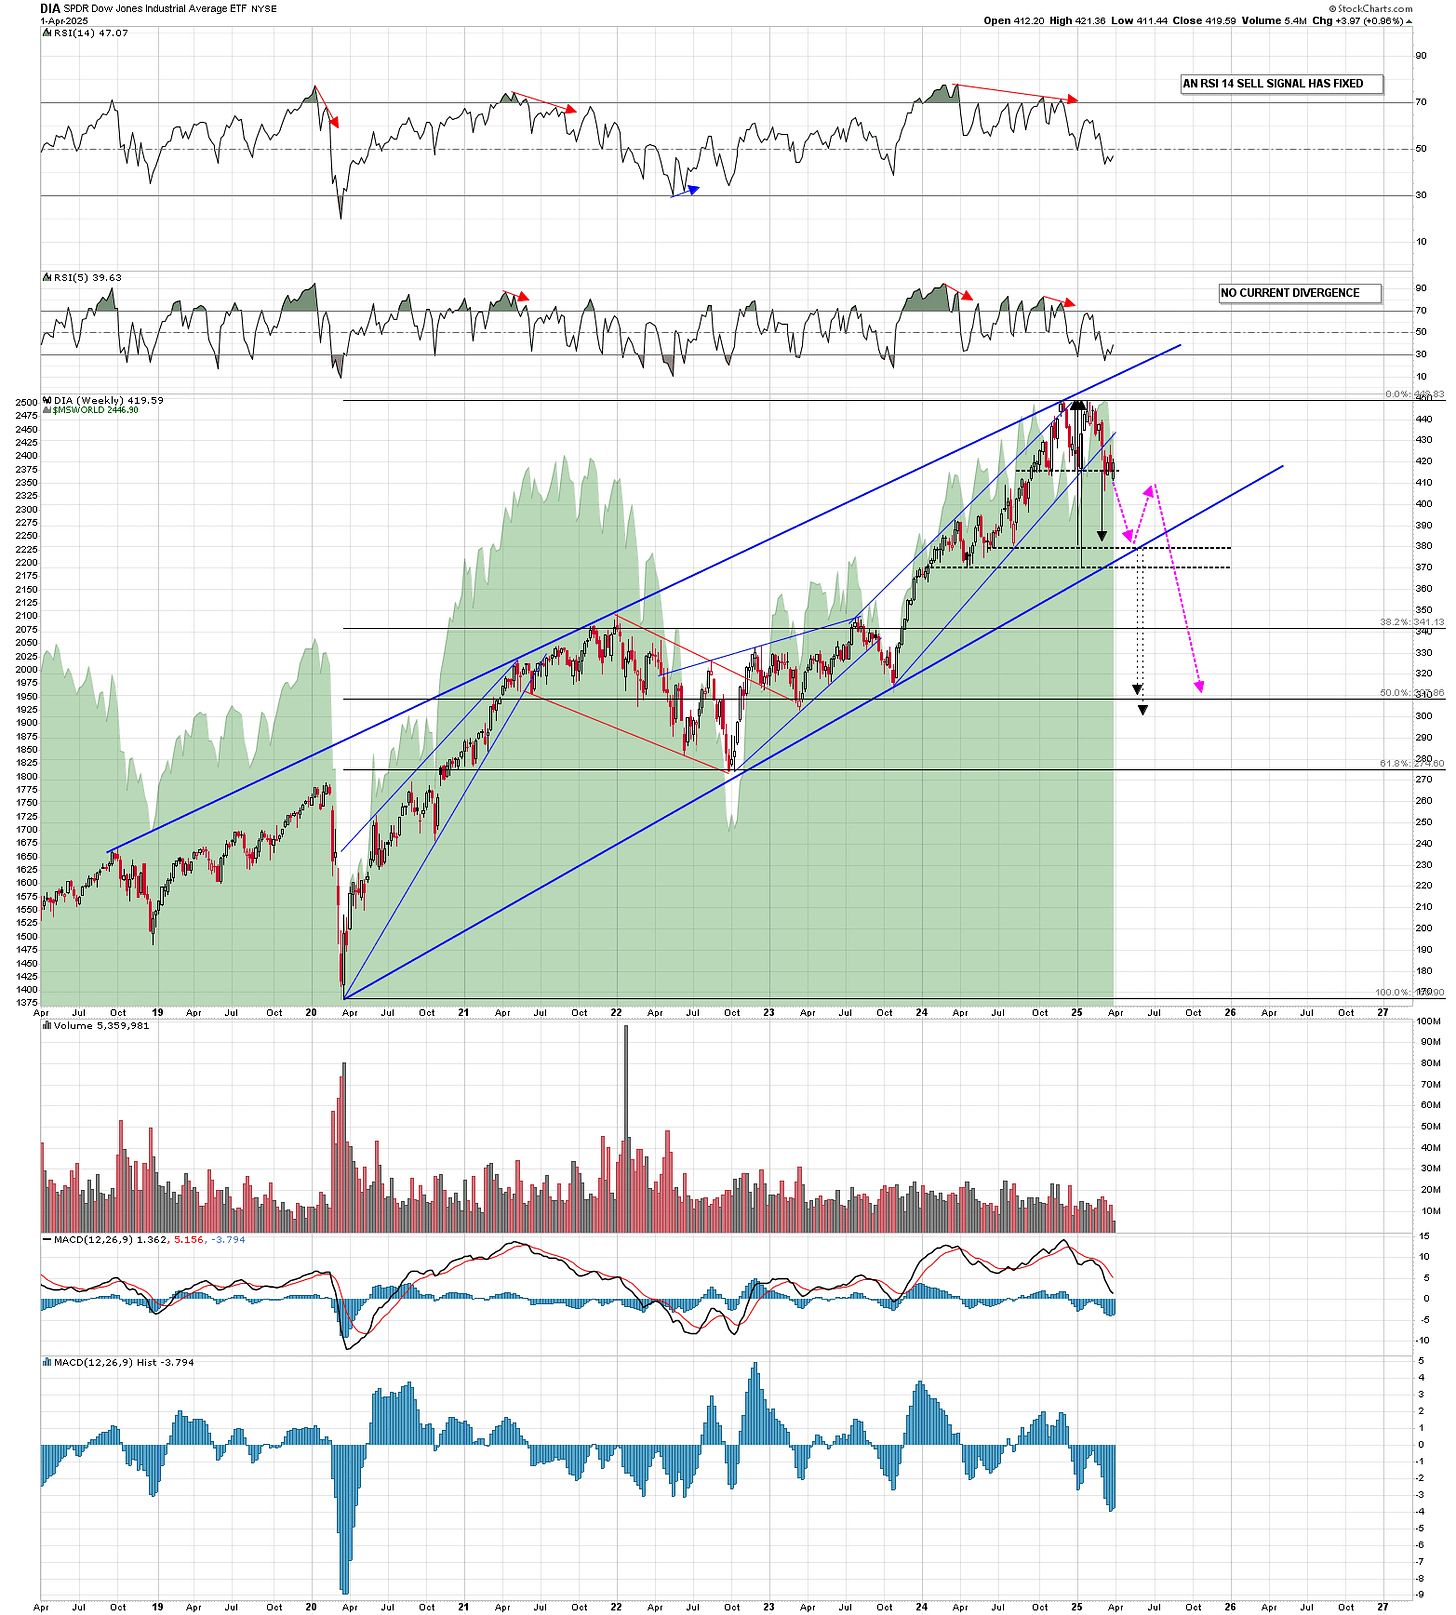
What would I like to see happen here? Well the markets haven’t historically paid much attention to my requests, but I did lay out a possible larger H&S scenario in my post on Tuesday 1st April looking at SPX on my bigger picture substack. A variant of this scenario is still in play, along with the parallel H&S scenarios I was looking at on NDX/QQQ and DIA in my post on Wednesday 2nd April. I think possible H&S right shoulders may be be forming on all three at the moment and, if they do, then that will give us a good working roadmap to follow while the rest of this bear market plays out. The DIA chart I posted on 2nd April is the one below, showing two possible H&S neckline targets and showing arrows based on the higher one.
DIA weekly chart - bear market projection from 2nd April:
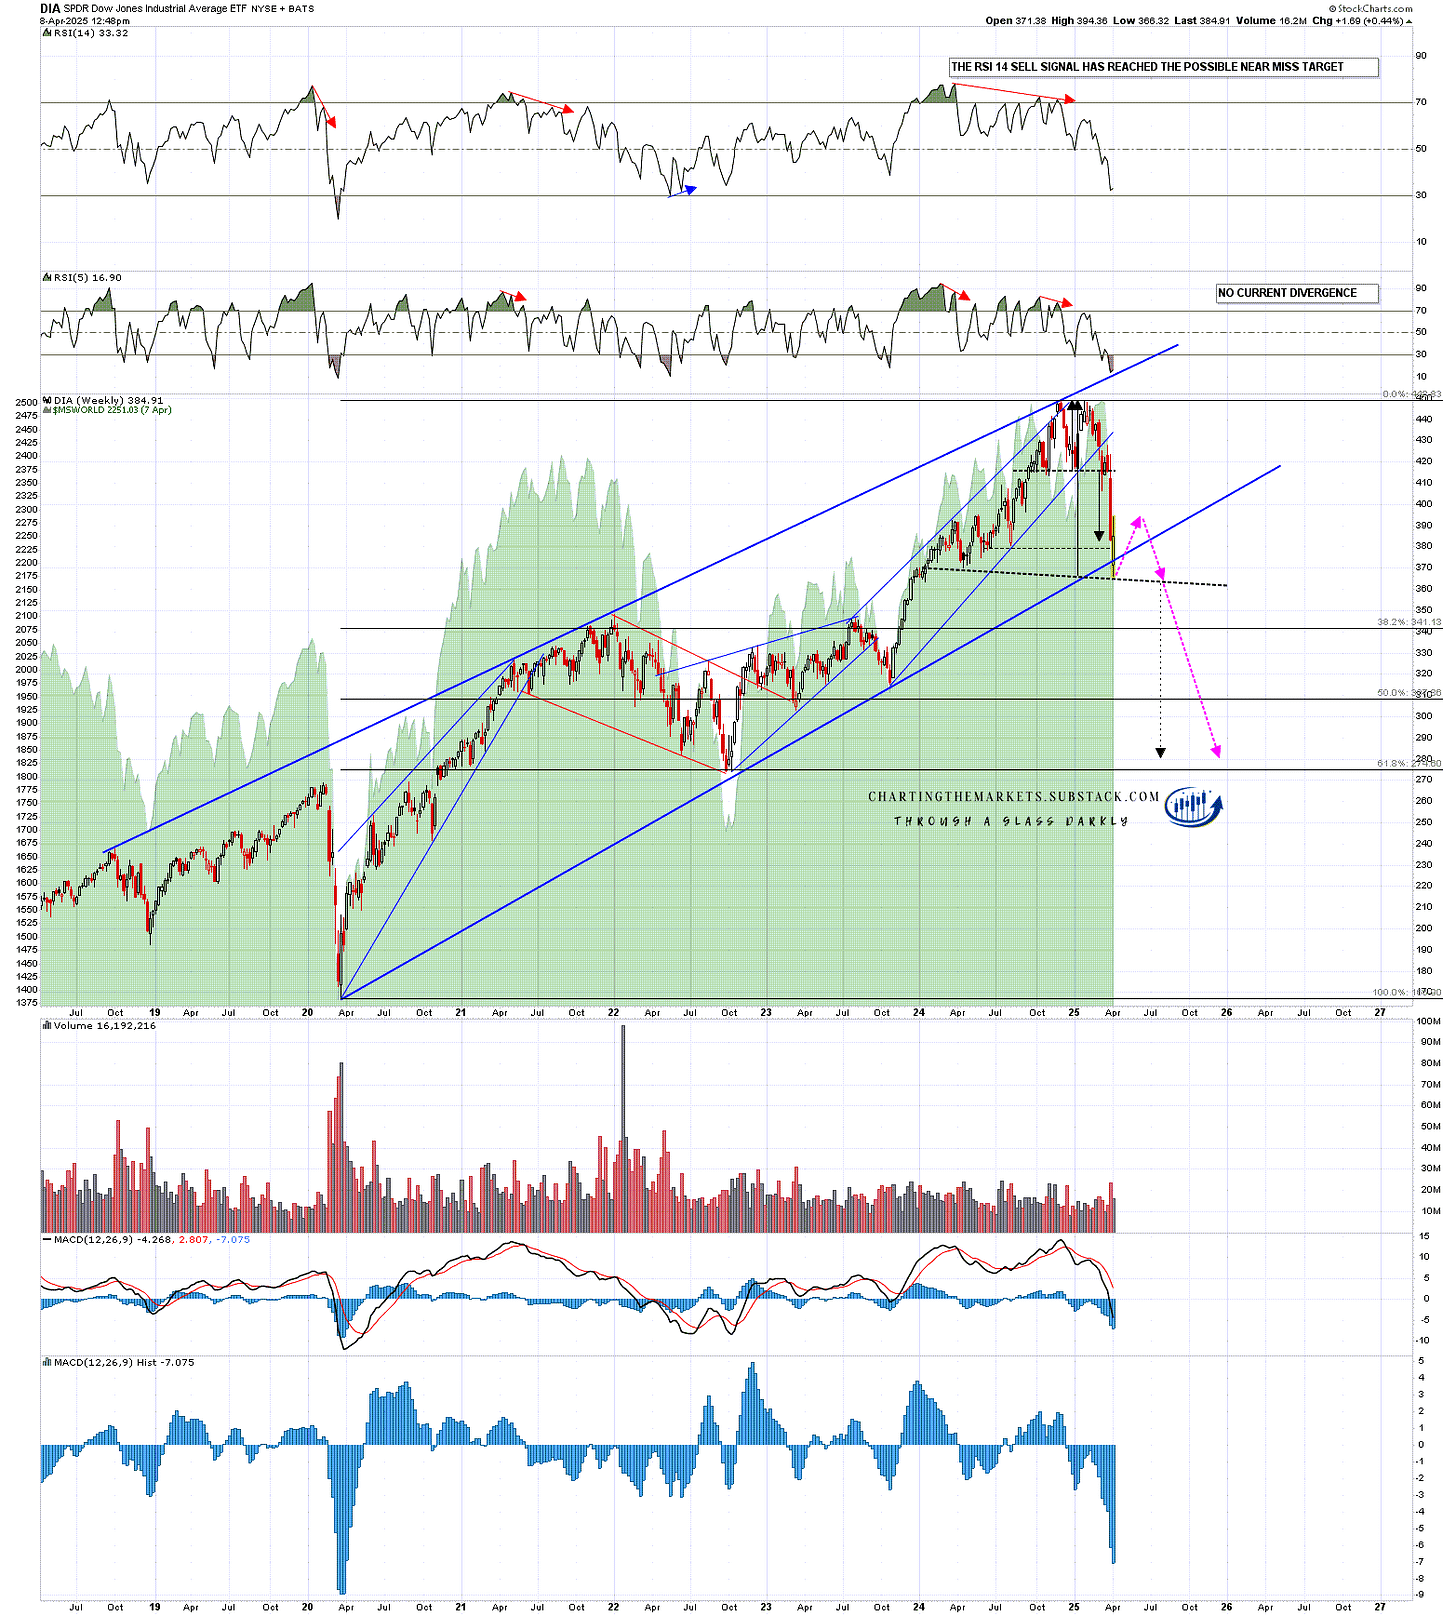
On DIA a right shoulder on an H&S may be forming from slightly under the lower neckline area I showed last week. Ideally this right shoulder rally would have a target in the 394 area or a bit higher, and then on a sustained break below the H&S neckline would look for a target in the 280 area, close to the 61.8% retracement of the move up from the 2020 low and the established support level at the 2022 low in the 273-5 area.
DIA weekly chart - bear market projection:
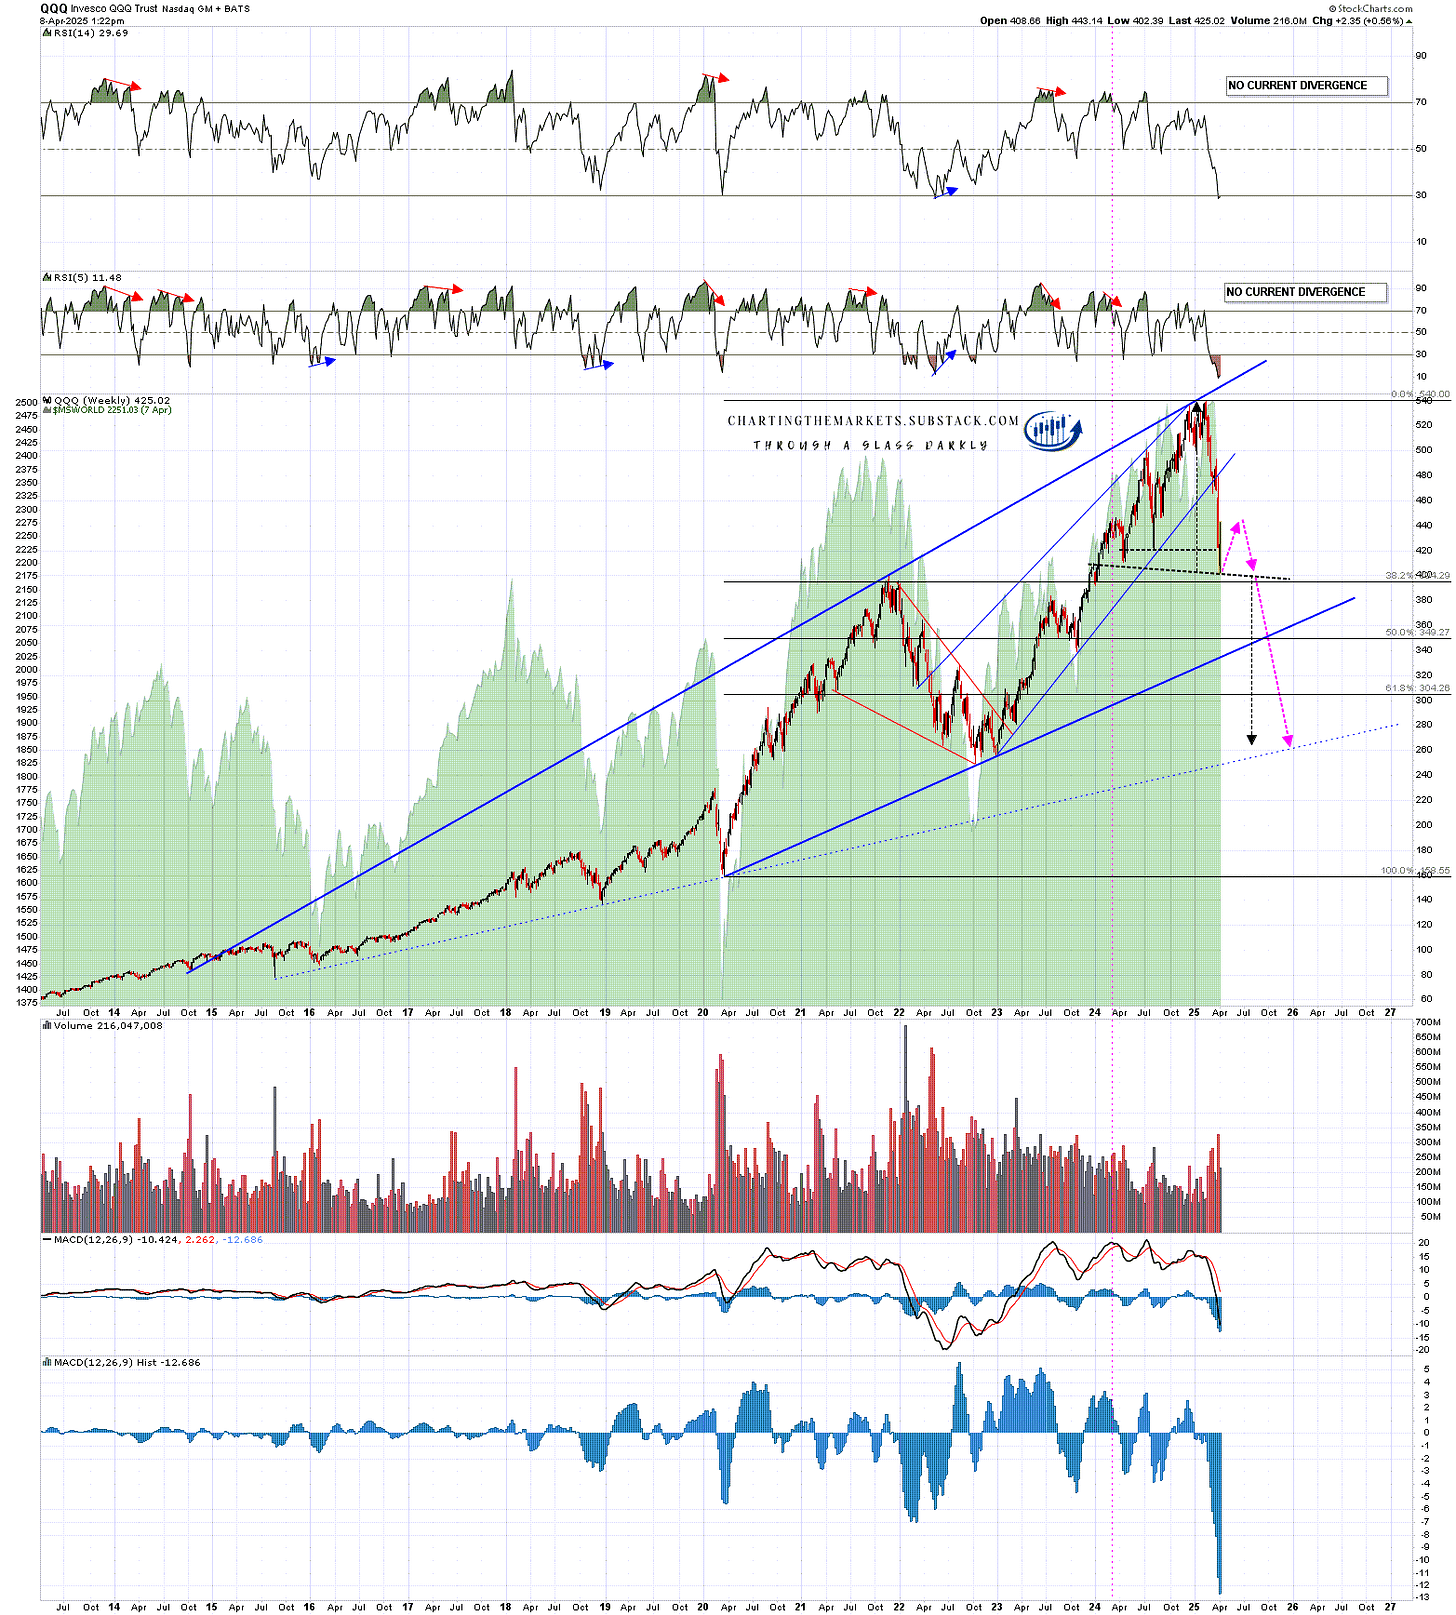
On QQQ a right shoulder on an H&S may be forming from slightly under the lower neckline area I showed last week. Ideally this right shoulder rally would have a target in the 442 area or a bit higher, and then on a sustained break below the H&S neckline would look for a target in the 260 area, close to the established support level in the 245 area.
QQQ weekly chart - bear market projection:
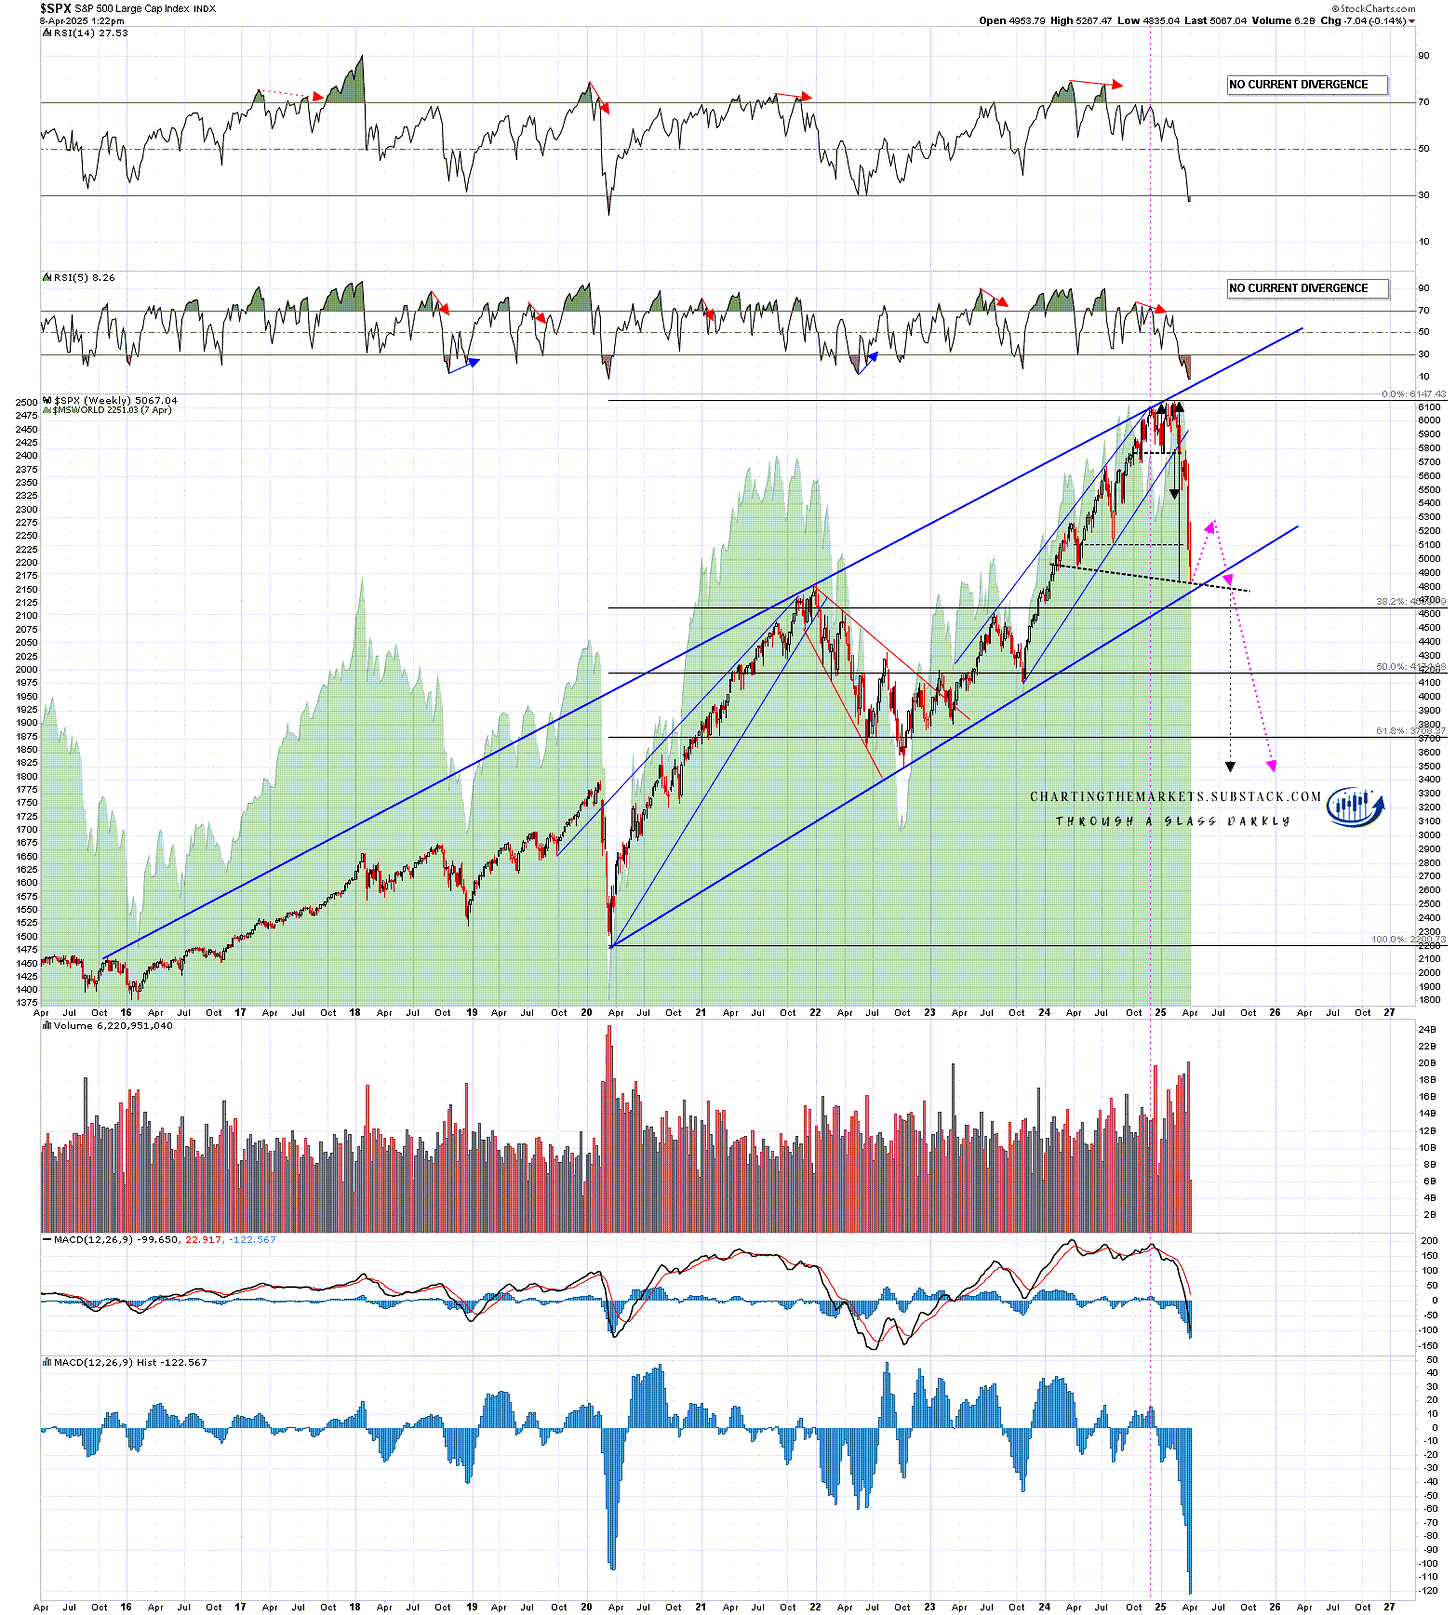
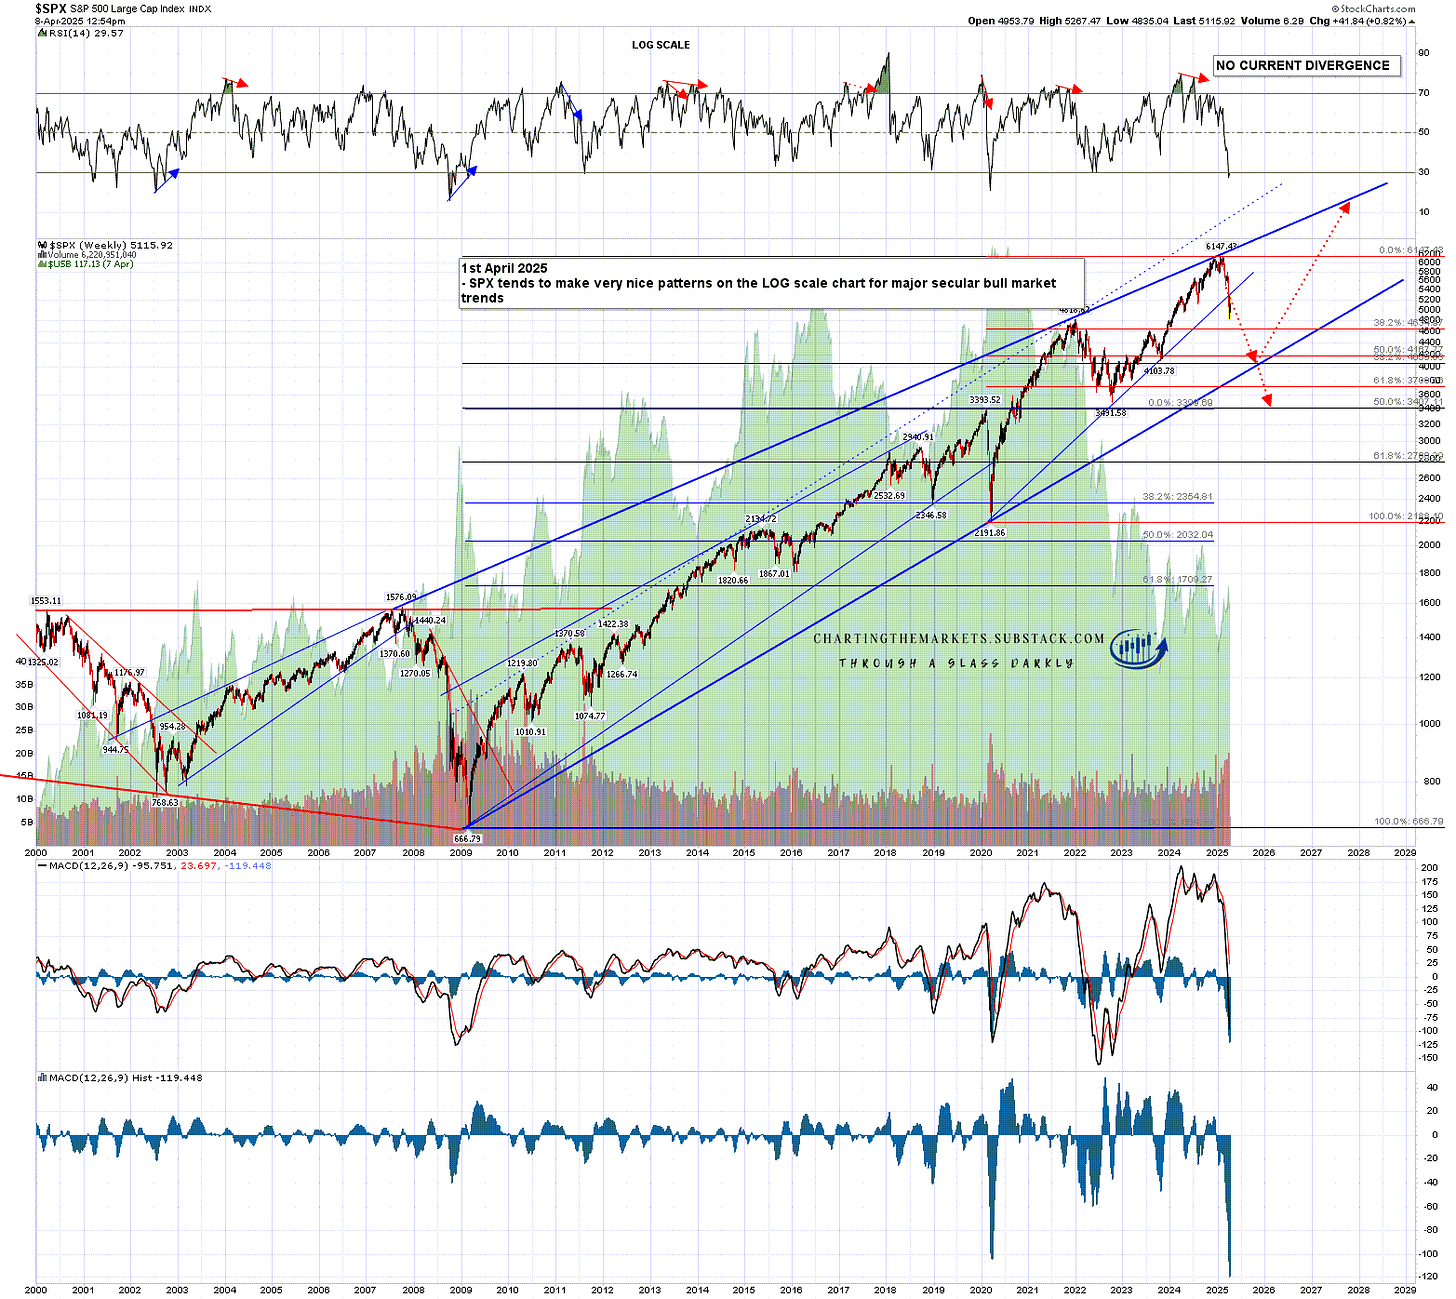
On SPX a right shoulder on an H&S may be forming from slightly under the lower neckline area I showed last week. Ideally this right shoulder rally would have a target in the 5300 area or a bit higher, and then on a sustained break below the H&S neckline would look for a target in the 3480 area, close to the established support level in the 3491 (2022 low) area.
SPX weekly chart - bear market projection:
Are there more reasons to like these possible H&S target areas? Most definitely.
On SPX I mentioned last week that the ideal overall target would be the 50% retracement of the (current theoretically) secular bull market from the 2009 low at 3407. If this H&S forms and plays out then this is a roadmap to reach that ideal target area.
On QQQ the 50% retracement of the (current theoretically) secular bull market from the 2009 low from is in the 280 area and established support from the 2022 low is in the 245 area. A good target range.
On DIA the 38.2% and 50% retracements of the (current theoretically) secular bull market from the 2009 low are in the 295 and 250 areas and the 61.8% retracement of the cyclical bull market from the 2020 low is in the 245 area. Again a good target range.
SPX weekly (LOG) chart - secular market patterns since 2000:
I don’t like to assume anything, mainly taking my view on prices just from market action, but I really like these downside scenarios and the economic backdrop looks very favorable for a deep bear market developing over the coming months. I’ll be watching this develop very carefully and would note that if I am right, my working assumption is that such a deep bear market would play out over the next six months to a year, and might take as long as eighteen months.
As I have been since the start of 2025 I’m still leaning on the bigger picture towards a weak first half of 2025 and new all time highs later in the year, very possibly as a topping process for a much more significant high. One way or another I think we’ll be seeing lower soon and I’m not expecting this to be a good year for US equities, not least because both of the last two years have been banner years for US equities. A third straight year of these kinds of gains looks like a big stretch. I could of course however be mistaken. UPDATE 11th March 2025 - I am wondering if this may be a bear market that dominates the whole of 2025.
If you like my analysis and would like to see more, please take a free subscription at my chartingthemarkets substack, where I publish these posts first. I also do a premarket video every day on equity indices, bonds, currencies, energies, precious commodities and other commodities at 8.45am EST. If you’d like to see those I post the links every morning on my twitter, and the videos are posted shortly afterwards on my Youtube channel.

No comments:
Post a Comment