
I posted the first Bitcoin (BTCUSD) chart below at the end of December and there are two notes that I made on it then that are worth another look today.
The more important one of those is that I noted that any sharp decline on equity indices takes Bitcoin down with it, and we have most definitely been seeing that. On the flip side, any significant rally in equities will likely take Bitcoin up with it.
The other note I made that is worth remembering is that I noted that all of the RSI 5 buy and sell signals on this chart reached the full target (at 70 on RSI 5 for buy signals and 30 on RSI 5 for sell signals).
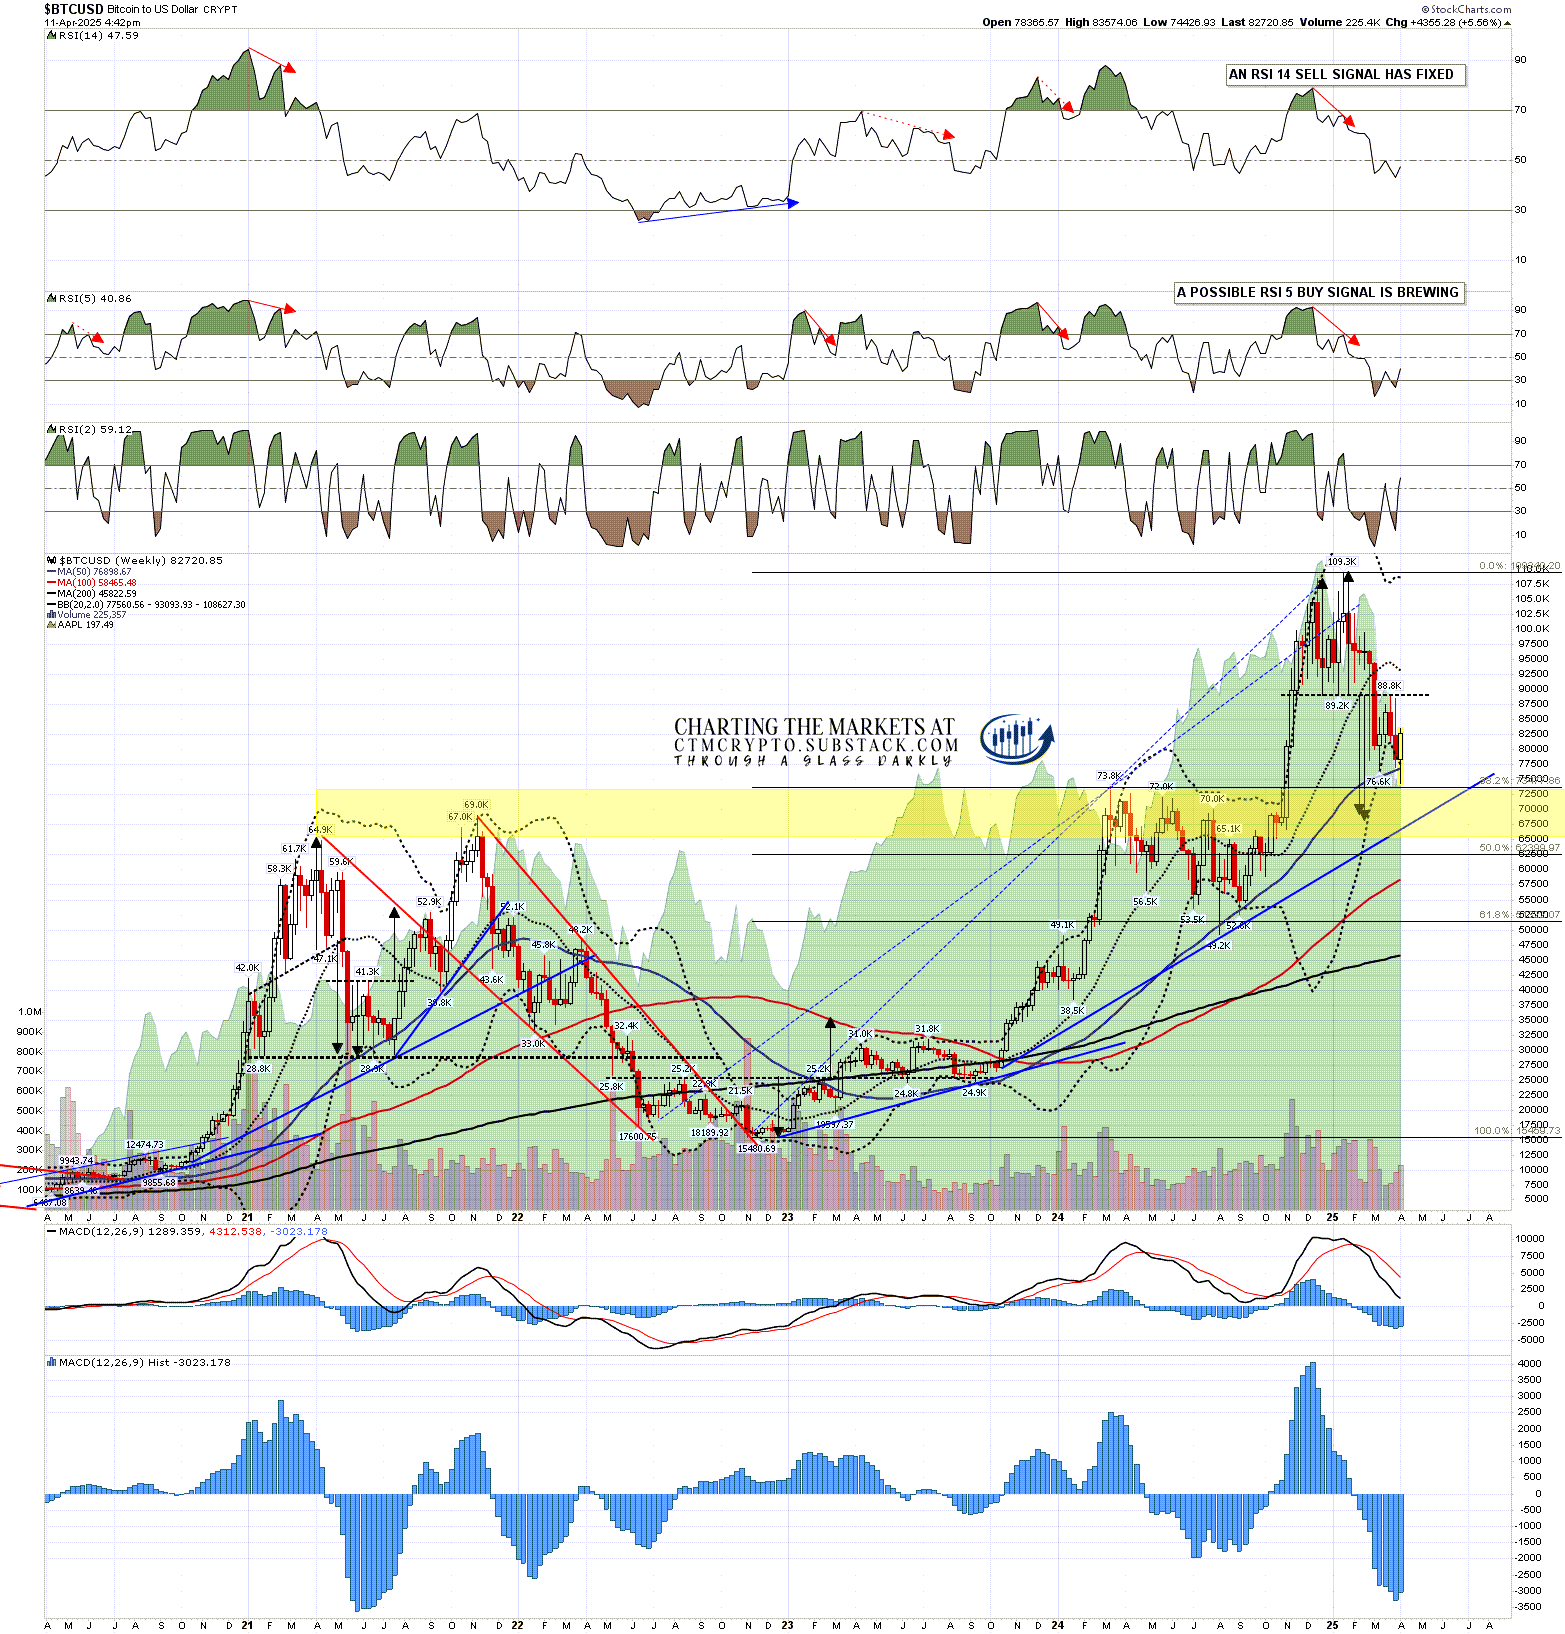
These are important because we may be starting a rally on equities here that could last two or three months, and because there is a possible RSI 5 buy signal brewing on the chart below that will fix at the close tonight unless there is a sharp decline on Bitcoin between now and today’s close.
There is an opportunity for a significant rally here and I’ll be sketching out my preferred targets and a possible path to those targets today.
BTCUSD weekly (LOG) vs NDX chart:
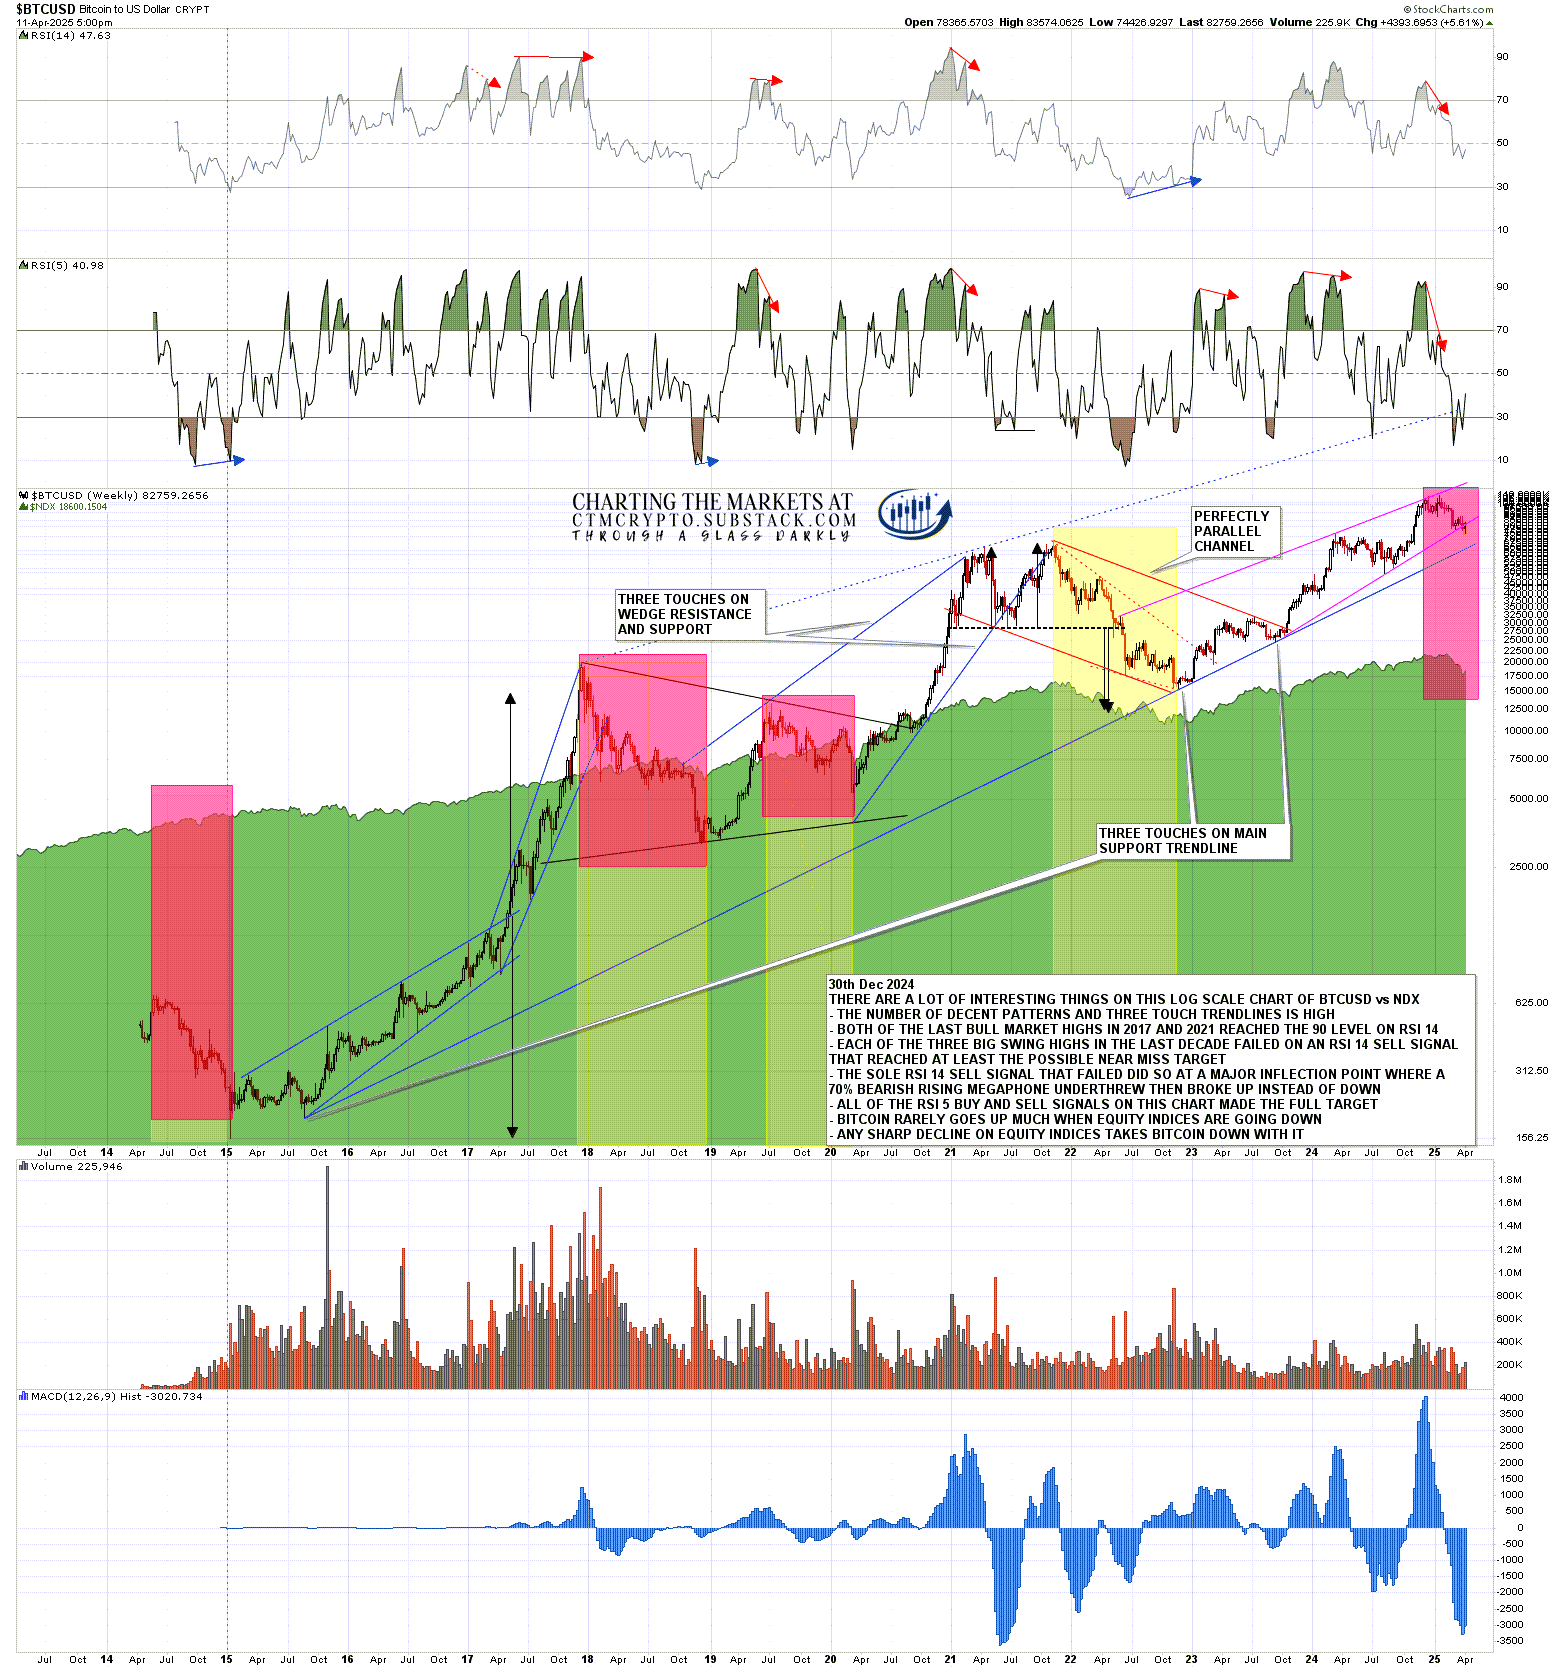
On the standard weekly chart I would note that Bitcoin has not yet reached the double top target in the 69k - 70k area. That might still need to be made before a rally but given that I’m exopecting to see more downside on equities after this rally then it may just be that this target would be reached then.
BTCUSD weekly chart:
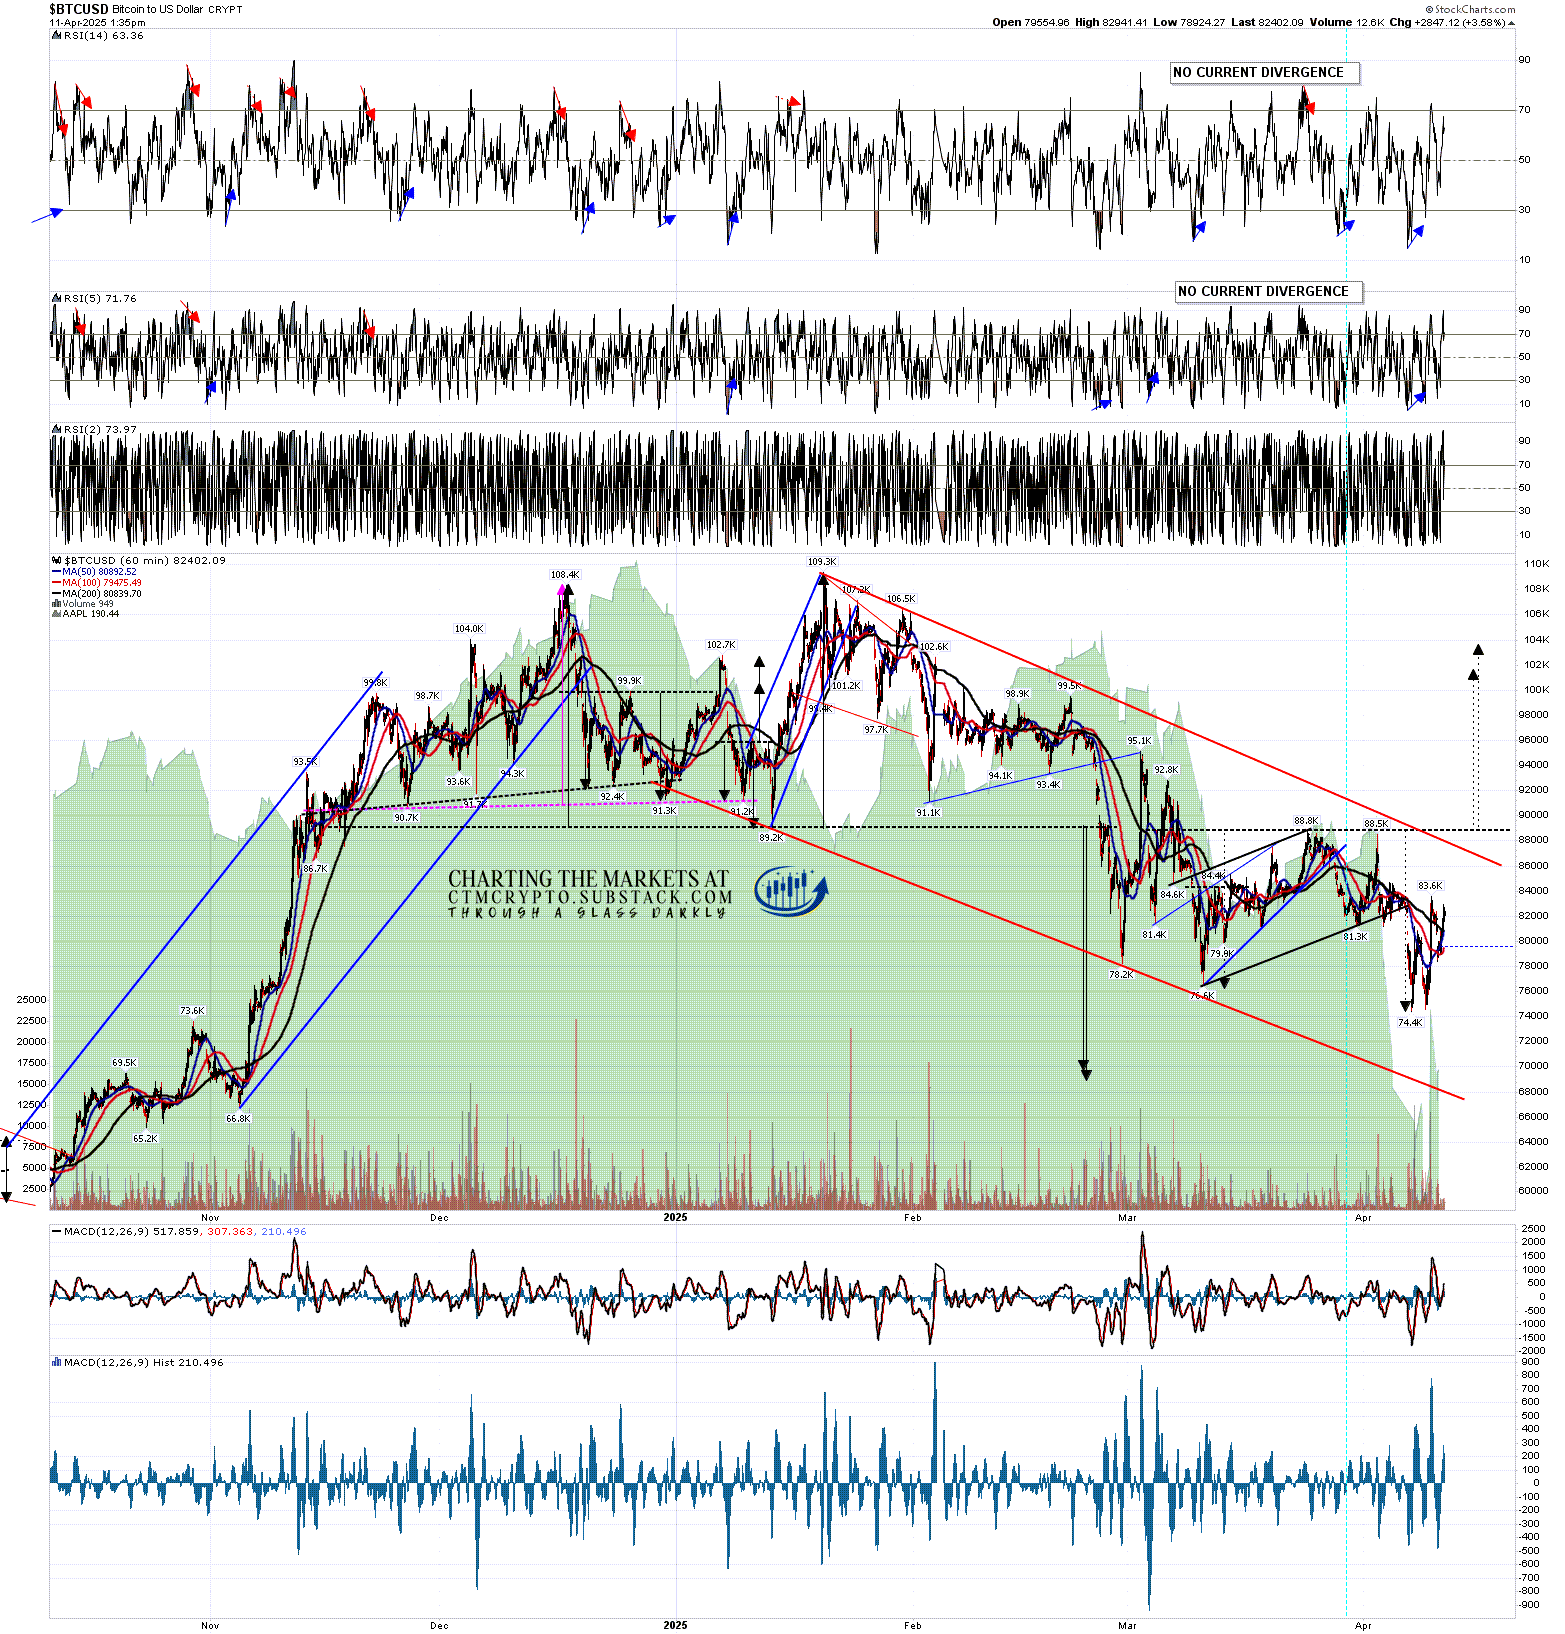
On the Bitcoin hourly chart there is a decent falling wedge from the highs and wedge resistance is now in the 87.8k area. On a break above that is double bottom resistance in the 88.8k area, another possible point of failure, and on a sustained break up over 88.8k there would be a double bottom target in the 102-4k area.
BTCUSD 60min chart:
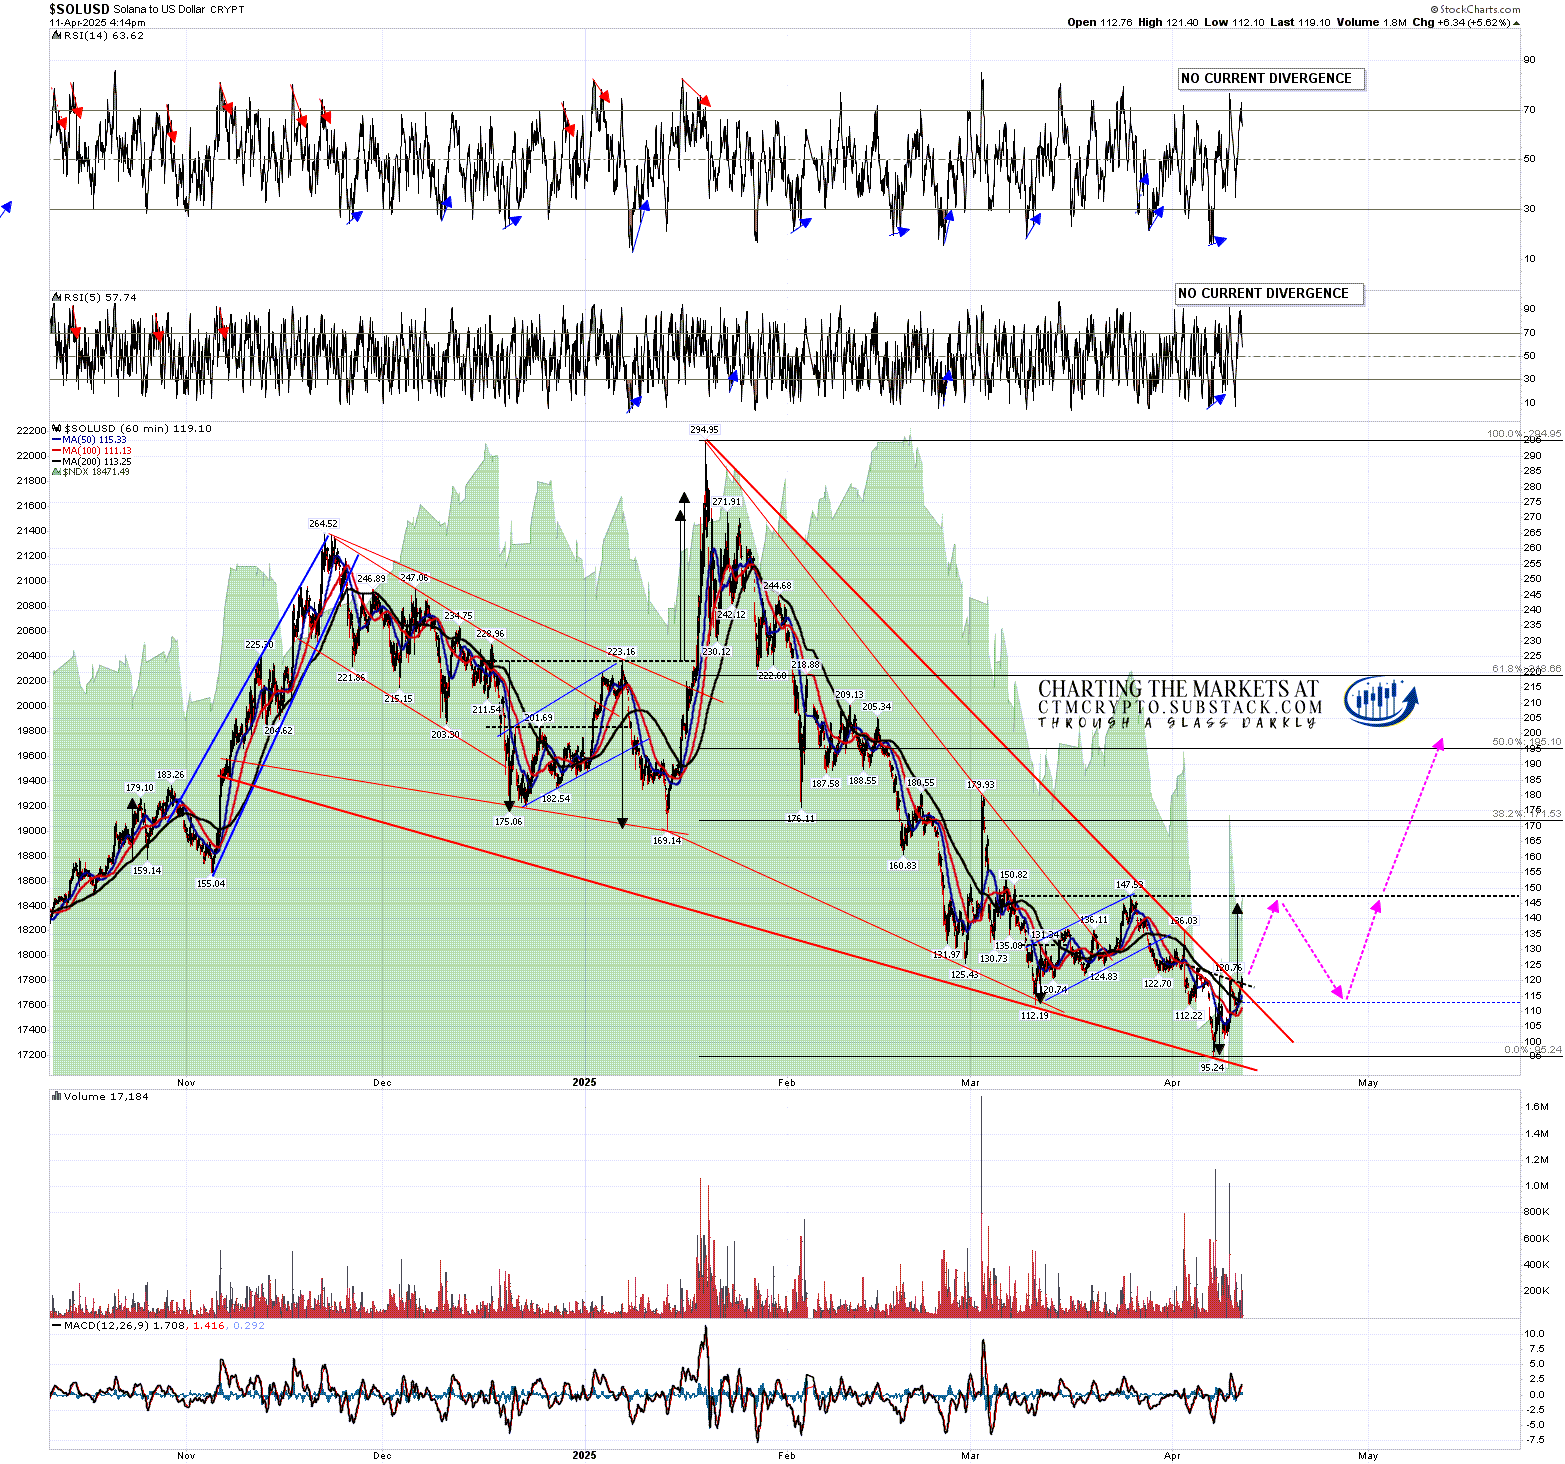
On the Solana (SOLUSD) hourly chart there is a decent quality falling wedge from the all time high that started to break up today, I’m not sold on a double bottom setup here as it would currently be of poor quality but there is a possible IHS neckline in the 147.59 area, and a small IHS has broken up with a target in that area. I am definitely liking the odds of reaching that.
Once that 147.59 area was reached Solana could fail there or break up directly with a weak asymmetric double bottom target in the 183-200 range, or an IHS right shoulder could then form on an IHS that on a suistained break over 148 would then look for a target in the 200 area, close to a 50% retracement of the decline from the high.
SOLUSD 60min chart:
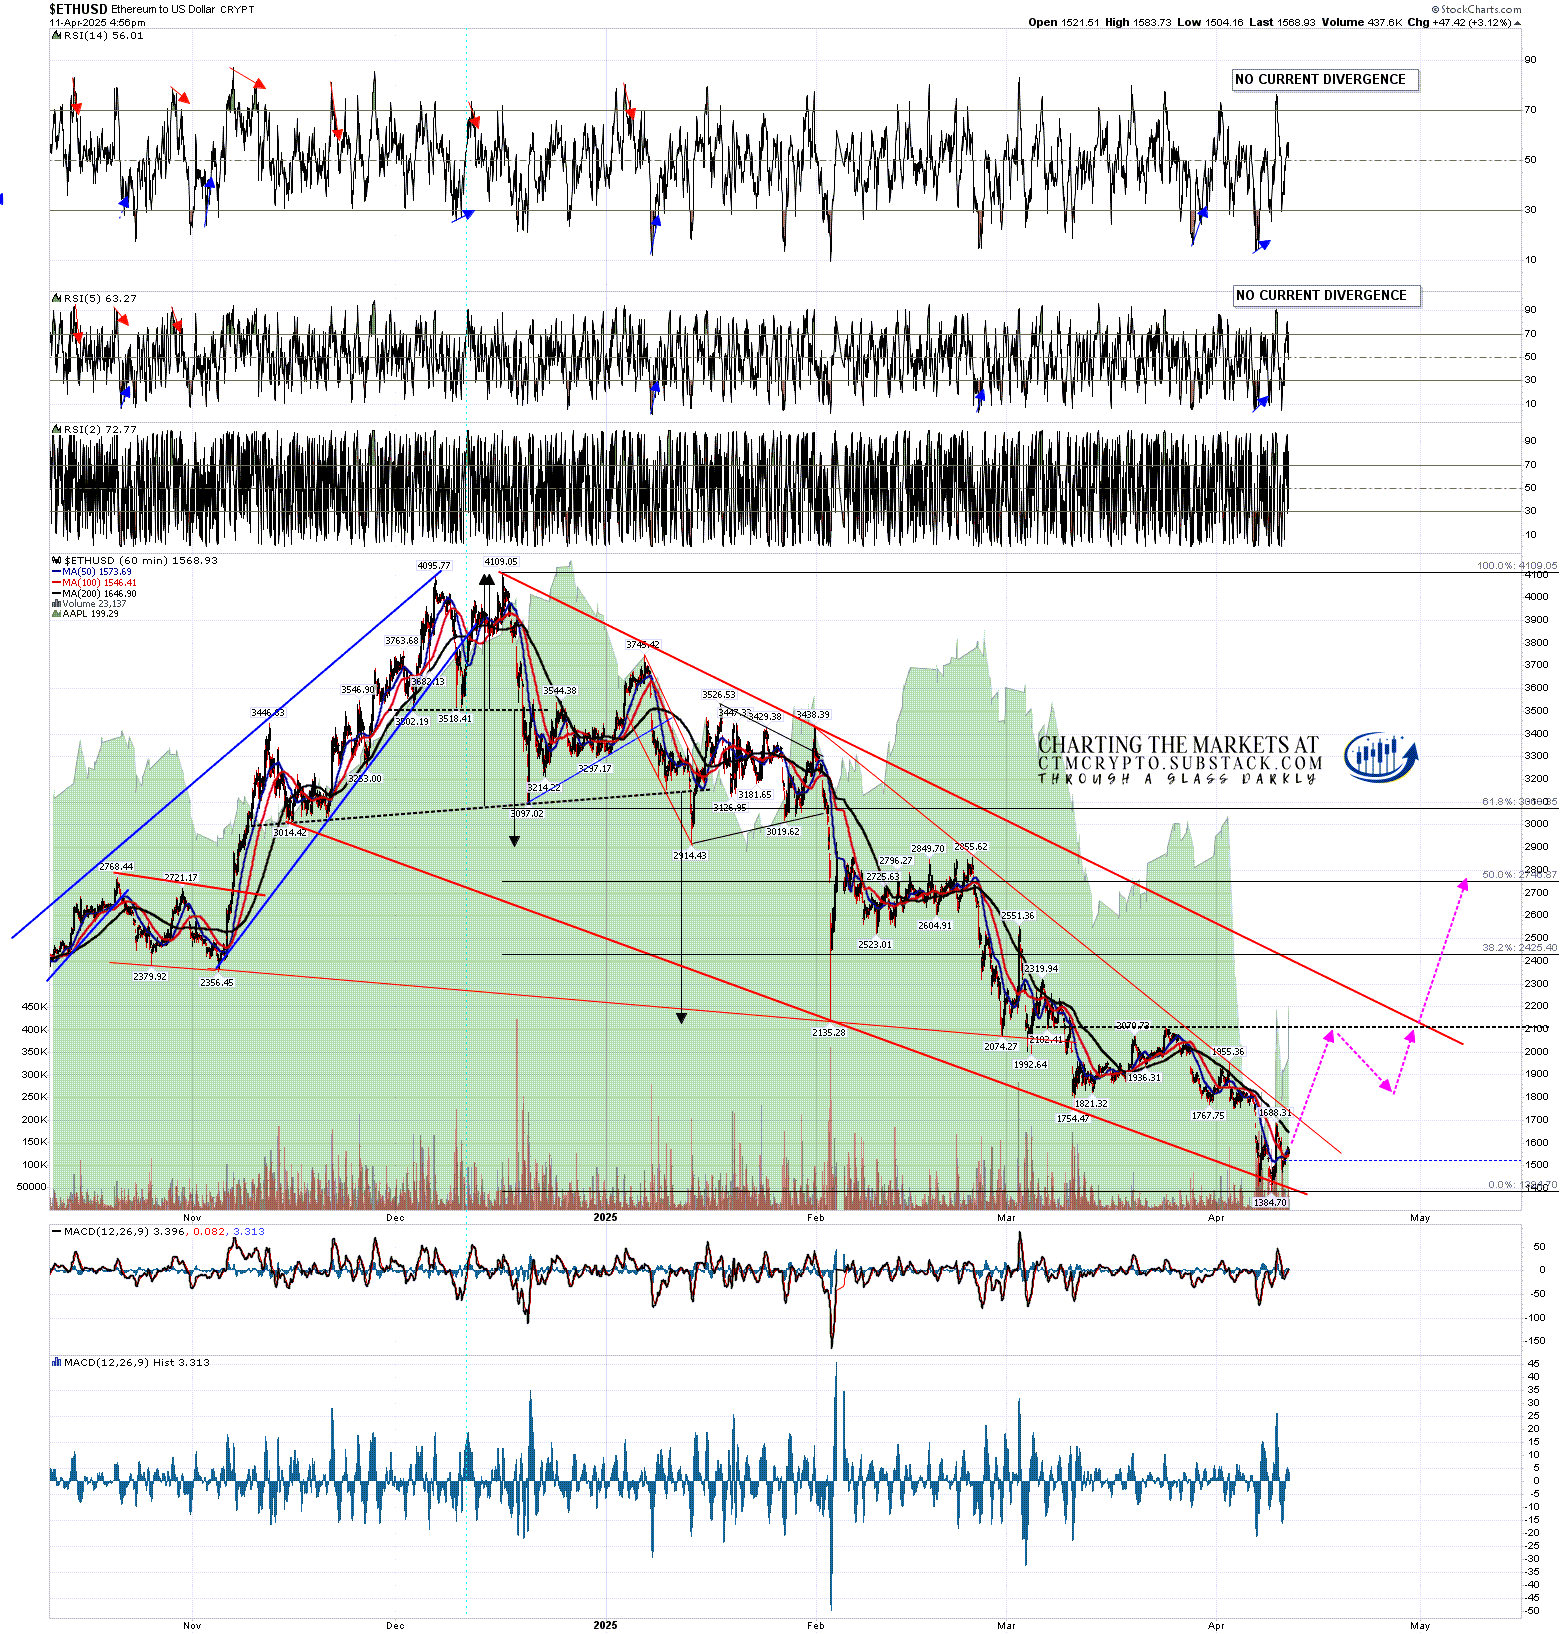
On the Ethereum (ETHUSD) hourly chart there is also a decent quality falling wedge from the late 2024 high that hasn’t yet broken up, but would do on any rally over 1750. There is no double bottom setup here really but there is a possible IHS neckline in the 2104 area
If that 2104 area was reached Ethereum could fail there or a possible IHS right shoulder could then form that on a subsequent sustained break over 2104 would then look for a target in the 2800 area, close to a 50% retracement of the decline from the high.
ETHUSD 60min chart:
These are decent looking rally scenarios on all three of these and I’ll be watching with interest. I would also note that Bitcoin has been holding up remarkably well in recent weeks considering the wild declines we have seen on the equity markets. I am wondering whether this could be the start of Bitcoin becoming a flight to safety destination as an alternative to US treasuries. If you’re interested I’ll be looking at that more in a post over the weekend on my The Bigger Picture substack.
Everyone have a great weekend. :-)
So far this year I have been and am still leaning towards seeing weakness in the first half of the year and renewed strength in the second half of 2025, with a very possible bull market high on Crypto pencilled in close to the end of the year. That scenario would be a good match with past Crypto bull markets. Is it possible that I am mistaken? Always, but we can only ever try to identify the higher probability paths in the future. Only time can show us the path that is actually taken. Still, I’m with Confucious who said ‘study the past, if you would divine the future’.
If you’d like to see more of these posts and the other Crypto videos and information I post, please subscribe for free to my Crypto substack. I also do a premarket video every day on Crypto at 9.05am EST. If you’d like to see those I post the links every morning on my twitter, and the videos are posted shortly afterwards on my Youtube channel.
I'm also to be found at Arion Partners, though as a student rather than as a teacher. I've been charting Crypto for some years now, but am learning to trade and invest in them directly, and Arion Partners are my guide around a space that might reasonably be compared to the Wild West in one of their rougher years.

No comments:
Post a Comment