
In my last post on Thursday I was projecting a possible path for US indices if we are going to see decent quality bear flags form on this rally, and initially they were going to need to go down, which they have. They overshot my target trendline options at the lows yesterday, but that’s fine, as long as they turn back up in this area or not too far below into new highs for this rally.
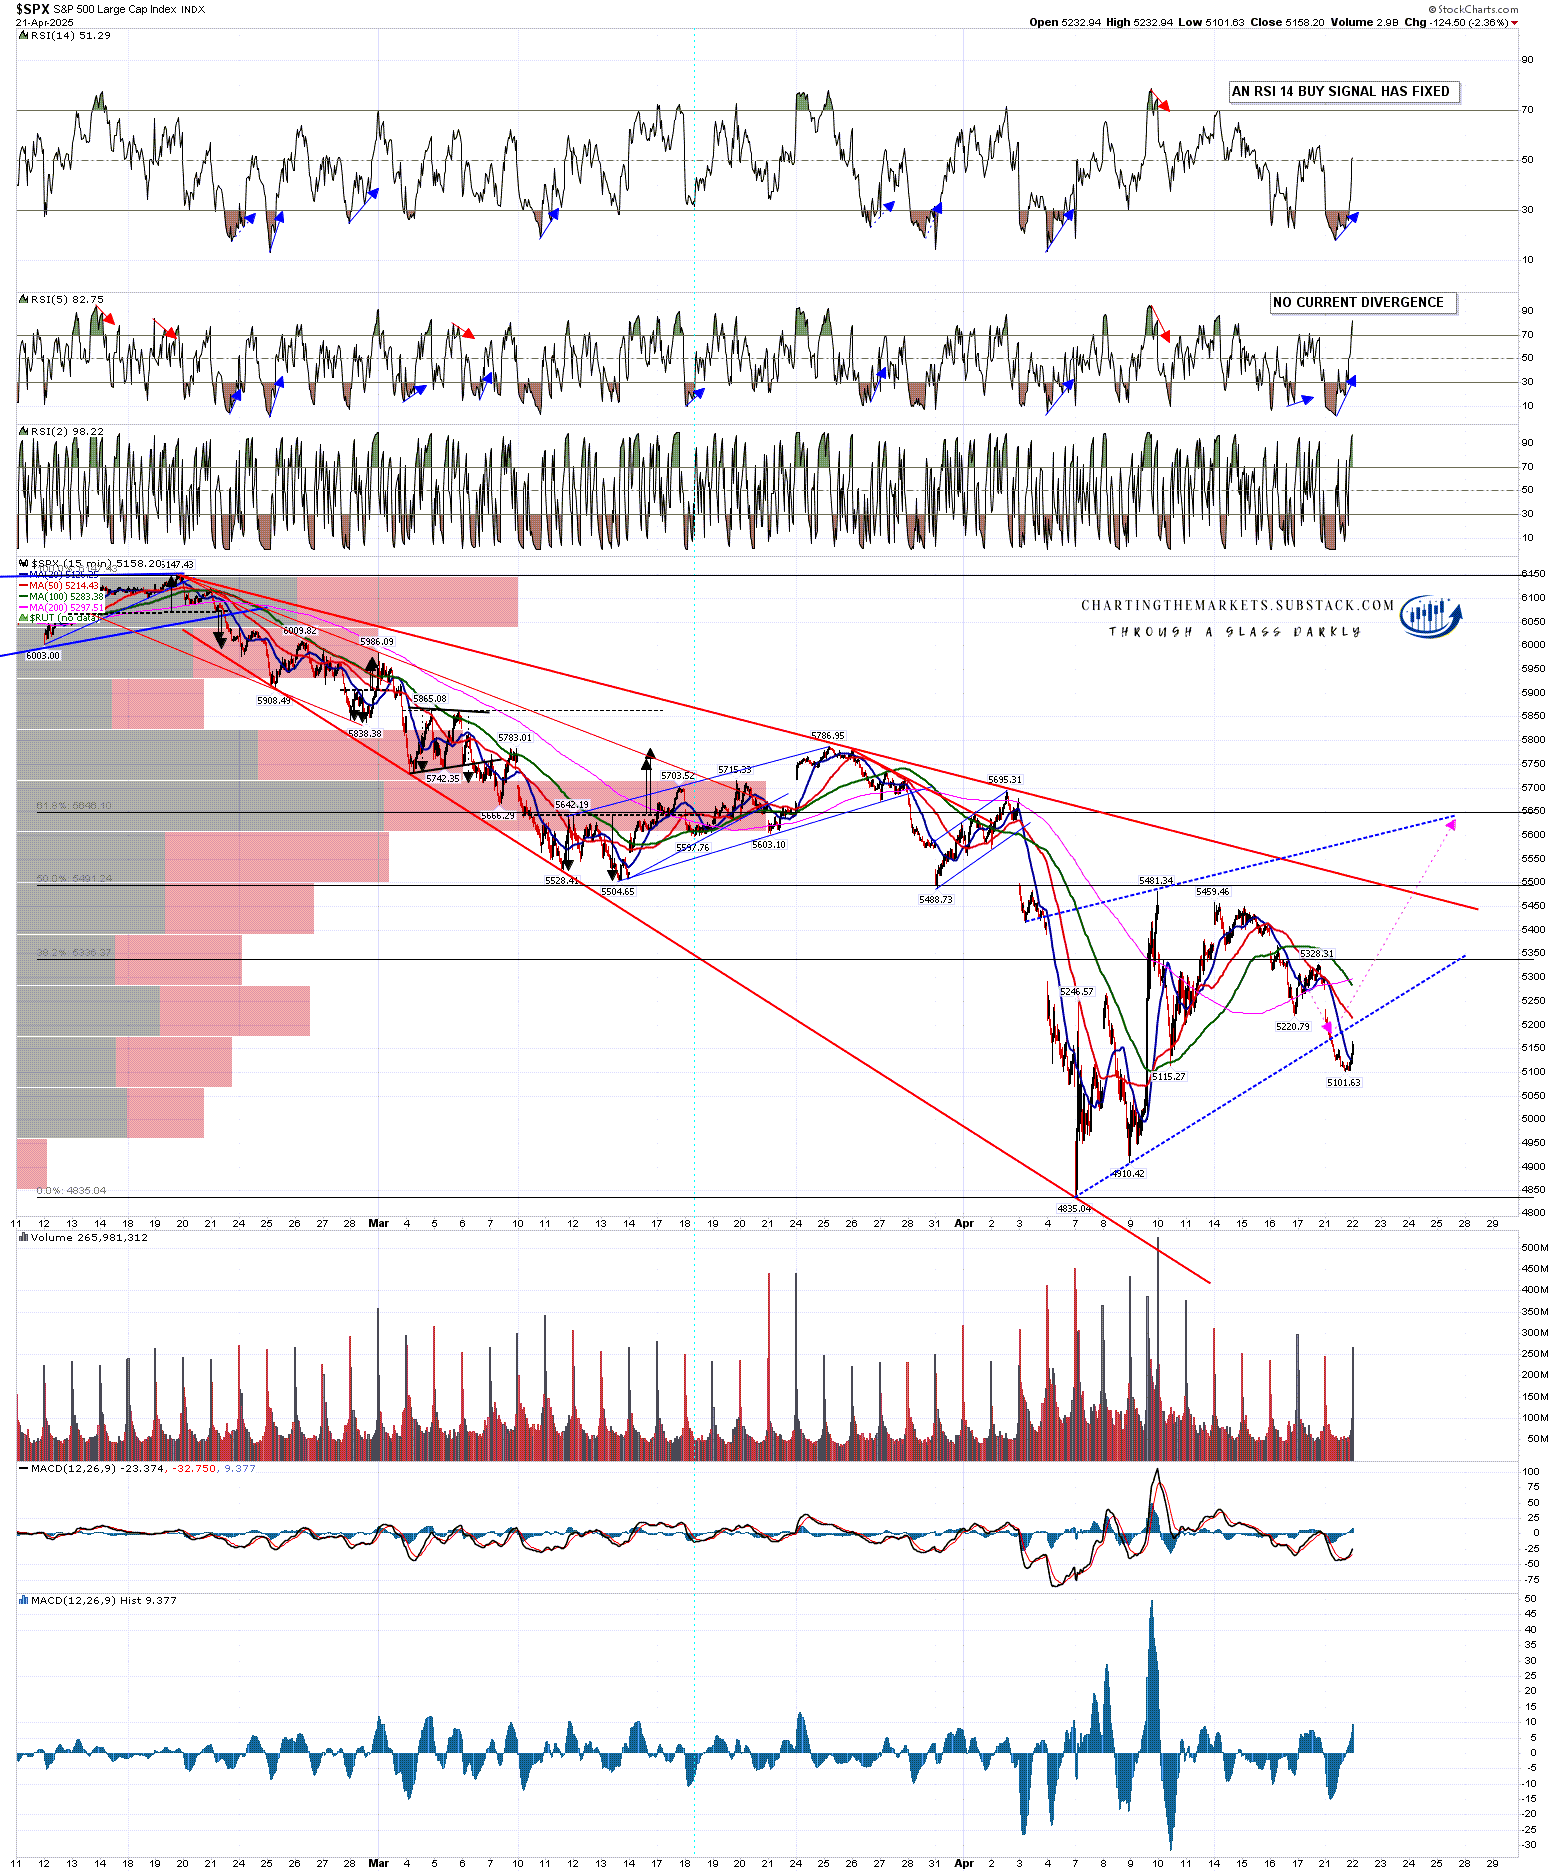
On the SPX chart the current low could make a very decent support trendline and, if we see a next leg up start towards a new rally high, the ideal target would be the resistance trendline currently in the 5590 area. Possible resistance on the way at declining resistance from the high, currently in the 5500 area. A 15min RSI 14 buy signal has fixed.
SPX 15min chart:
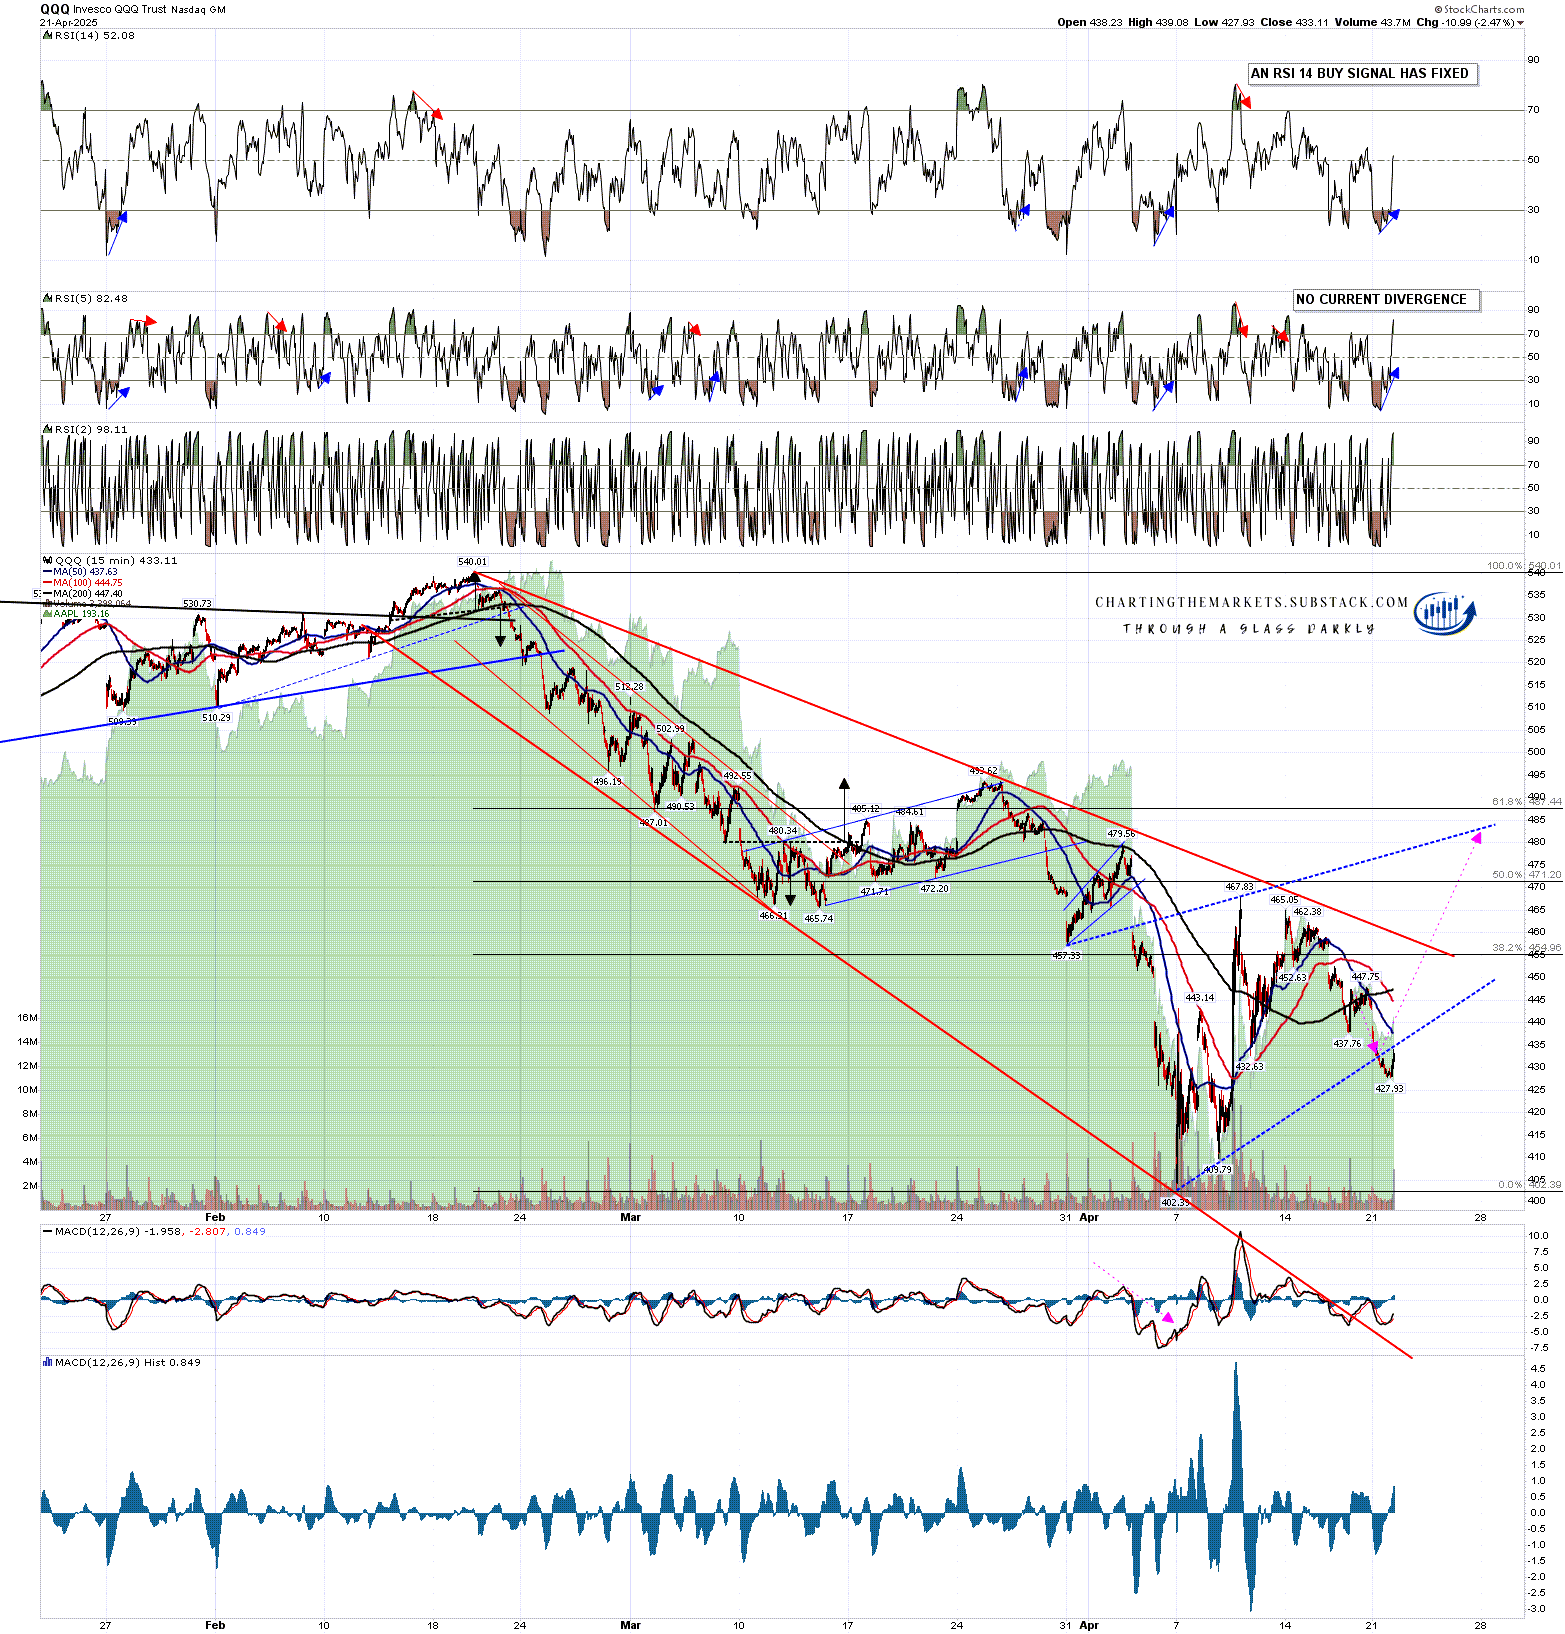
On the QQQ chart the current low could make a very decent support trendline and, if we see a next leg up start towards a new rally high, the ideal target would be the resistance trendline currently in the 485 area. Possible resistance on the way at declining resistance from the high, currently in the 460 area. A 15min RSI 14 buy signal has fixed.
QQQ 15min chart:
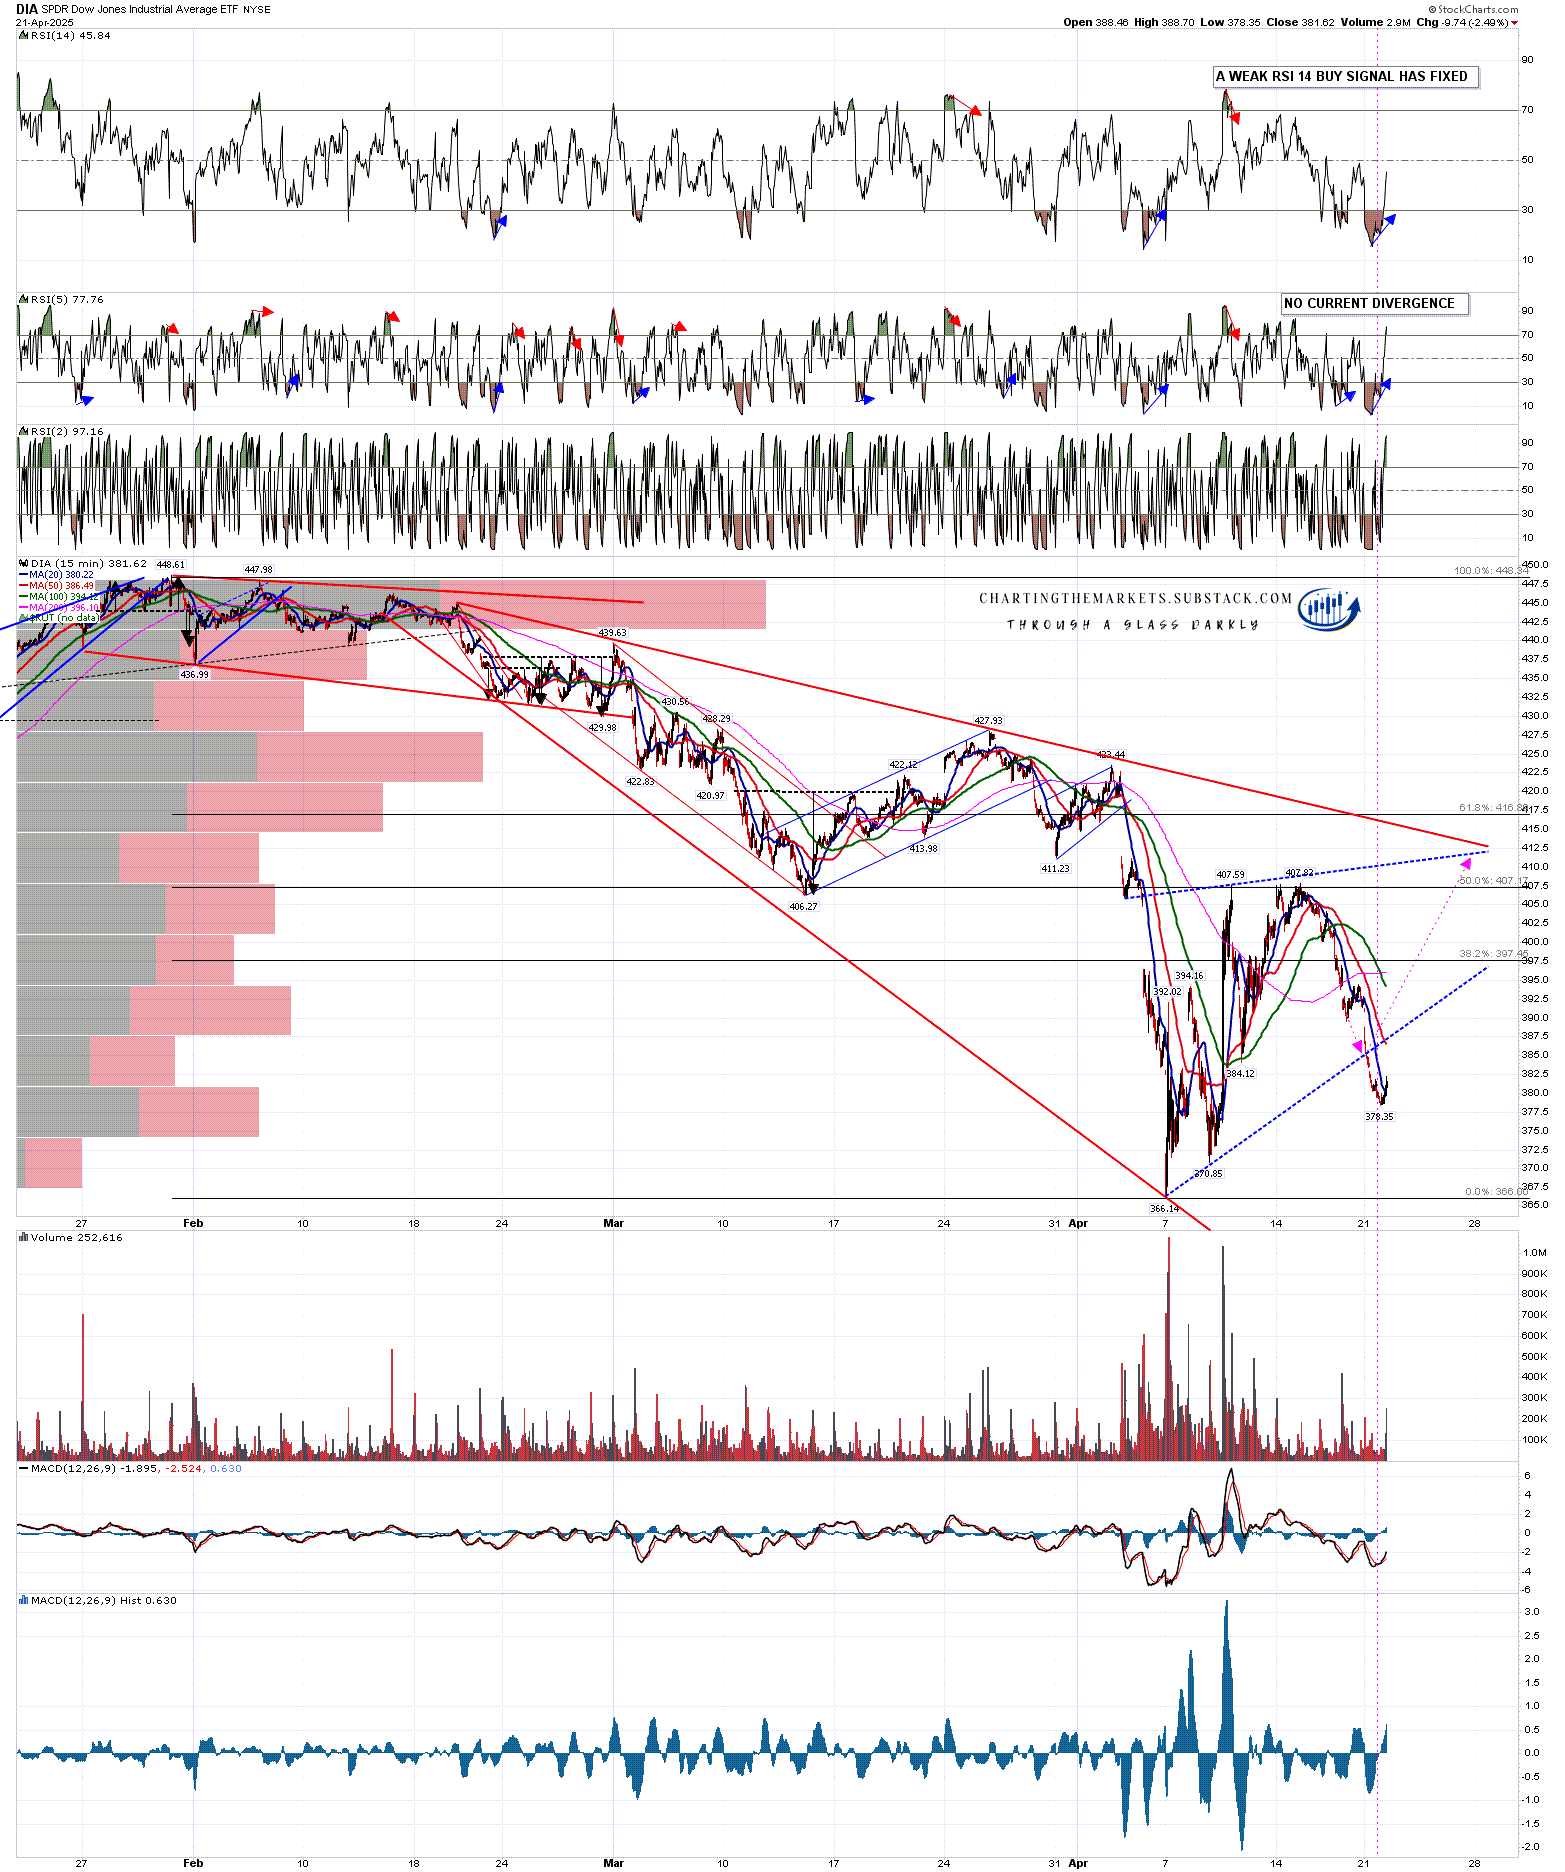
On the DIA chart the current low could make a very decent support trendline and, if we see a next leg up start towards a new rally high, the ideal target would be the resistance trendline currently in the 411 area. Possible resistance slightly above at declining resistance from the high, currently in the 416 area. A 15min RSI 14 buy signal has fixed.
DIA 15min chart:
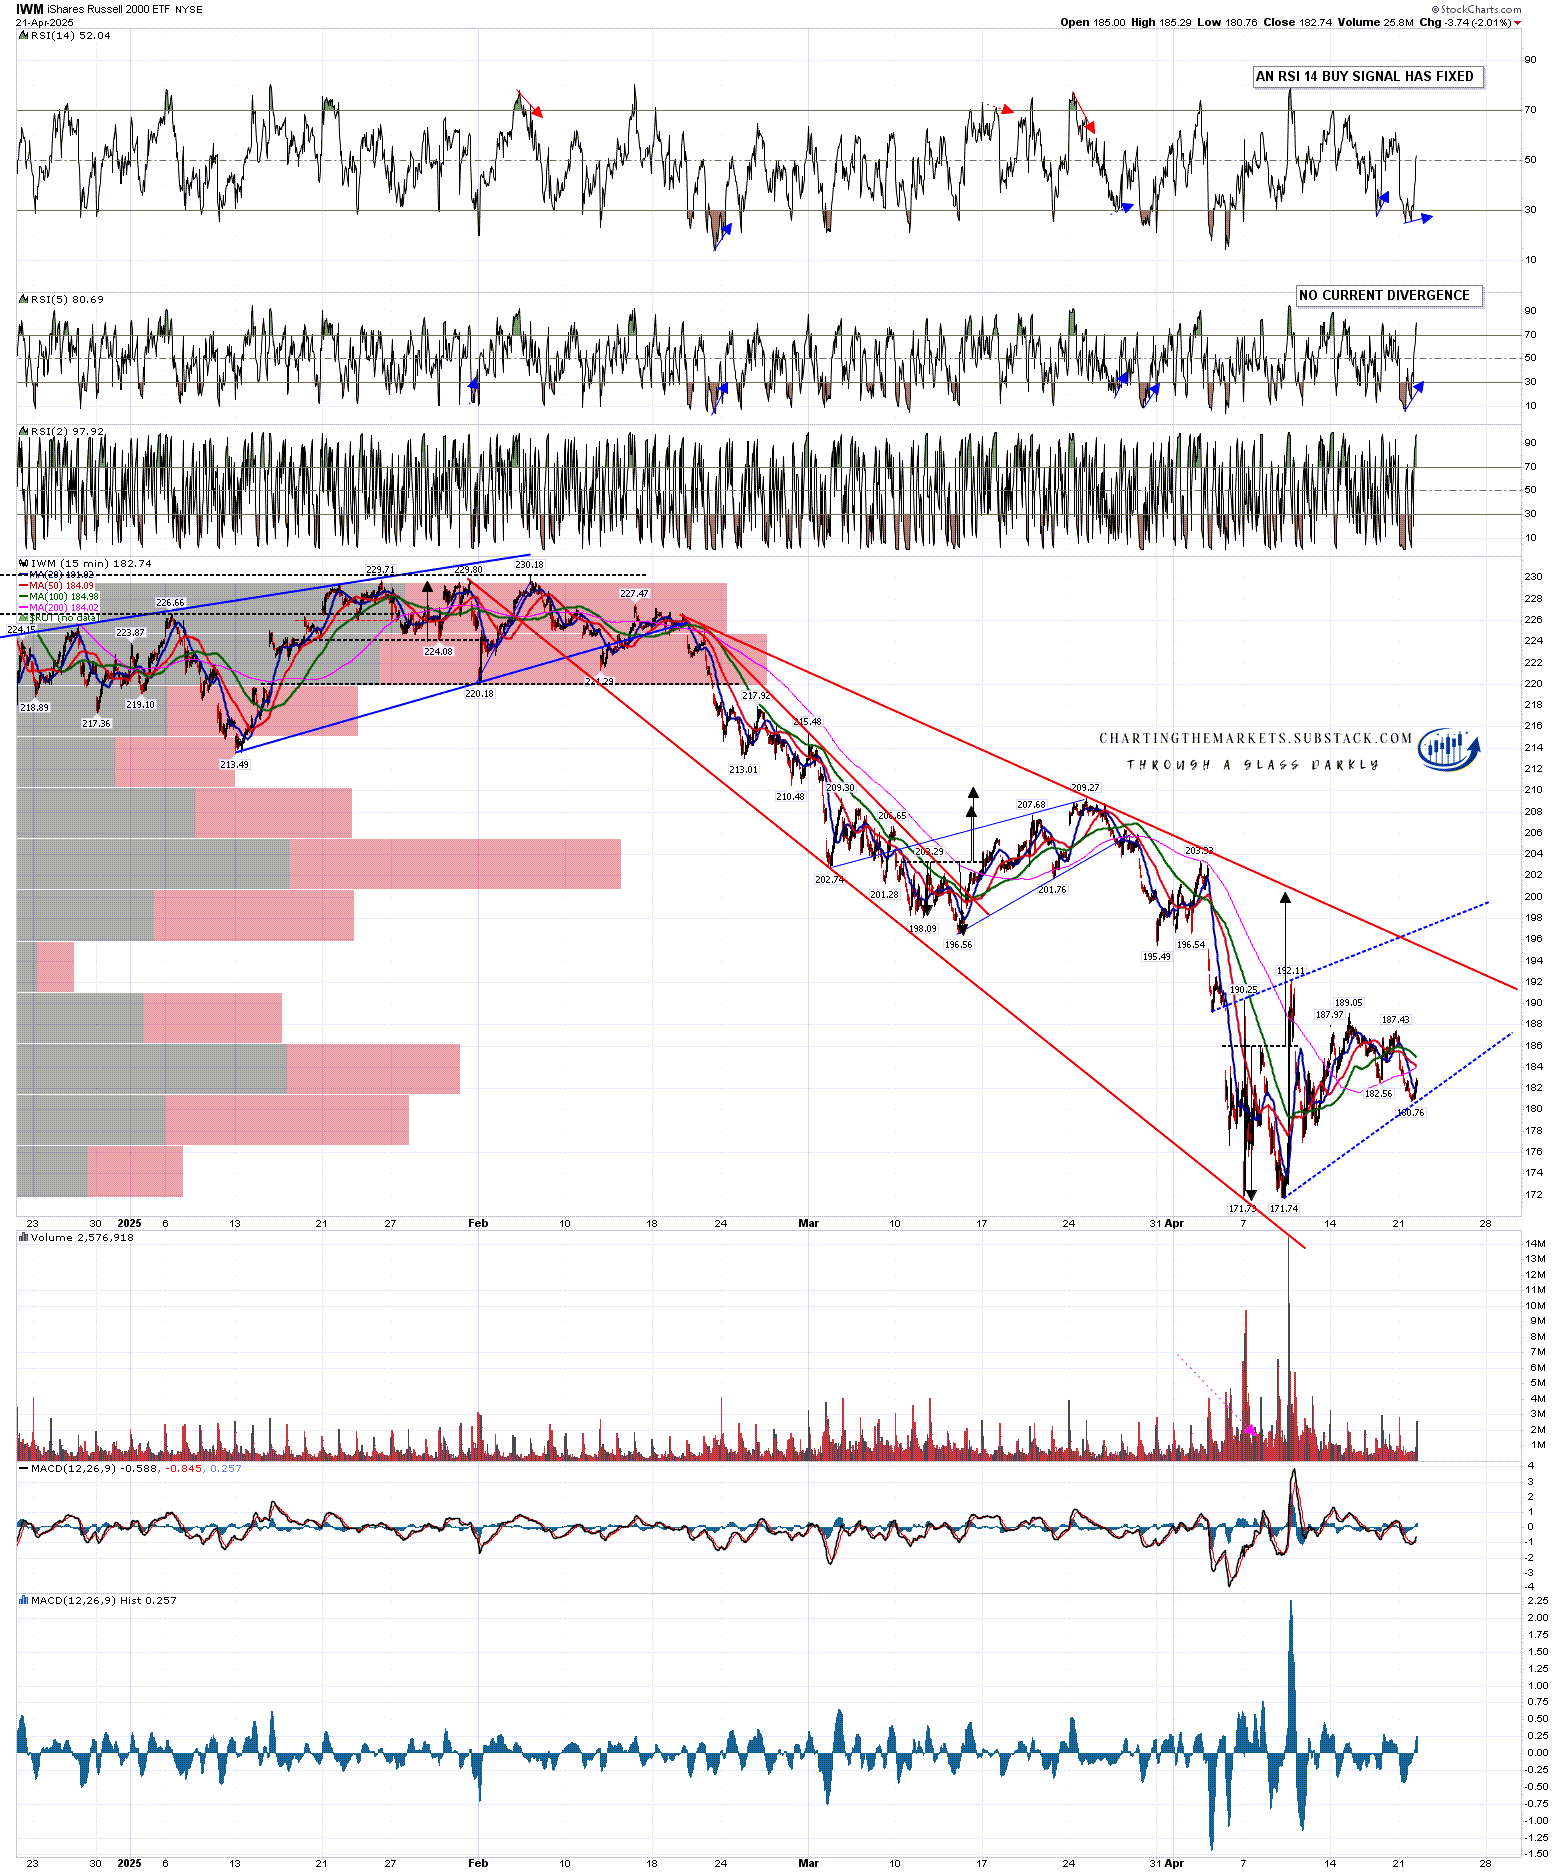
On the IWM chart the current low could make a very decent support trendline and, if we see a next leg up start towards a new rally high, the ideal target would be the resistance trendline currently in the 197 area. Possible resistance on the way at declining resistance from the high, currently in the 196 area. A 15min RSI 14 buy signal has fixed.
IWM 15min chart:
On the bigger picture the possible H&S right shoulders I was projecting two weeks ago might form on this rally have managed to deliver an acceptably long rally for those right shoulders. Another month or two would be better, but the H&S patterns are already decent if we see a break down directly from here.
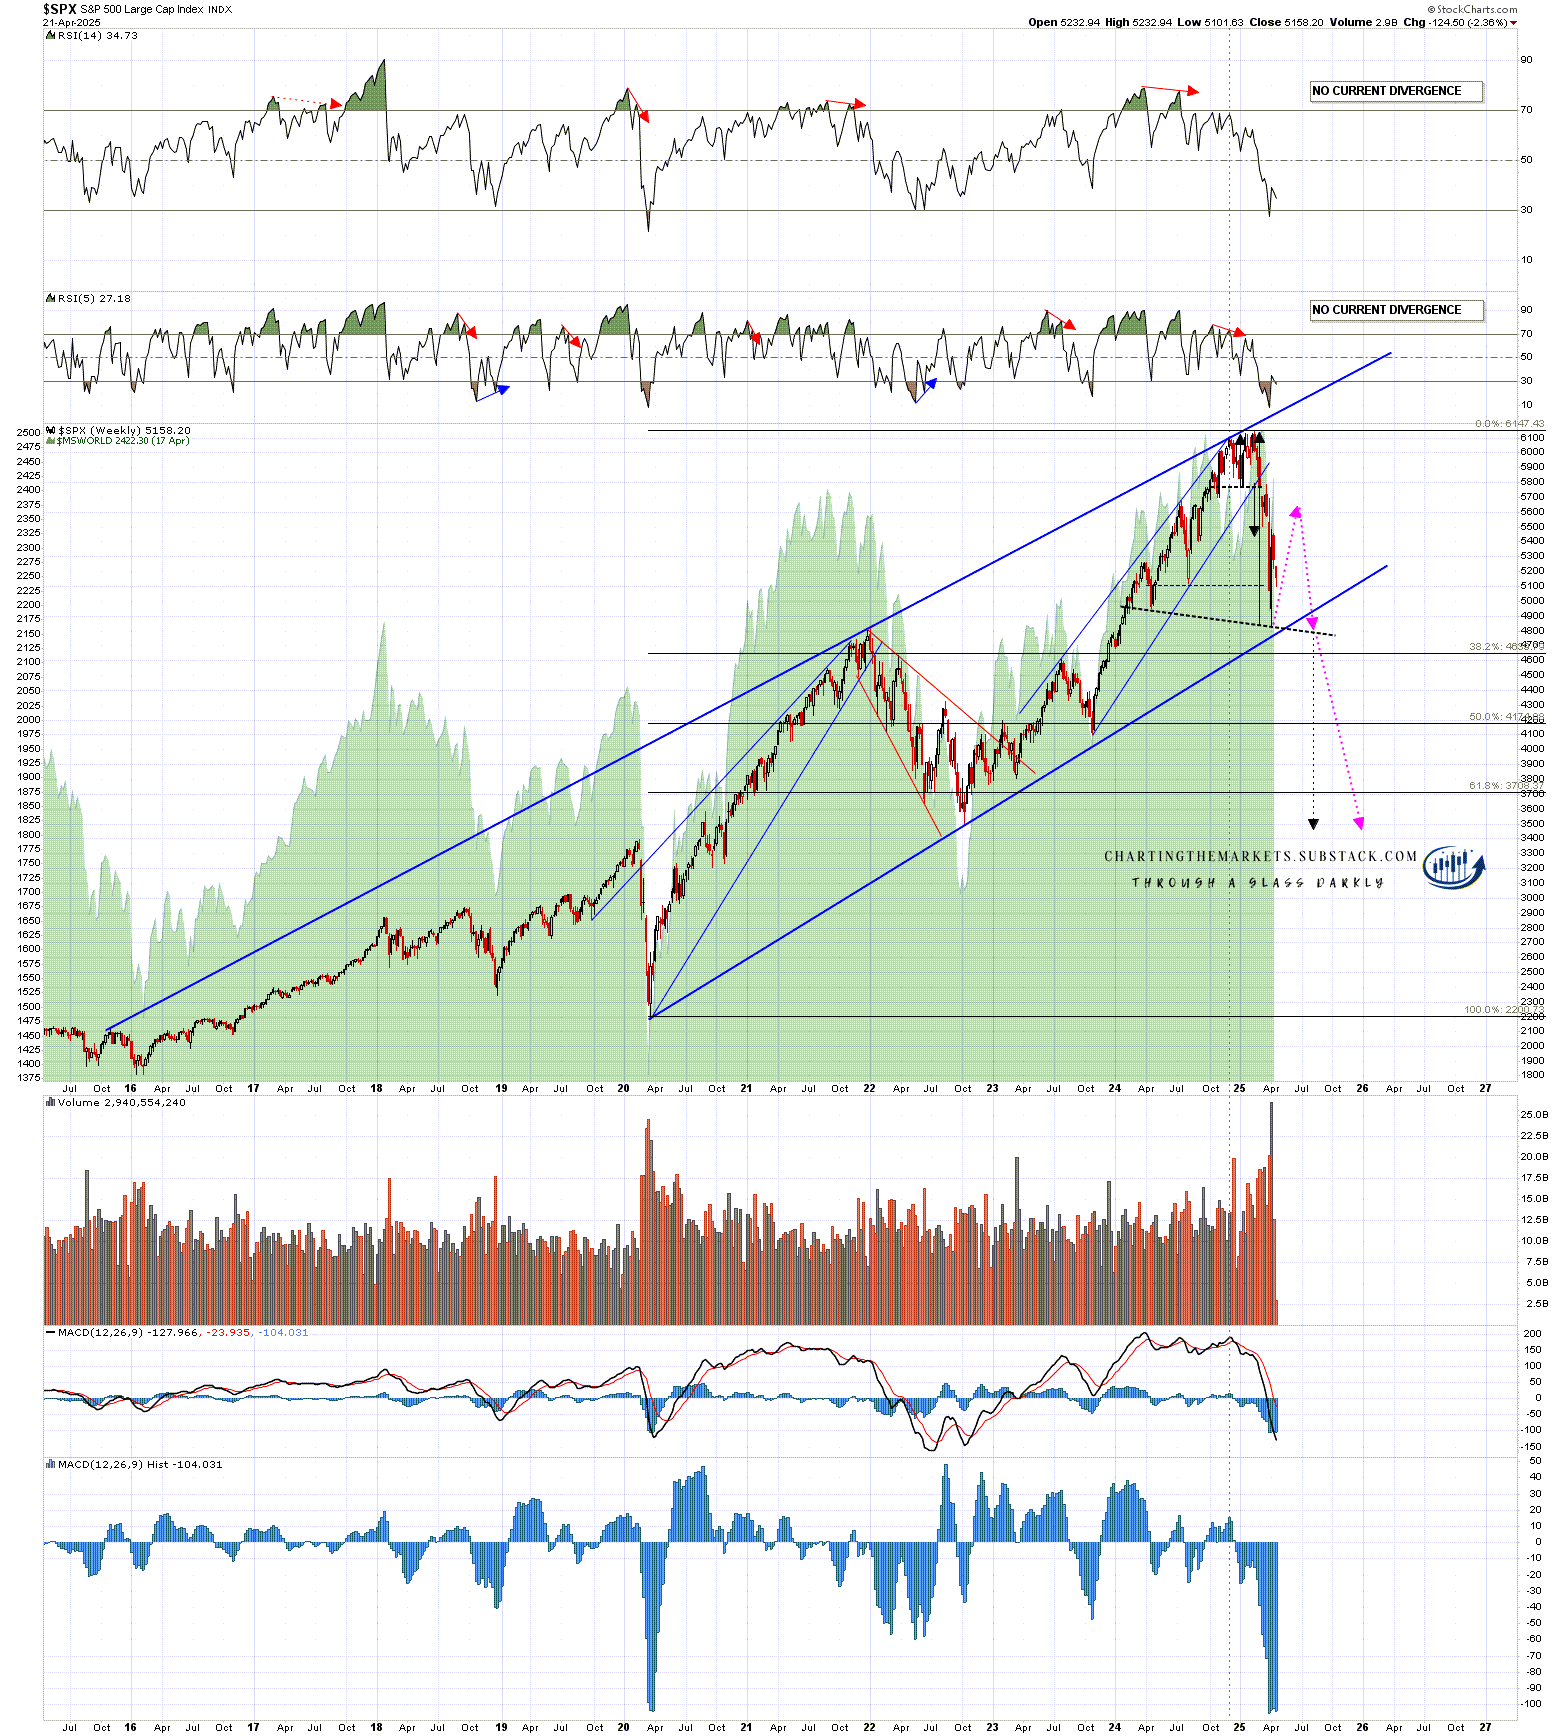
Is this very bearish projection in the chart below really possible? If we see a big crisis on bonds this year, and these trade wars continue and deepen then yes, I think it is very possible. We shall see.
SPX weekly chart - bear market projection:
Could we see US indices fail directly from here? Yes, and that would be a shame, as clear bear flag setups here would give us some clear short entries for what could well be the equity index short of the decade. I’m liking another leg up here first though, subject to newsbombs as usual this year.
I’m doing a series of (currently four) posts at the moment on my The Bigger Picture substack on the US Dollar, US Treasuries, and the reasons to be very concerned about the possible further sharp declines on both that may be coming this year. The first of these posts is looking at the potentially bearish setup on the US Dollar, the second is looking at the potentially very bearish setup on US Treasuries, the third is looking at the reasons that we may see a bond market crisis this year, and will be published this week and the fourth will be looking at why the US Dollar may lose its status as the main reserve currency for the world, what that would likely look at and what other currencies and instruments might partly replace it. Everyone trading equities in this wild year should read these.
As I have been since the start of 2025 I’m still leaning on the bigger picture towards a weak first half of 2025 and new all time highs later in the year, very possibly as a topping process for a much more significant high. One way or another I think we’ll be seeing lower soon and I’m not expecting this to be a good year for US equities, not least because both of the last two years have been banner years for US equities. A third straight year of these kinds of gains looks like a big stretch. I could of course however be mistaken. UPDATE 11th March 2025 - I am wondering if this may be a bear market that dominates the whole of 2025.
If you like my analysis and would like to see more, please take a free subscription at my chartingthemarkets substack, where I publish these posts first. I also do a premarket video every day on equity indices, bonds, currencies, energies, precious commodities and other commodities at 8.45am EST. If you’d like to see those I post the links every morning on my twitter, and the videos are posted shortly afterwards on my Youtube channel.
No comments:
Post a Comment