As I’ve been working on my post today to look at downside patterns on US equity indices I have realised that this too needs to be split into two posts, so this first TA post will just look at the historical and very compelling current setups on SPX, while the second post will also look at the current setups and targets on QQQ, DIA and IWM.
In my last post overnight, Brave New World, I was looking at the economic reasons why I think that the planned tariff war on the world due to start tomorrow may have a very serious economic impact, particularly on the US economy.
In this post I am looking at last four big bear markets / crash setups on SPX and how they played out, and looking at the setup and targets currently on SPX if we are about to see something similar play out here, as I think we well might.
My next post, entitled April Fools, which will be posted at my chartingthemarkets substack, hopefully tonight, will be looking at the setups and downside targets on QQQ, DIA and IWM in the event that we are looking at a bear market /crash scenario here.
Firstly I’d like to look at the last four big bear markets on SPX that are often referred to as crashes and dispel any idea that these occurred in a pattern vacuum or were wholly unexpected or chaotic. Personally I think that the word crash is very overused and rarely appropriate from a TA perspective in relation to equity indices on a longer term view. This is important as I am putting forward a scenario here and now on SPX that would be similar, and might also be called a crash in the future, but in truth I would just see all of these as deep bear markets, or on the bigger picture even bullish retracements, with the possibly arguable exception of the COVID crash in 2020.
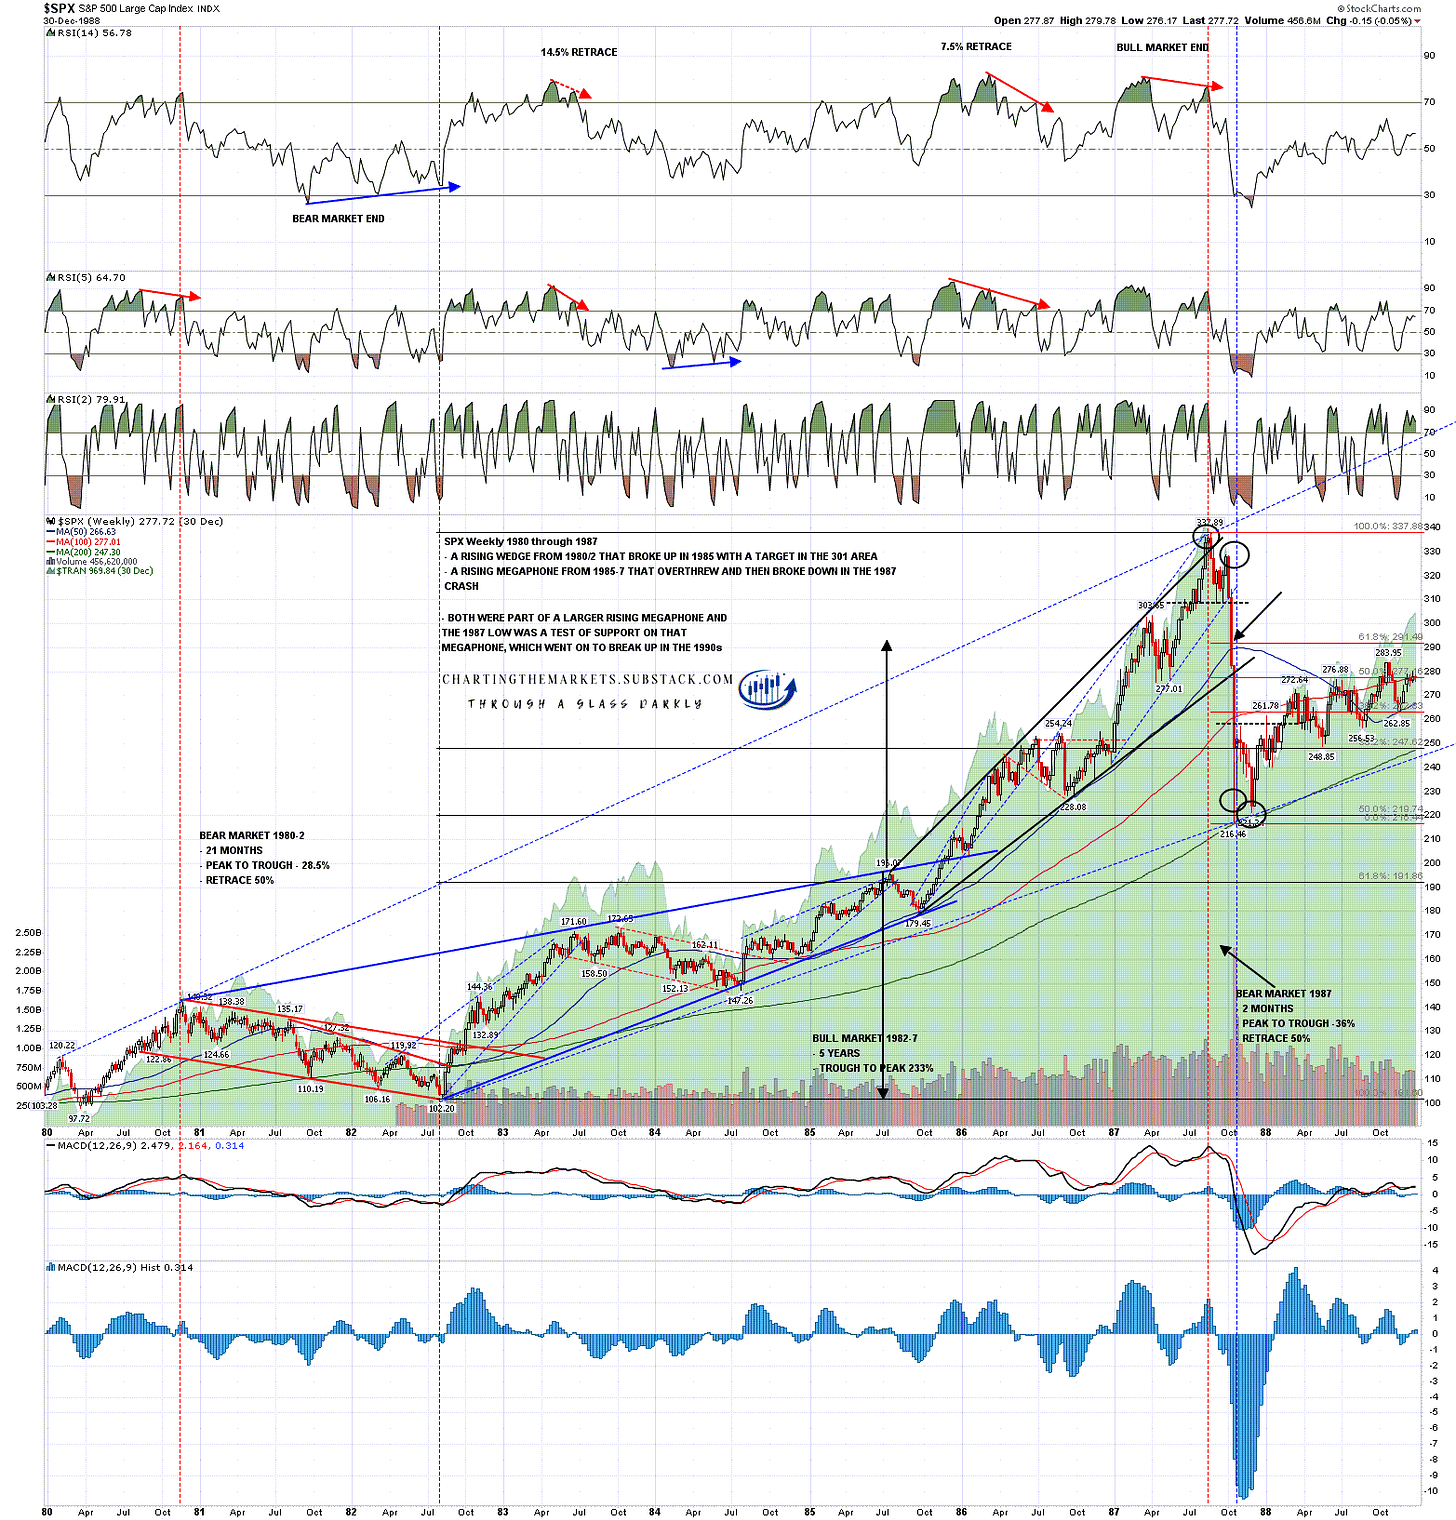
Looking at the 1987 crash, generally portrayed as unexpected and chaotic, it is clearly anything but. It was sudden and fast for sure, but there was a great pattern setup going into it and the only thing it was missing was a good topping pattern.
What it had was a lovely rising megaphone that was clearly topping out, clear negative divergence on the weekly RSI 14, and the decline was an almost perfect 50% retracement of the move up from the 1982 low to the 1987 high.
On the bigger picture this was very much just a sudden bullish 50% retracement.
SPX weekly chart - patterns 1980-7:
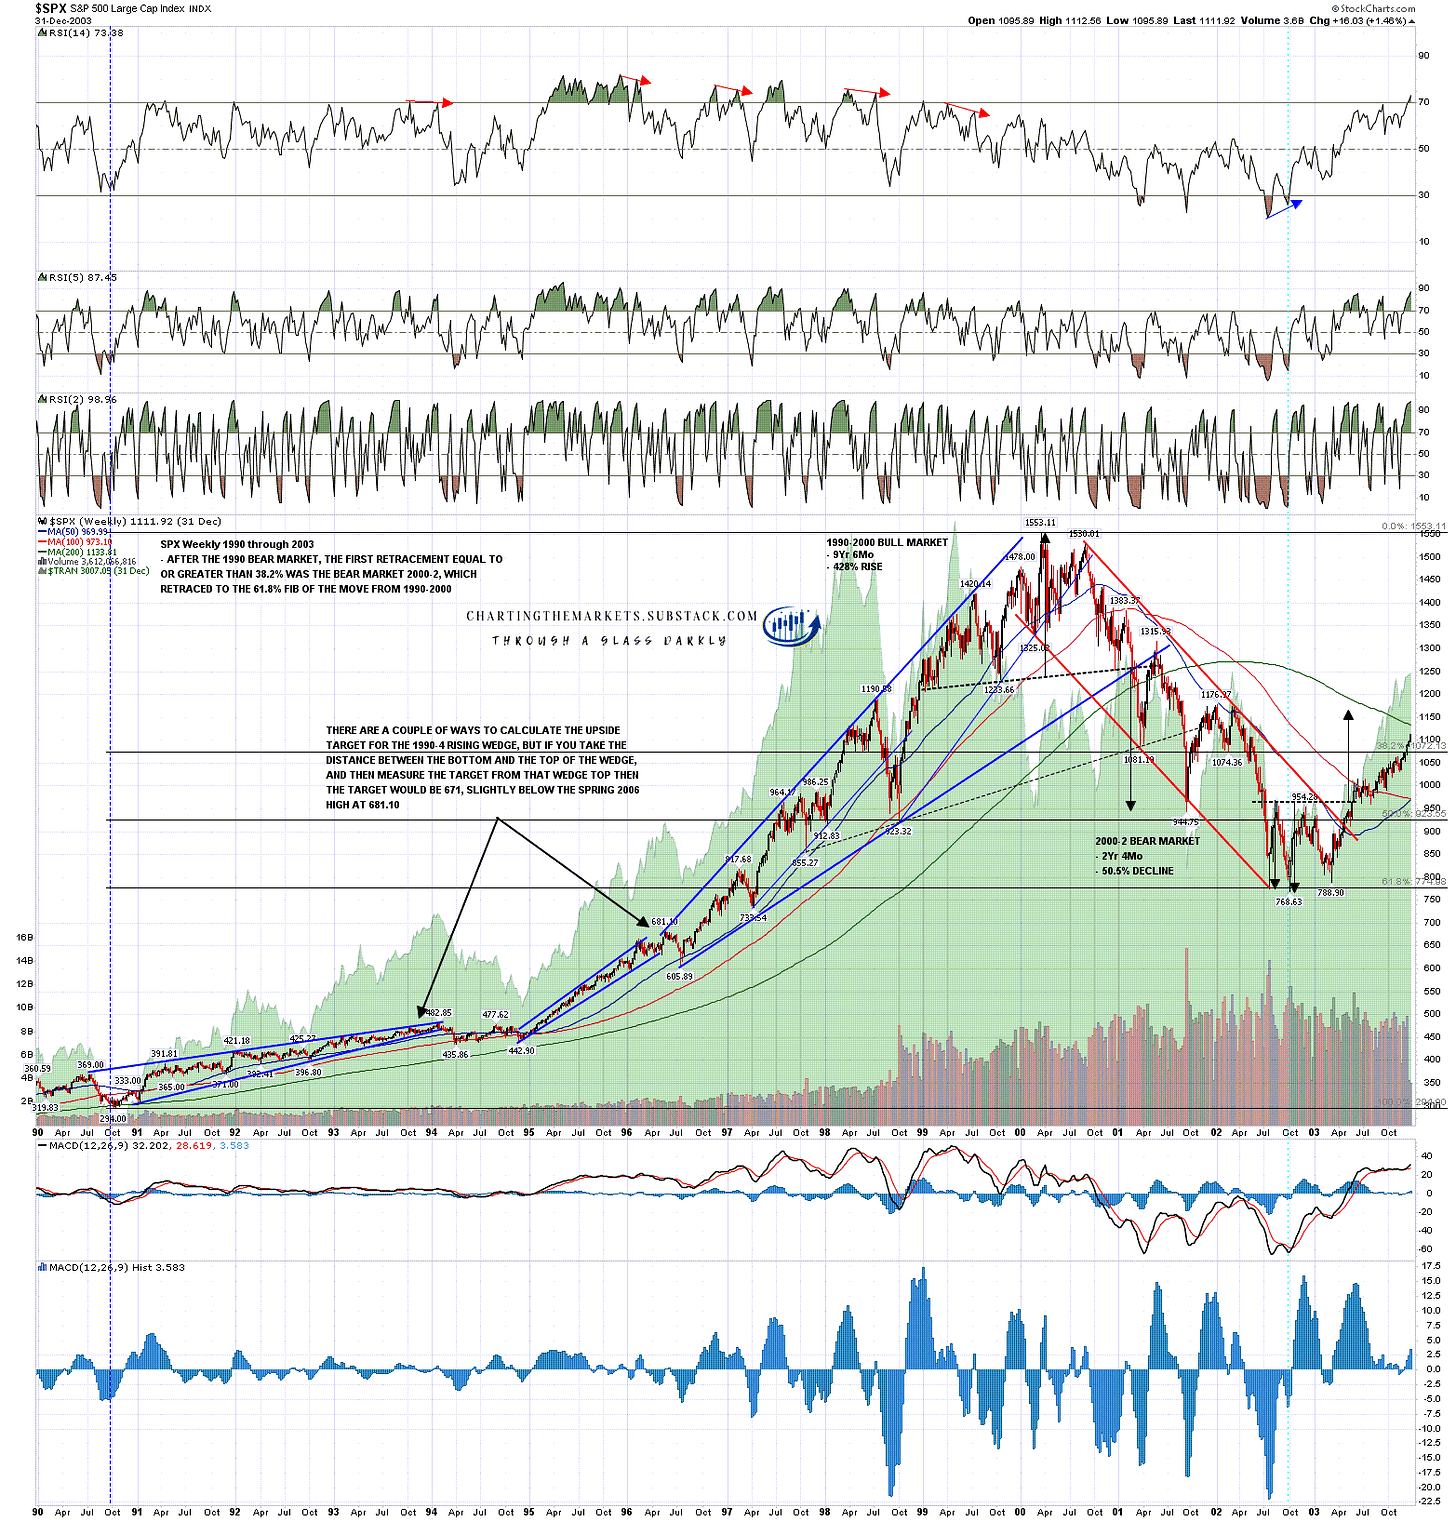
Looking at the post 2000 bear market, also generally referred to as a crash, there was a nice rising megaphone leading into it, a high quality H&S that formed and reached target, clear negative divergence on the weekly RSI 14, and the decline was an almost perfect 61.8% retracement of the move up from the 1990 low to 1987 high while forming a high quality falling channel. Really nothing chaotic on this chart at all.
I don’t have room today to show the weekly log chart showing the lovely secular bull market channel 1982-2000 but it was also a very nice high on that chart too.
SPX weekly chart - patterns 1990-2003:
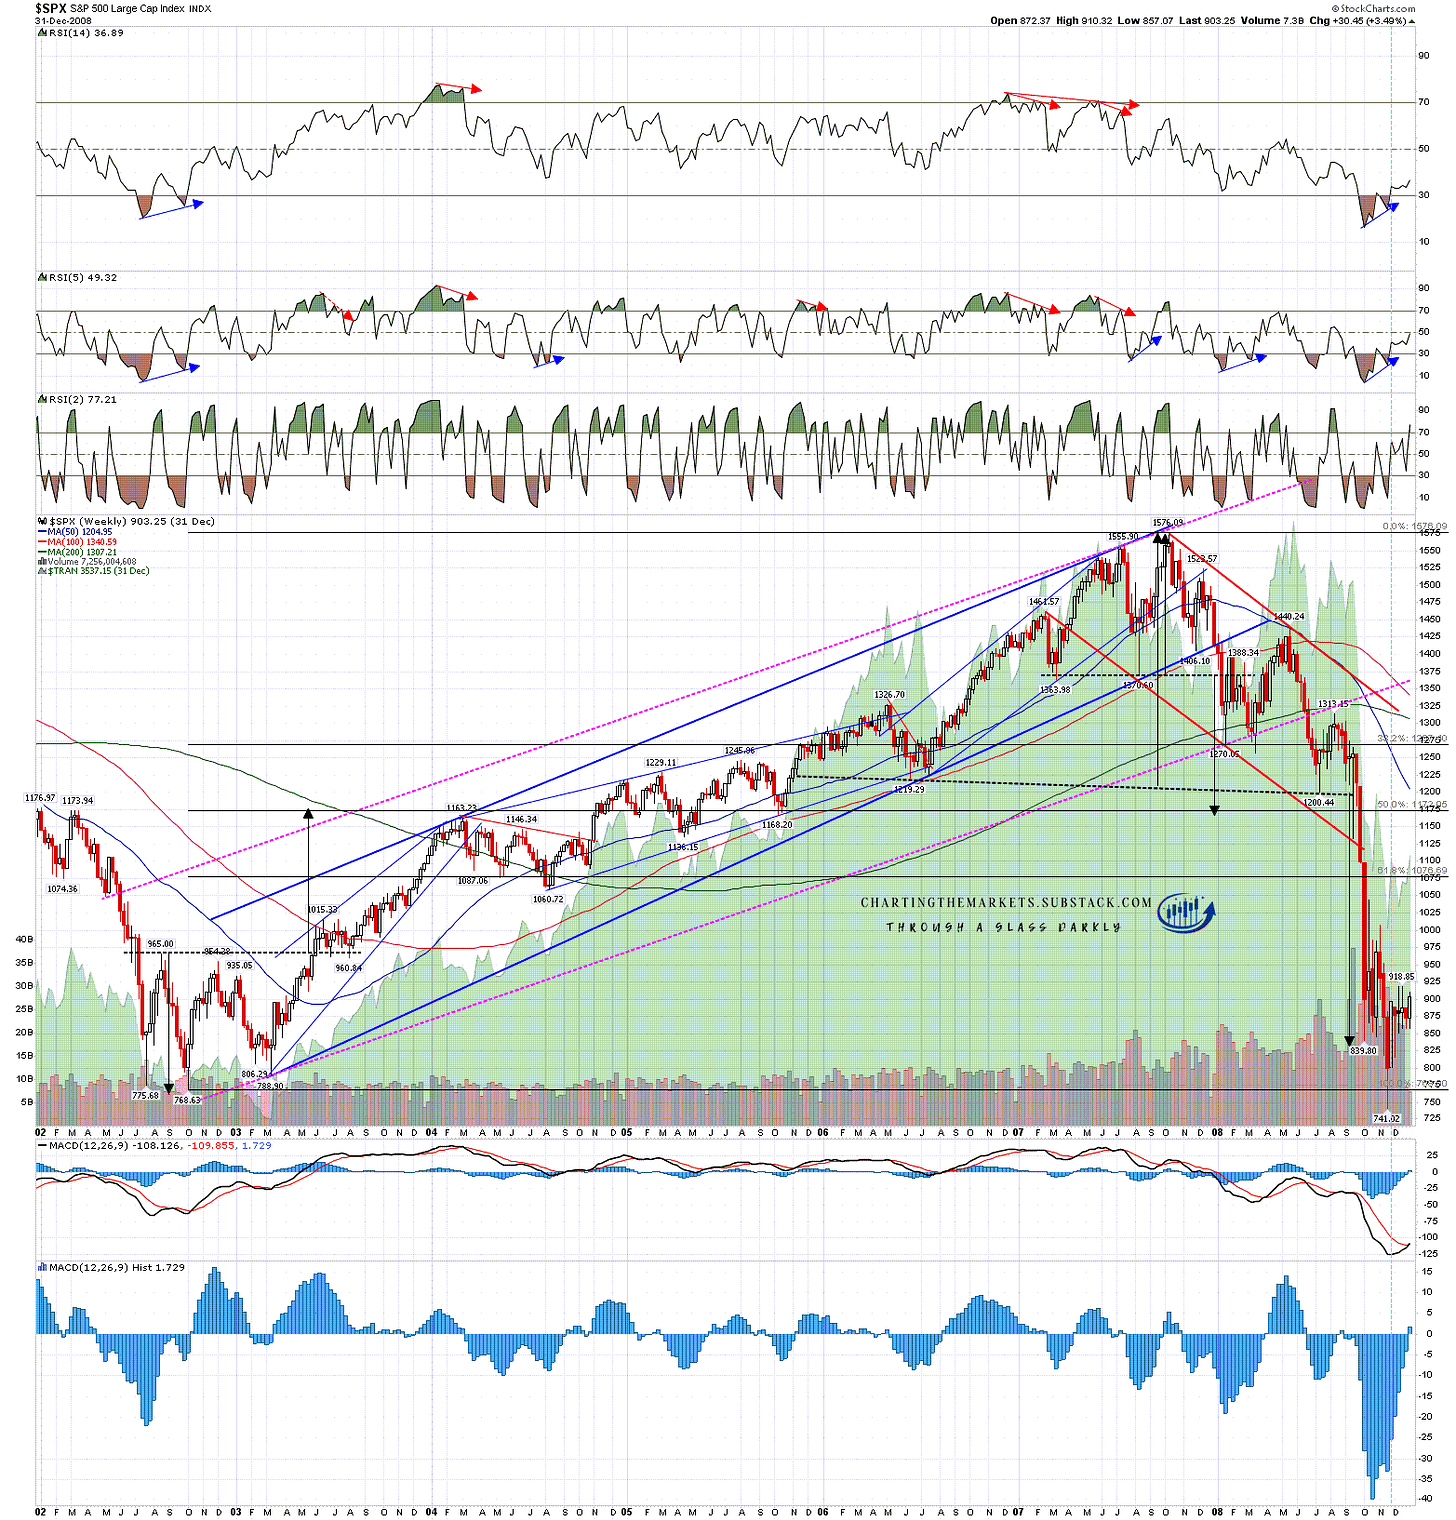
The whole period 1997-2011 was in retrospect a range trade with the bottom of the range in the 750 area and the top of the range in the 1550 area, and the pattern from the 2002 low to 2007 high was a rising wedge that was then entirely retraced into the last test of the range low.
Again there was a very clear rising wedge that topped out in 2007 with an initial double top with a target in the 1170 area, then a larger H&S with a target in the 835 area, a falling channel from the 2007 high that failed lower hard, clear negative divergence on the weekly RSI 14, and the decline was an almost perfect full retracement of the move up from the 2002 low to 2007 high. Really nothing chaotic on this chart at all either.
SPX weekly chart - patterns 2002-9:
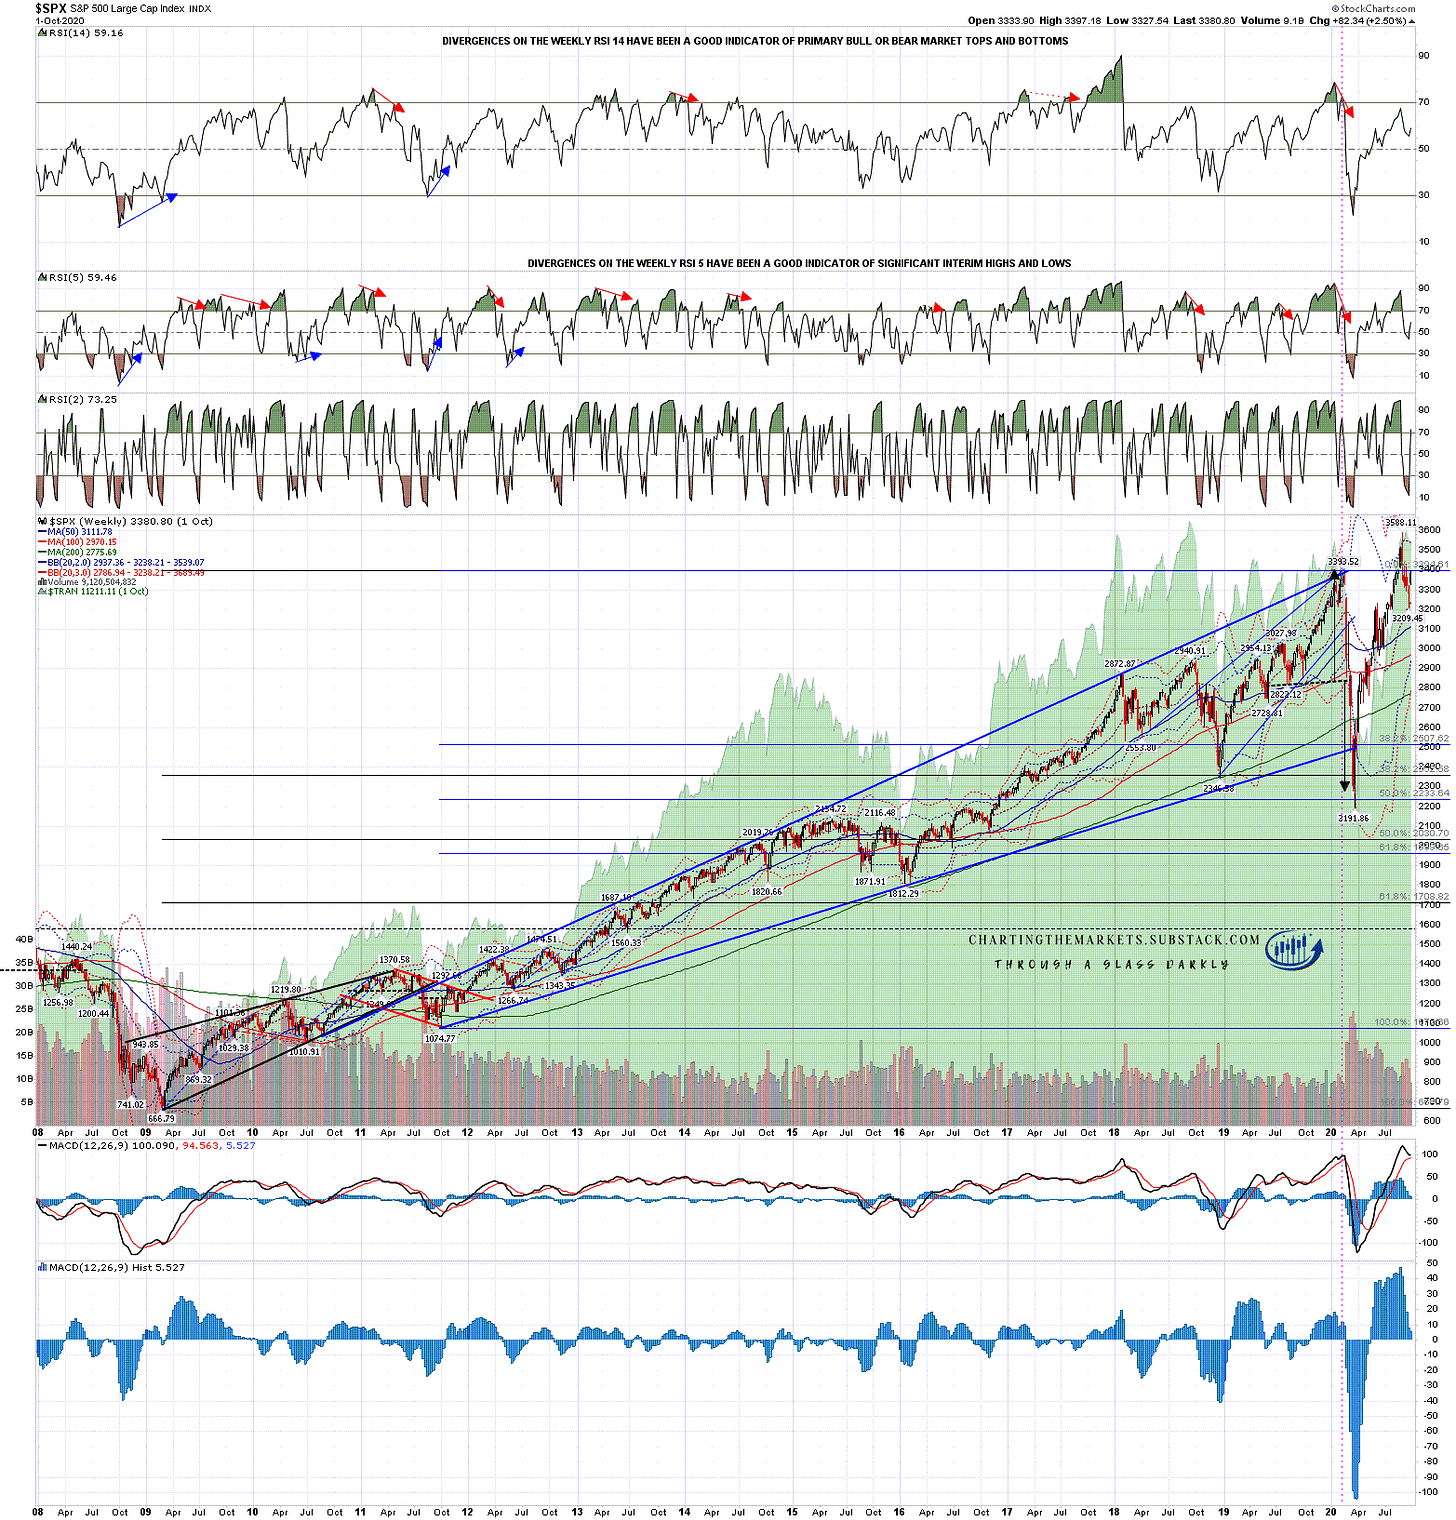
Even in the case of the COVID crash in 2020 the pattern setup was clearly strongly suggesting at least a significant high in the rising megaphone from the 2011 bear market low, clear negative divergence on the weekly RSI 14, and even though the decline was really fast, there was a rally to set up the right shoulder on a decent quality H&S that then played out to target in the 2280 area. The decline was close to the 50% retracement of the rising megaphone. It was very sudden and fast but, as all these four were, also very technical in the way it delivered and where it ended.
SPX weekly chart: - patterns 2008-20:
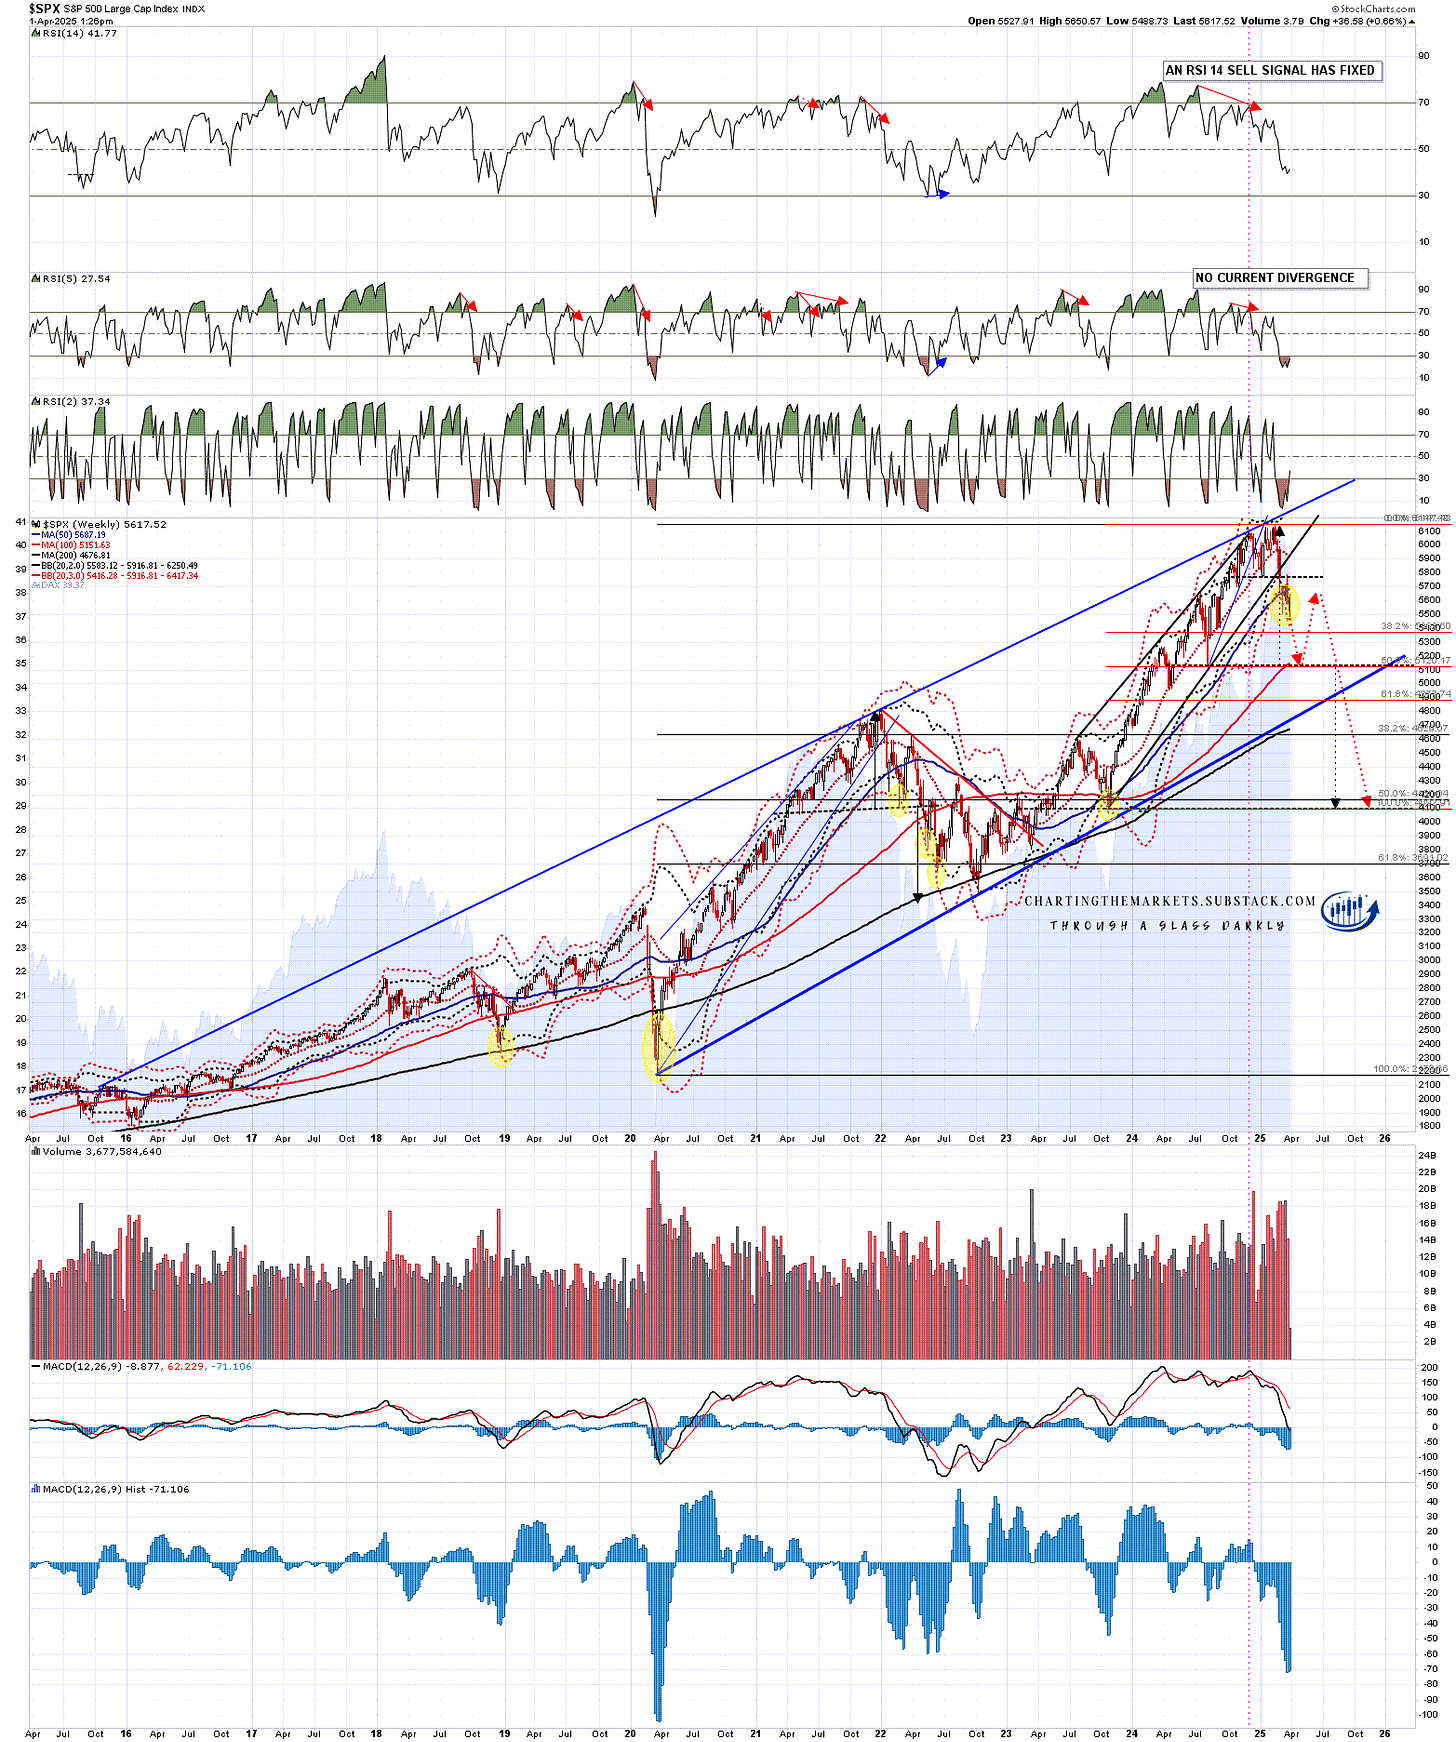
So what about now? I mentioned 5100 as an area I’m watching in a post last week that is an important waystation on the path I have in mind for a serious bear market here. As ever these projections don’t have to play out, but this one is a peach.
Obviously, as with the previous four, we have clear negative divergence on the RSI 14. A small double top has broken down from the highs and on this scenario SPX is on the way down to the possible H&S neckline in the 5100 area near the 50% retracement of the rising wedge from the Oct 2023 low. Ideally there would then be a right shoulder rally into the 5650 area, followed by a break down with a target in the 4100 area, at the full retracement of the rising wedge from the October 2023 low, and the 50% retracement of the move up from the 2020 low.
Is this projection just too mathematically elegant to play out? I guess we’ll see, but I really like it. The current US administration in my view is working very hard to make this scenario happen so I think it has a decent shot.
SPX weekly chart - 2015-date with bear market projections from here:
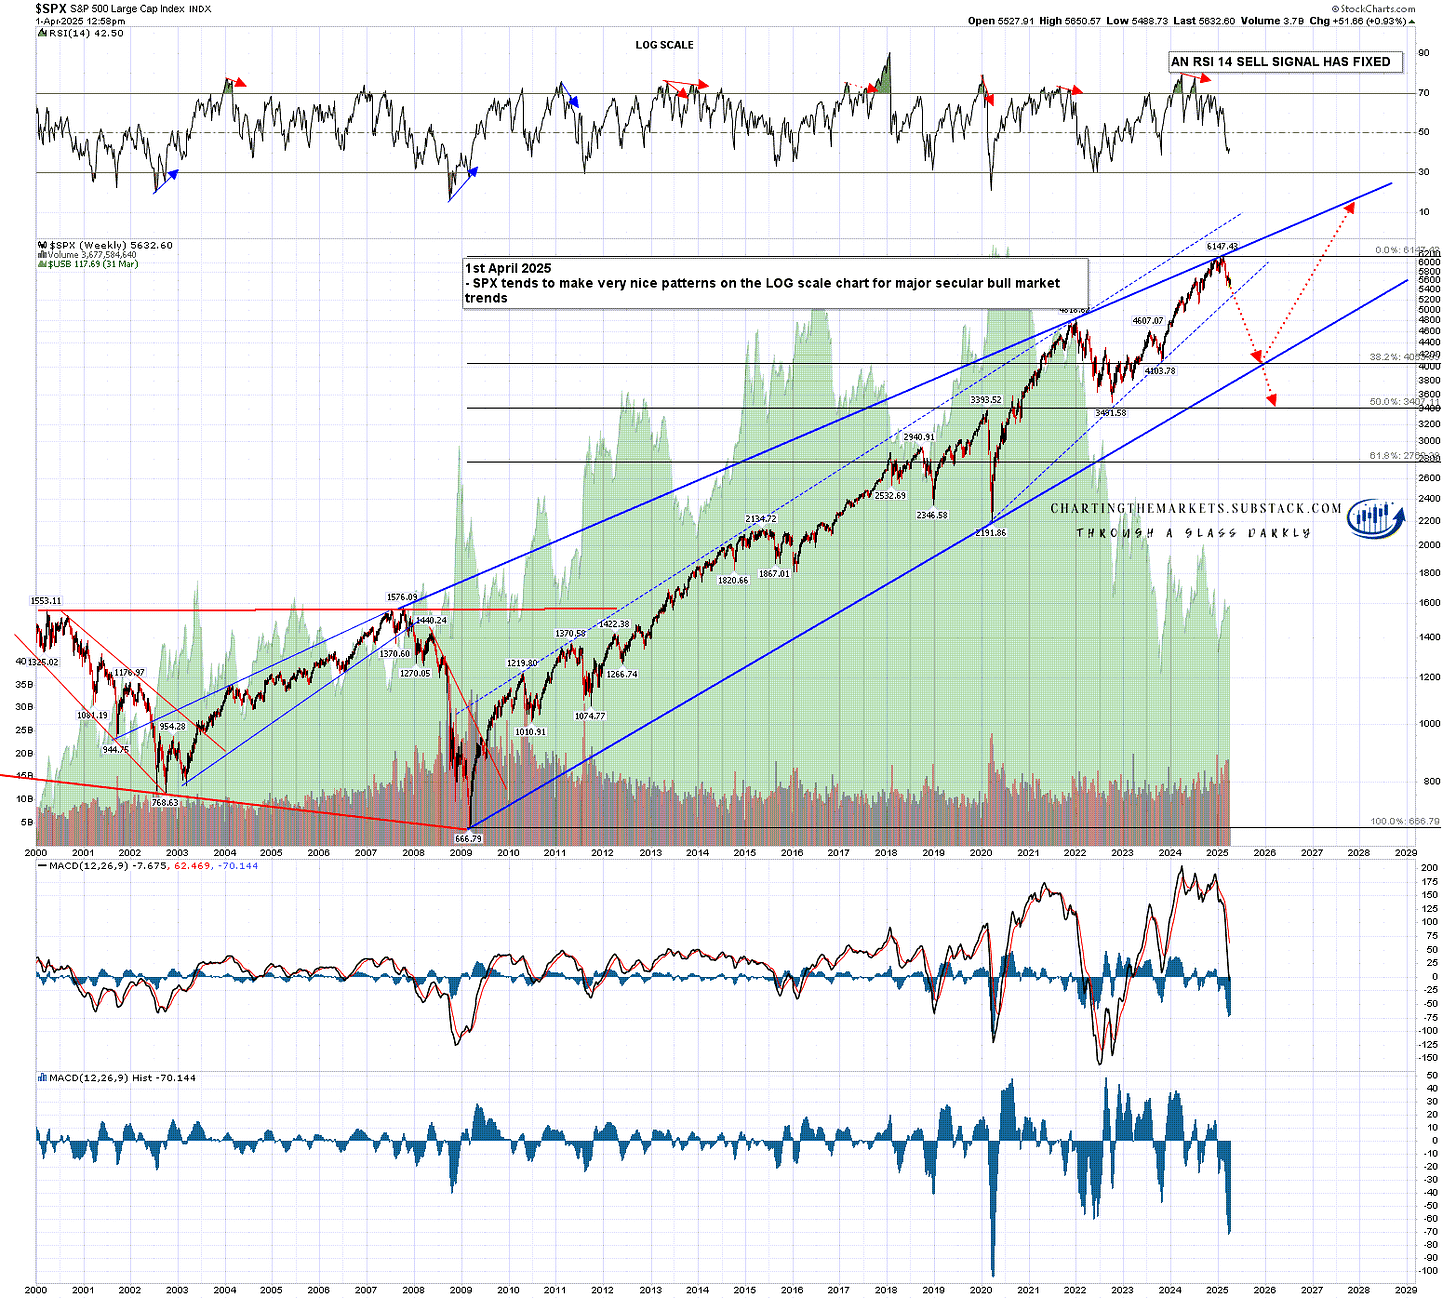
The elegance of this scenario doesn’t end with that chart though. Secular bull markets on SPX also tend to develop high quality patterns on the log scale charts, and I have a lovely rising wedge here from the 2009 low.
On this secular bull market chart the next obvious target would also be in the 4100 area towards the end of 2025 at rising wedge support, and that would further be a 38.2% retracement of the move up from the 2009 low.
If there was a further decline from 4100 then I have marked in a possible lower target in the 3400 area, at the 50% retracement of the move the 2009 low and the very strong support/resistance area at the 2020 high at 3393, and the 2022 (technical bear market) bullish breakout backtest at 3401.
Either of these two targets would be a model of technical perfection and you most definitely read it here first :-). Would a move to either of these targets constitute a crash either in my view? No.
SPX weekly (LOG) chart - 2000-25 secular bull market pattern:
If you like my analysis and would like to see more, please take a free subscription at my thebiggerpicture substack, where I publish these posts first and do bi-weekly videos looking at equity indices, bonds, currencies and commodities. If you’d like to see those I post the links on Wednesday and Sunday evenings on my twitter, and the videos are posted on my Youtube channel. The follow up post to this post looking at possible downside targets this year on QQQ, DIA and IWM if we see serious market disruption will be posted at my chartingthemarkets substack.

No comments:
Post a Comment