
In my posts last week on Wednesday and Friday I was looking at possible rally options from the current 2025 lows, and was looking for a rally lasting at minimum a week or two to make right shoulders on the possible H&S patterns that may be forming on SPX, QQQ and DIA here. That is proceeding slowly but I was thinking then that at minimum this rally would ideally last a week or two, and I think the odds of that look decent. The rally will be a week old tomorrow lunchtime, this is a holiday week and while there has been much talk of further tariffs coming soon, these have not yet been implemented.
I did say as well last week though that this tariff reprieve was partial, temporary and fragile, and that remains the case. If the new tariffs being trailed by the administration on electronics, semiconductors and pharmaceuticals start hitting next week then this rally may be over and a new leg down may begin.
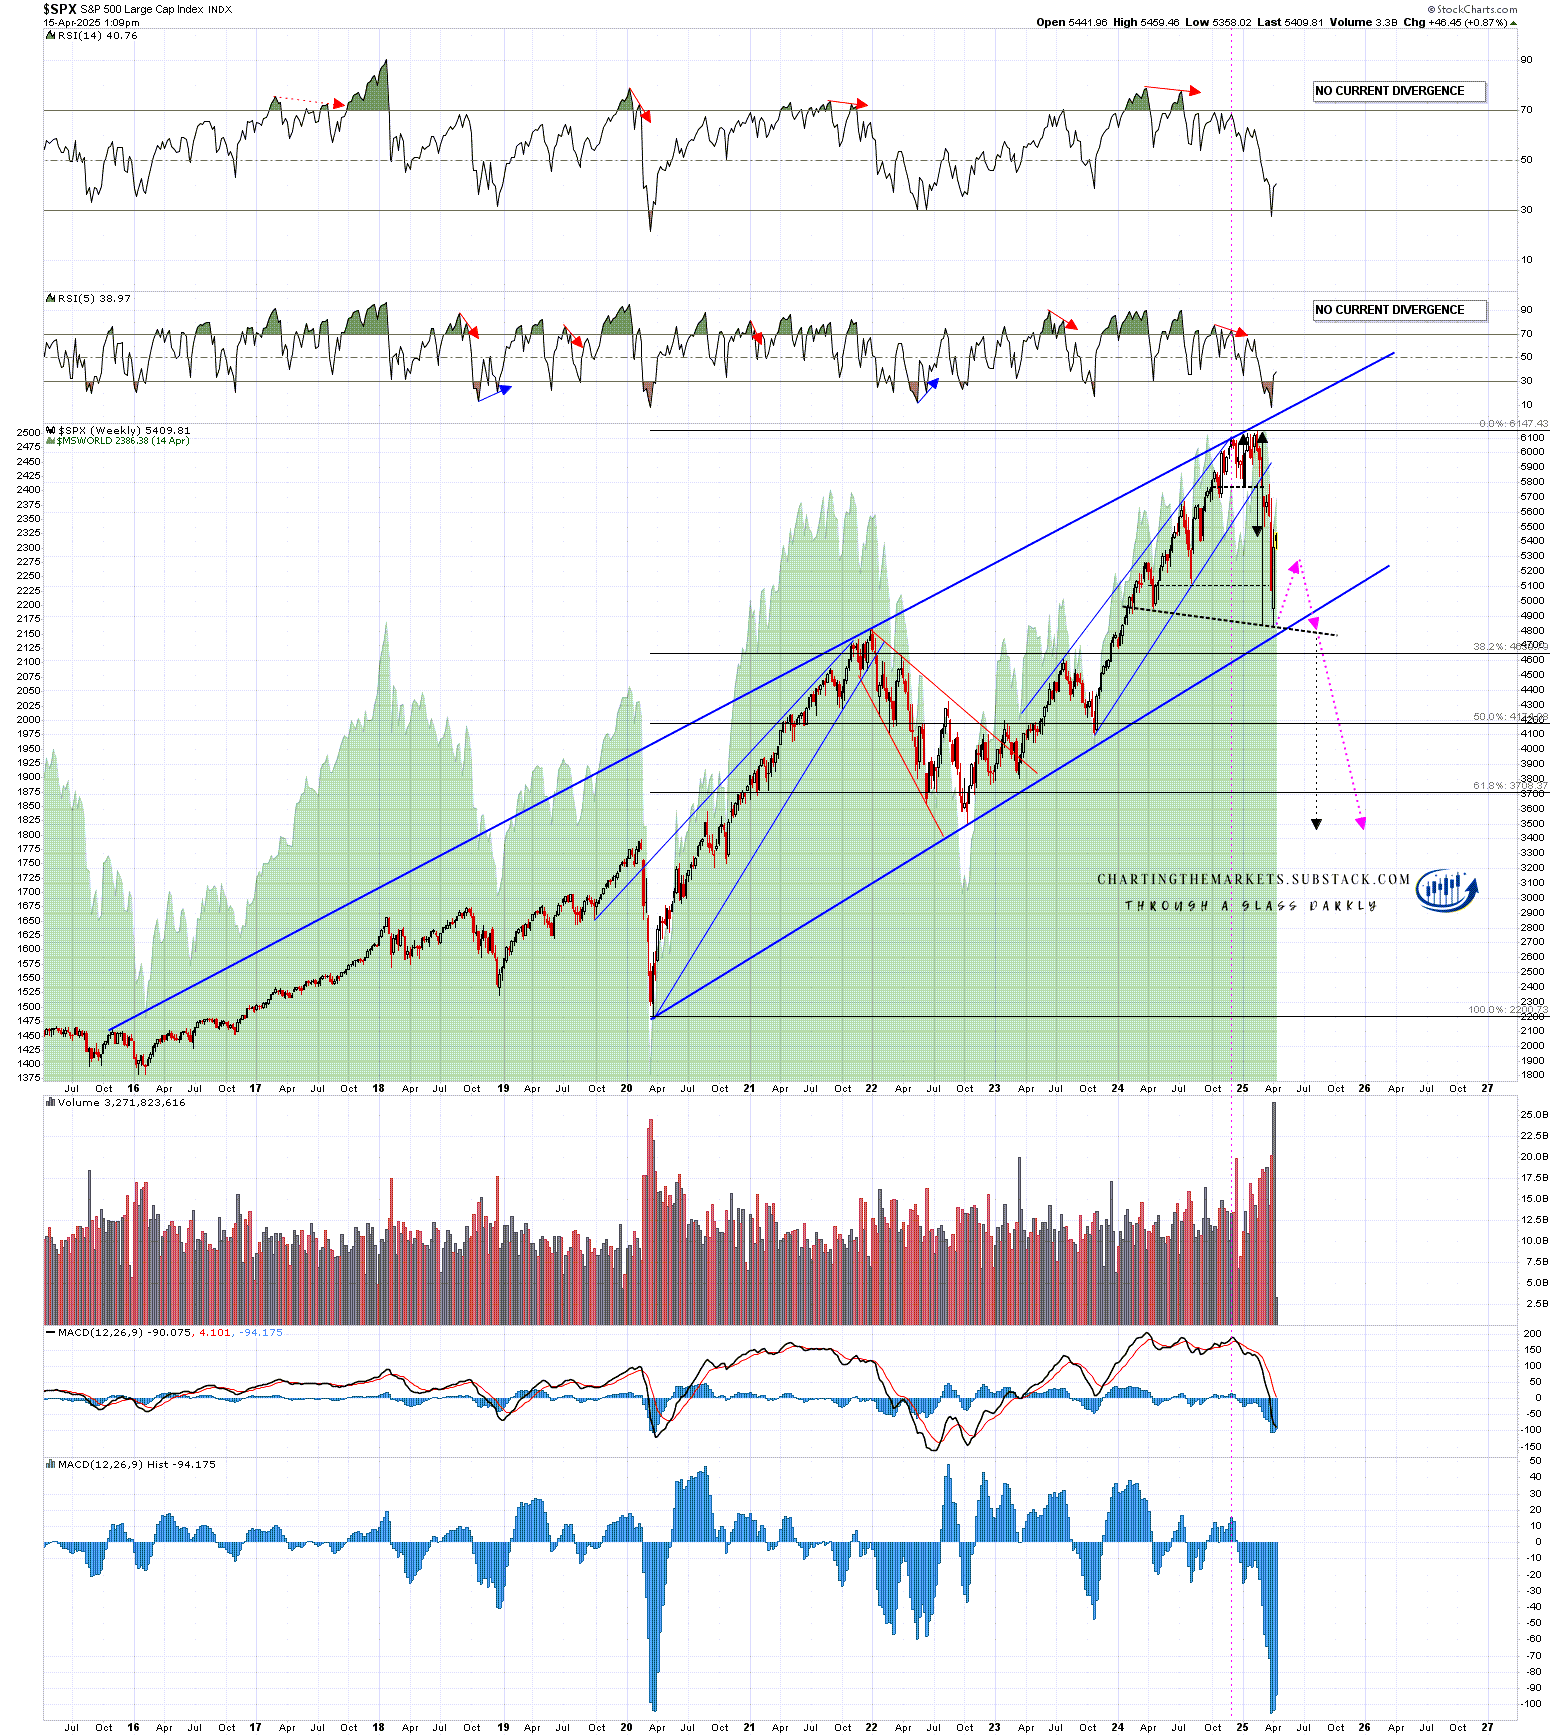
So where does that leave the possible bear market projection I was looking at last week? Not bad though a rally lasting a few more weeks would be better. If the rally can last into the end of Thursday without making a lower low then there would be a two green weekly candle right shoulder which would be acceptable.
SPX weekly chart - bear market projections:
Looking at the shorter term charts there is not much to work with in terms of short term patterns. If the rally is going to fail soon then I’d expect to see the rally make higher highs over Thursday’s high, which DIA has managed but still well short on SPX and QQQ.
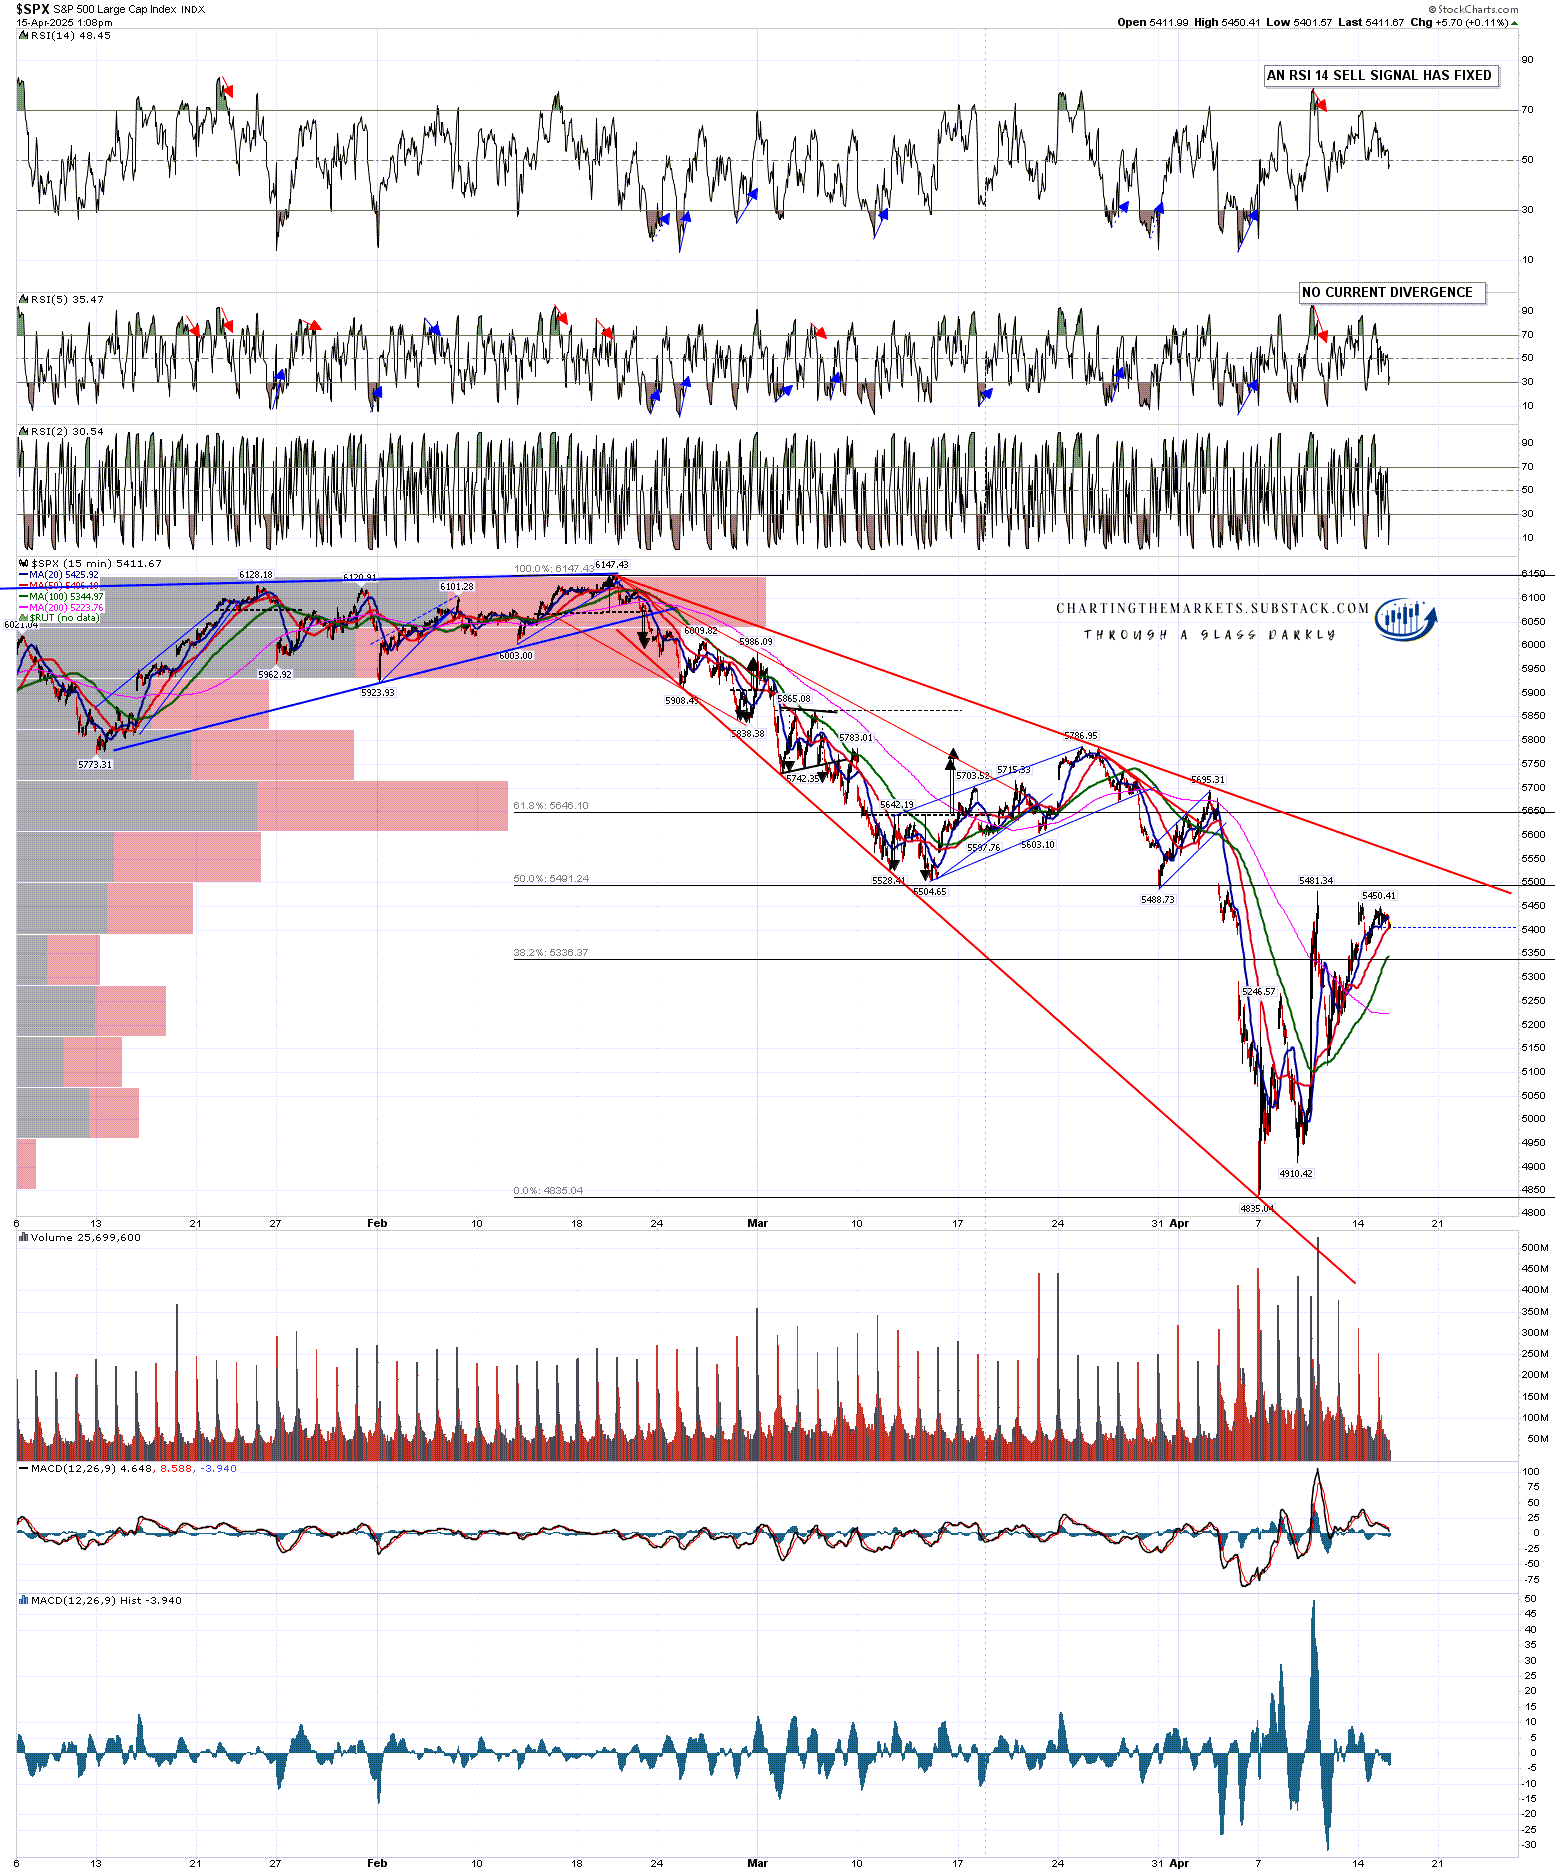
I would note though that if a decent bull flag support trendline was to form then ideally all three of these indices would first need to either retest the lows or just retrace more of the initial move up on Wednesday last week. We might not see that, but 15min RSI 14 sell signals fixed all on three indices on Thursday and none of those has yet made target.
In terms of patterns from the highs I have decent quality though unsustainably steep falling megaphones from the high in February, and on SPX I am watching the 50% retracement level at 5491 and declining resistance from the high currently in the 5575 area. If this is just going to be a short rally then a test and fail at declining resistance would be an obvious level to turn back down.
SPX 15min chart:
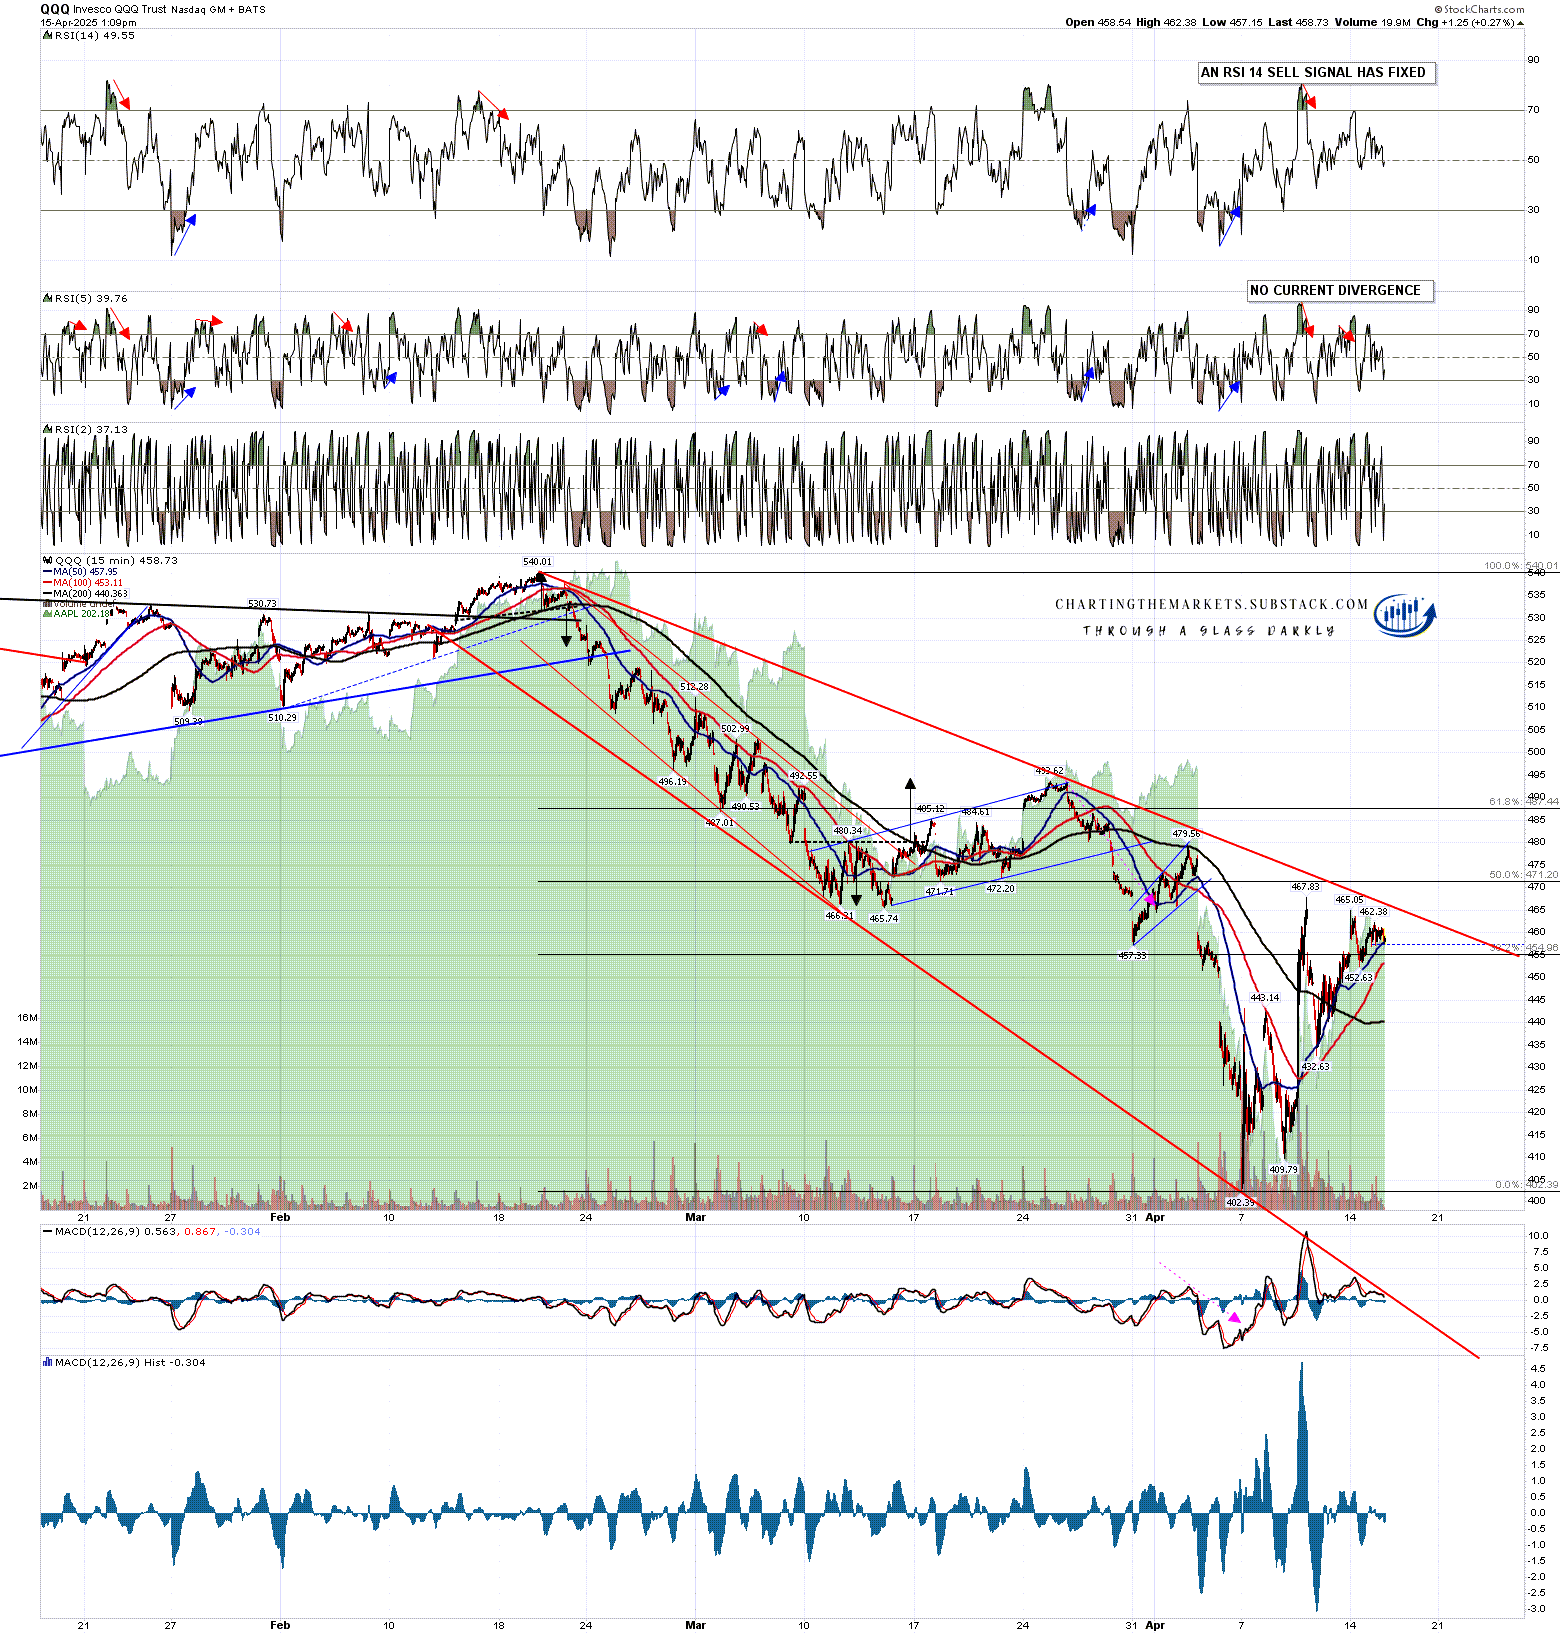
On QQQ I am watching declining resistance from the high currently in the 466 area and the 50% retracement level at 471.20. If this is just going to be a short rally then a test and fail at either would be an obvious level to turn back down.
QQQ 15min chart:
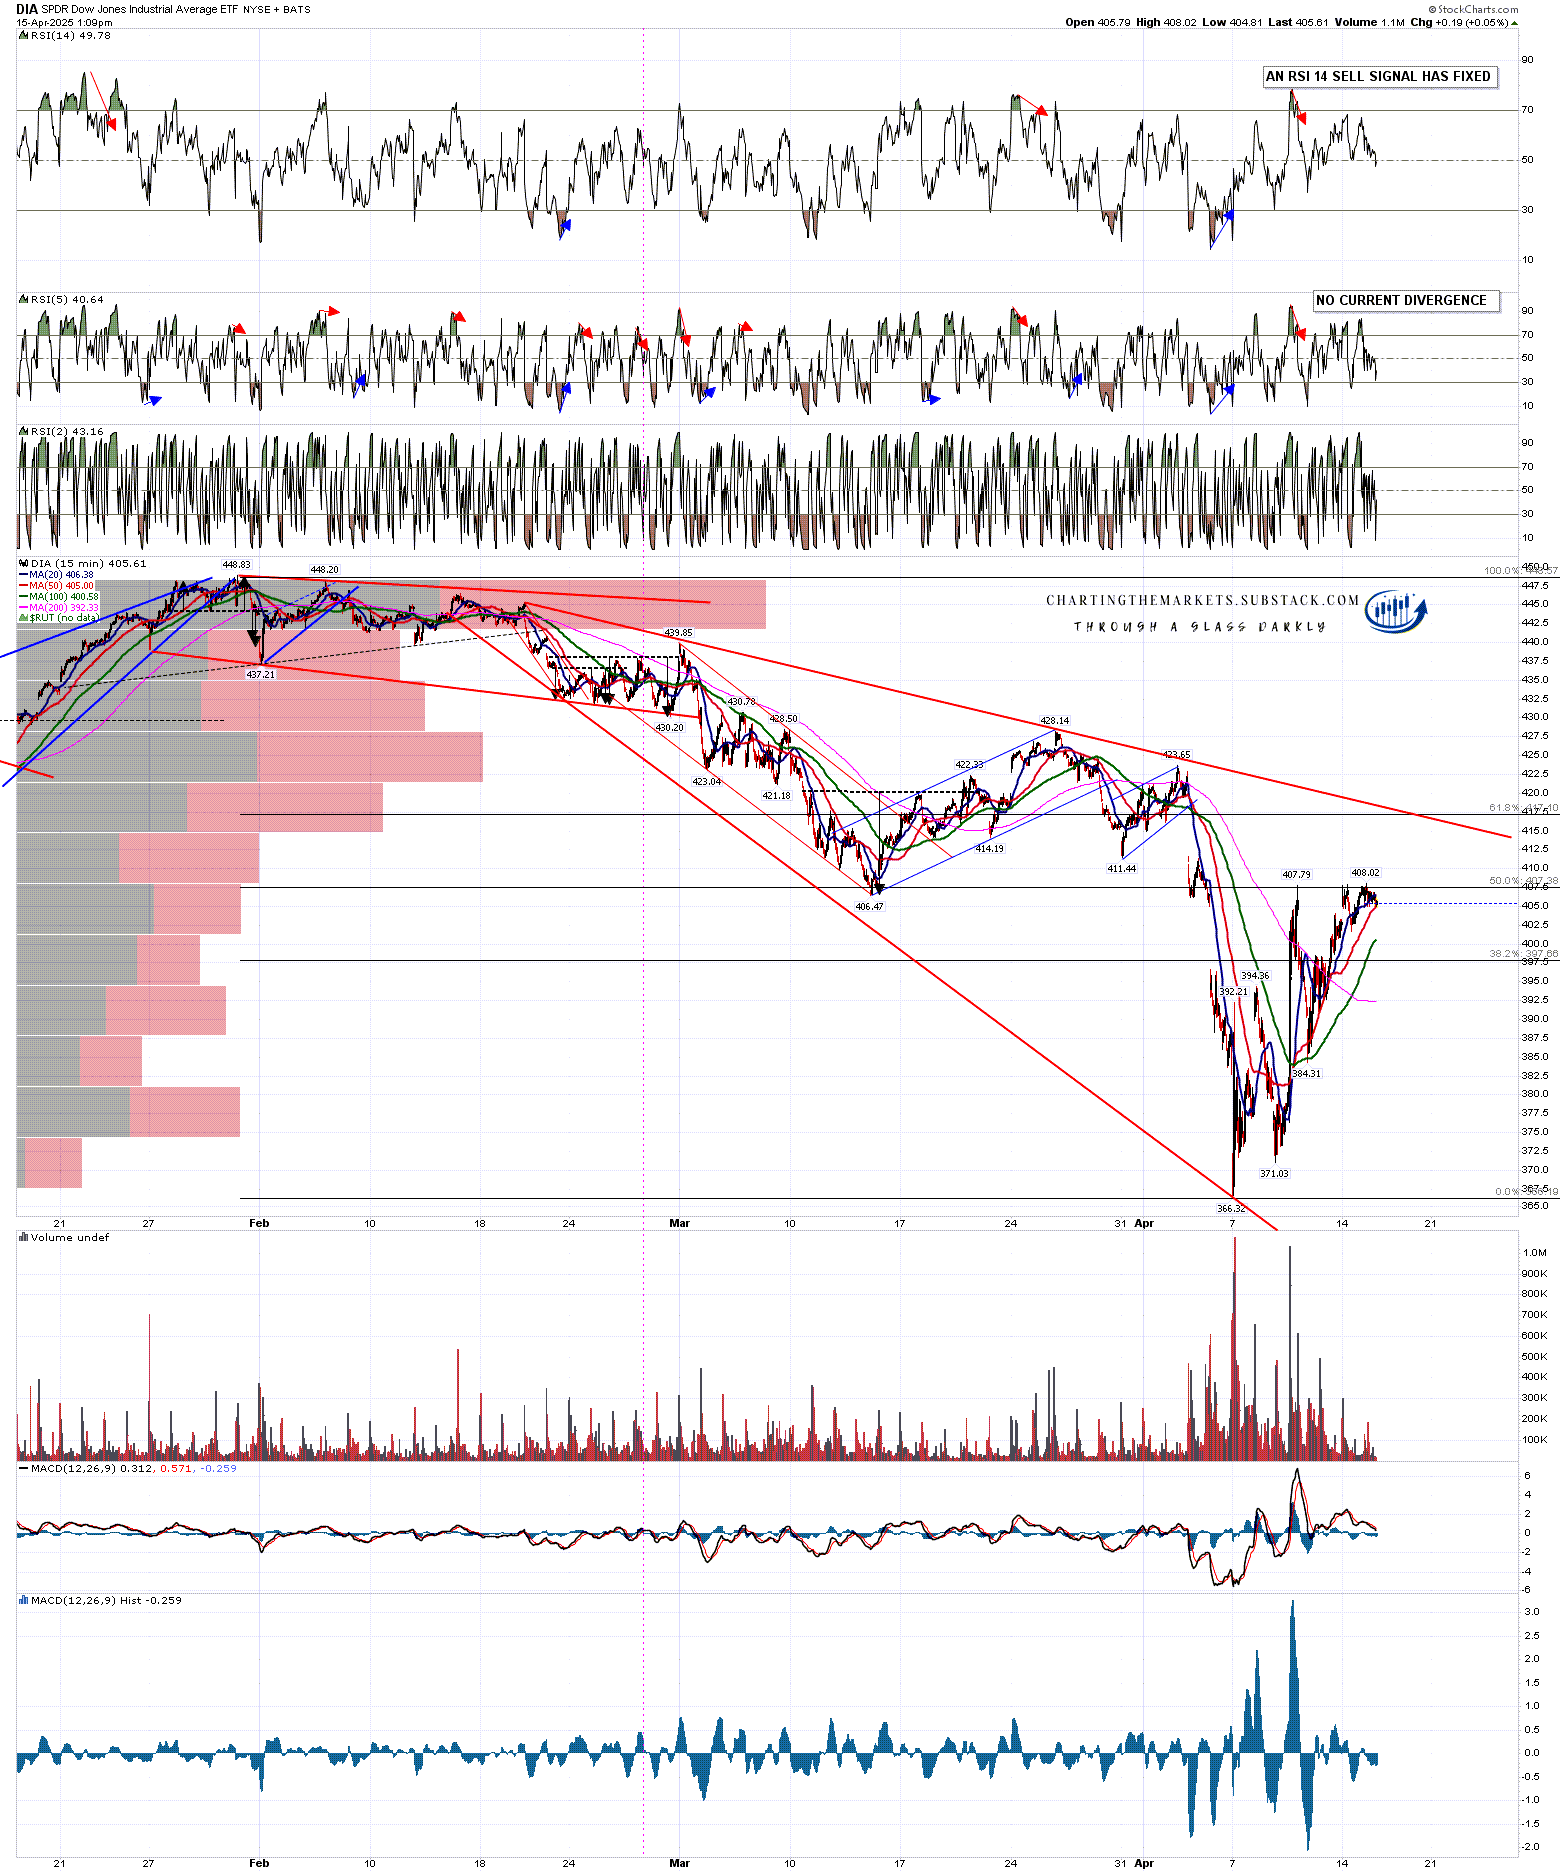
On DIA the 50% retracement level at 407.38 has been tested three time since the low and is holding so far. If DIA goes significantly higher then declining resistance is currently in the 419 area. If this is just going to be a short rally then a test and fail at either would be an obvious level to turn back down.
DIA 15min chart:
A lot of people seem to feel that the tariff delay on Wednesday was the end of the economic troubles this year. I think those troubles are just getting started and that the trade wars of various sizes being waged by the Trump administration are likely only part of that developing story. I’m doing a series of three posts this week on my The Bigger Picture substack on the US Dollars, US Treasuries, and the reasons to be concerned about the possible sharp declines on both this year. Look out for those as they complement the overall picture that we are looking at equities.
Thought for the day. The American revolution got started in protest against a tariff of 10% on tea imposed by the British, and the French revolution got started when the French Government defaulted on their government bonds.
As I have been since the start of 2025 I’m still leaning on the bigger picture towards a weak first half of 2025 and new all time highs later in the year, very possibly as a topping process for a much more significant high. One way or another I think we’ll be seeing lower soon and I’m not expecting this to be a good year for US equities, not least because both of the last two years have been banner years for US equities. A third straight year of these kinds of gains looks like a big stretch. I could of course however be mistaken. UPDATE 11th March 2025 - I am wondering if this may be a bear market that dominates the whole of 2025.
If you like my analysis and would like to see more, please take a free subscription at my chartingthemarkets substack, where I publish these posts first. I also do a premarket video every day on equity indices, bonds, currencies, energies, precious commodities and other commodities at 8.45am EST. If you’d like to see those I post the links every morning on my twitter, and the videos are posted shortly afterwards on my Youtube channel.
No comments:
Post a Comment