- WE'RE JUST RANDOM SPECKS OF DUST IN A TORNADO TO THE MARKETS .......
- CHARTISTS MUST PUT ALL BIAS ASIDE AND LET THE CHARTS DO THE TALKING OR WE'LL SEE ONLY WHAT WE WANT TO SEE
- This blog has a copy of all header posts that I publish anywhere, so that those interested in seeing what my thoughts are on the markets can find them easily.
- I will be answering questions and responding to comments, so feel free to respond to any posts and I will see your comment even if it is not on the most recent post.
- If you're interested in seeing any intraday charts I post, I do that on twitter, and my twitter handle is @shjackcharts.
- The charts in the posts are as large as I can practically make them. if you would like to look at one more closely, click on it, and the link will take you to a larger version at screencast. If you click on that again, you will get a full page version, and can use the resizing function on your browser to enlarge parts of interest further.

Thursday, 30 October 2025

A VERY Important Inflection Point on Crypto

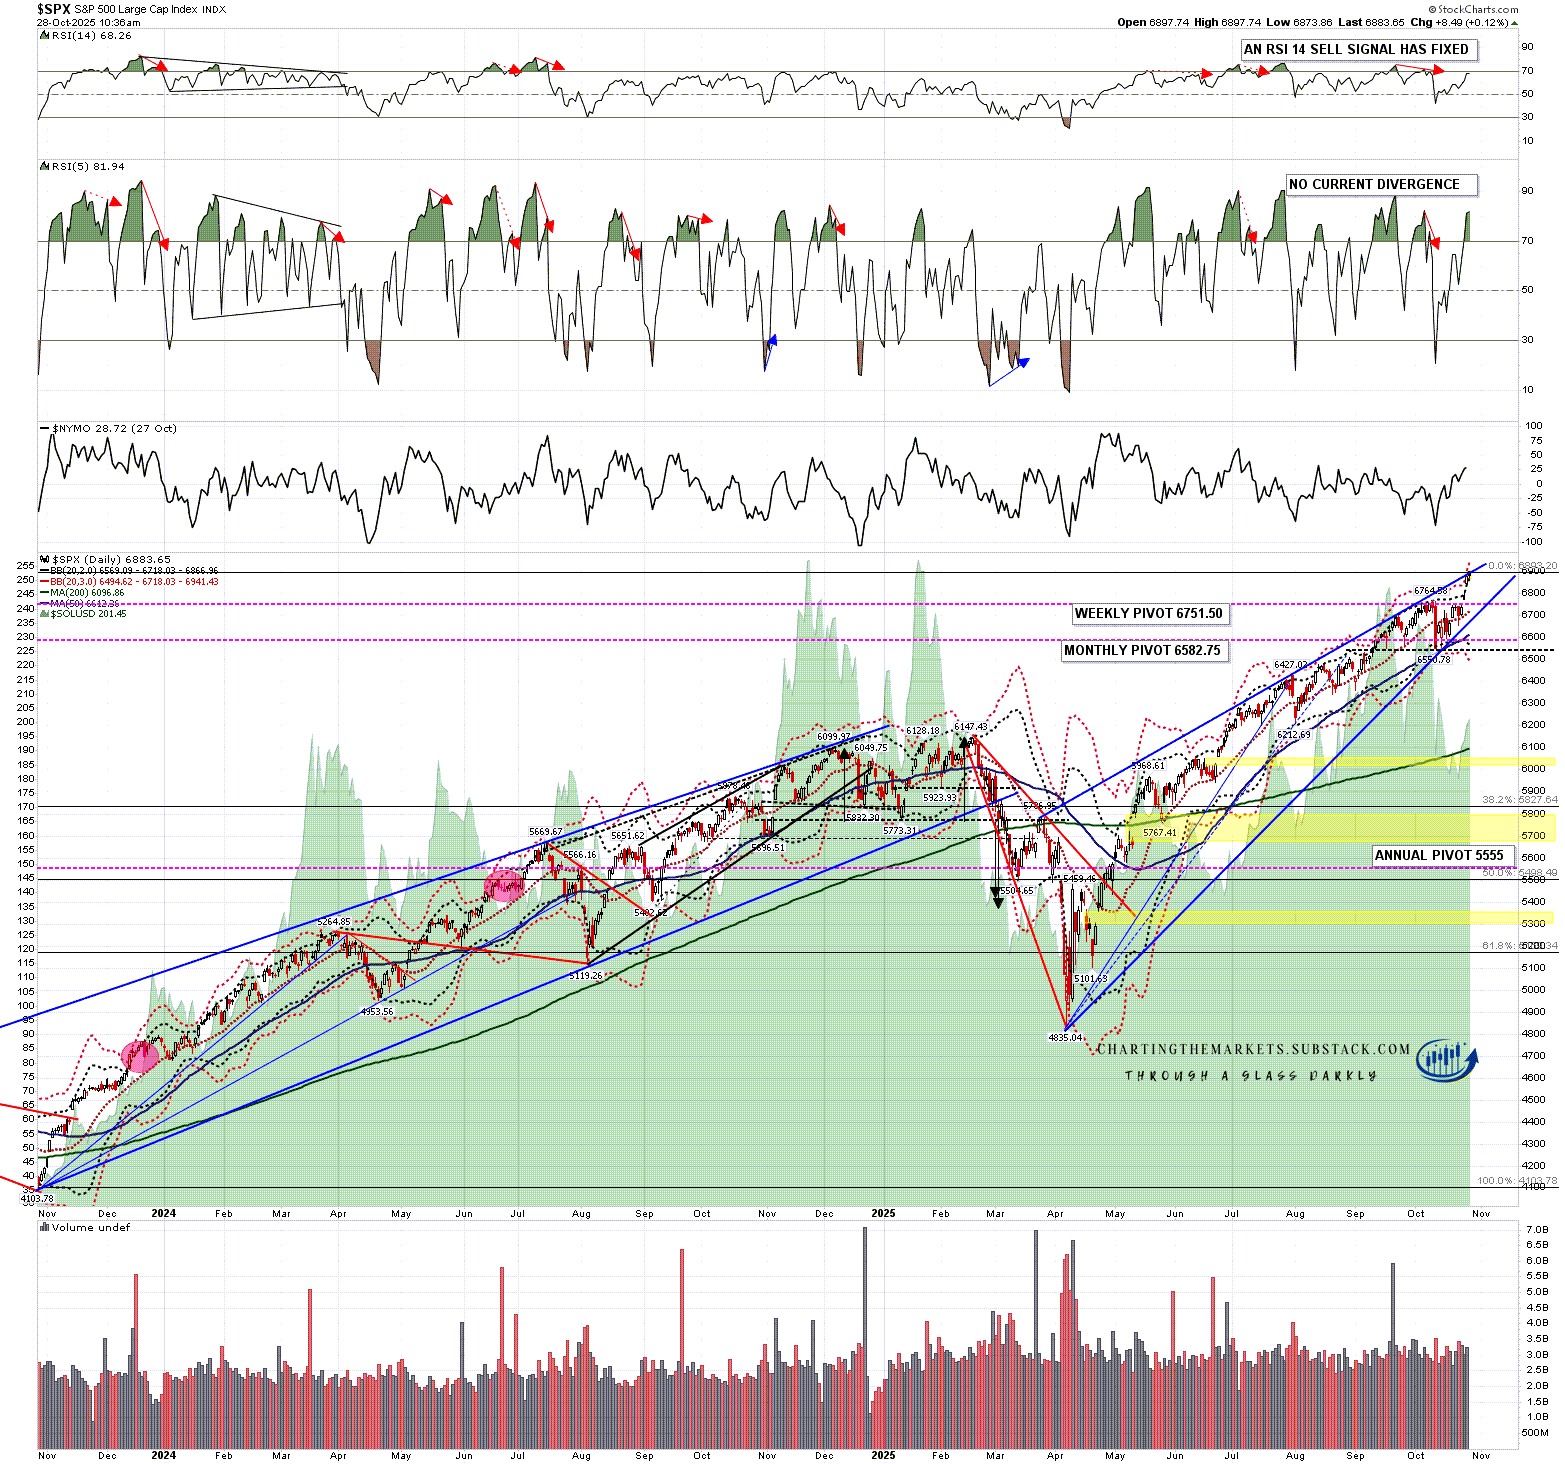
In my last post on Wednesday 22nd October I was looking at the major support being tested on Bitcoin (BTCUSD), Solana (SOLUSD), and Ethereum (ETHUSD), and saying that sustained breaks below those support levels would boost the case that the bull market on Crypto has already ended, barring possible high retests as part of the topping process. This was and is a major inflection point, and the direction of the break from this inflection point is still in the balance.

I was noting that the last two bull market highs on Bitcoin were in December 2017 and November 2021, close to the end of the year and four years apart, so the end of 2025 is the obvious period to be looking for an end to the current bull market, and I've had that pencilled in at the likely topping area all year.

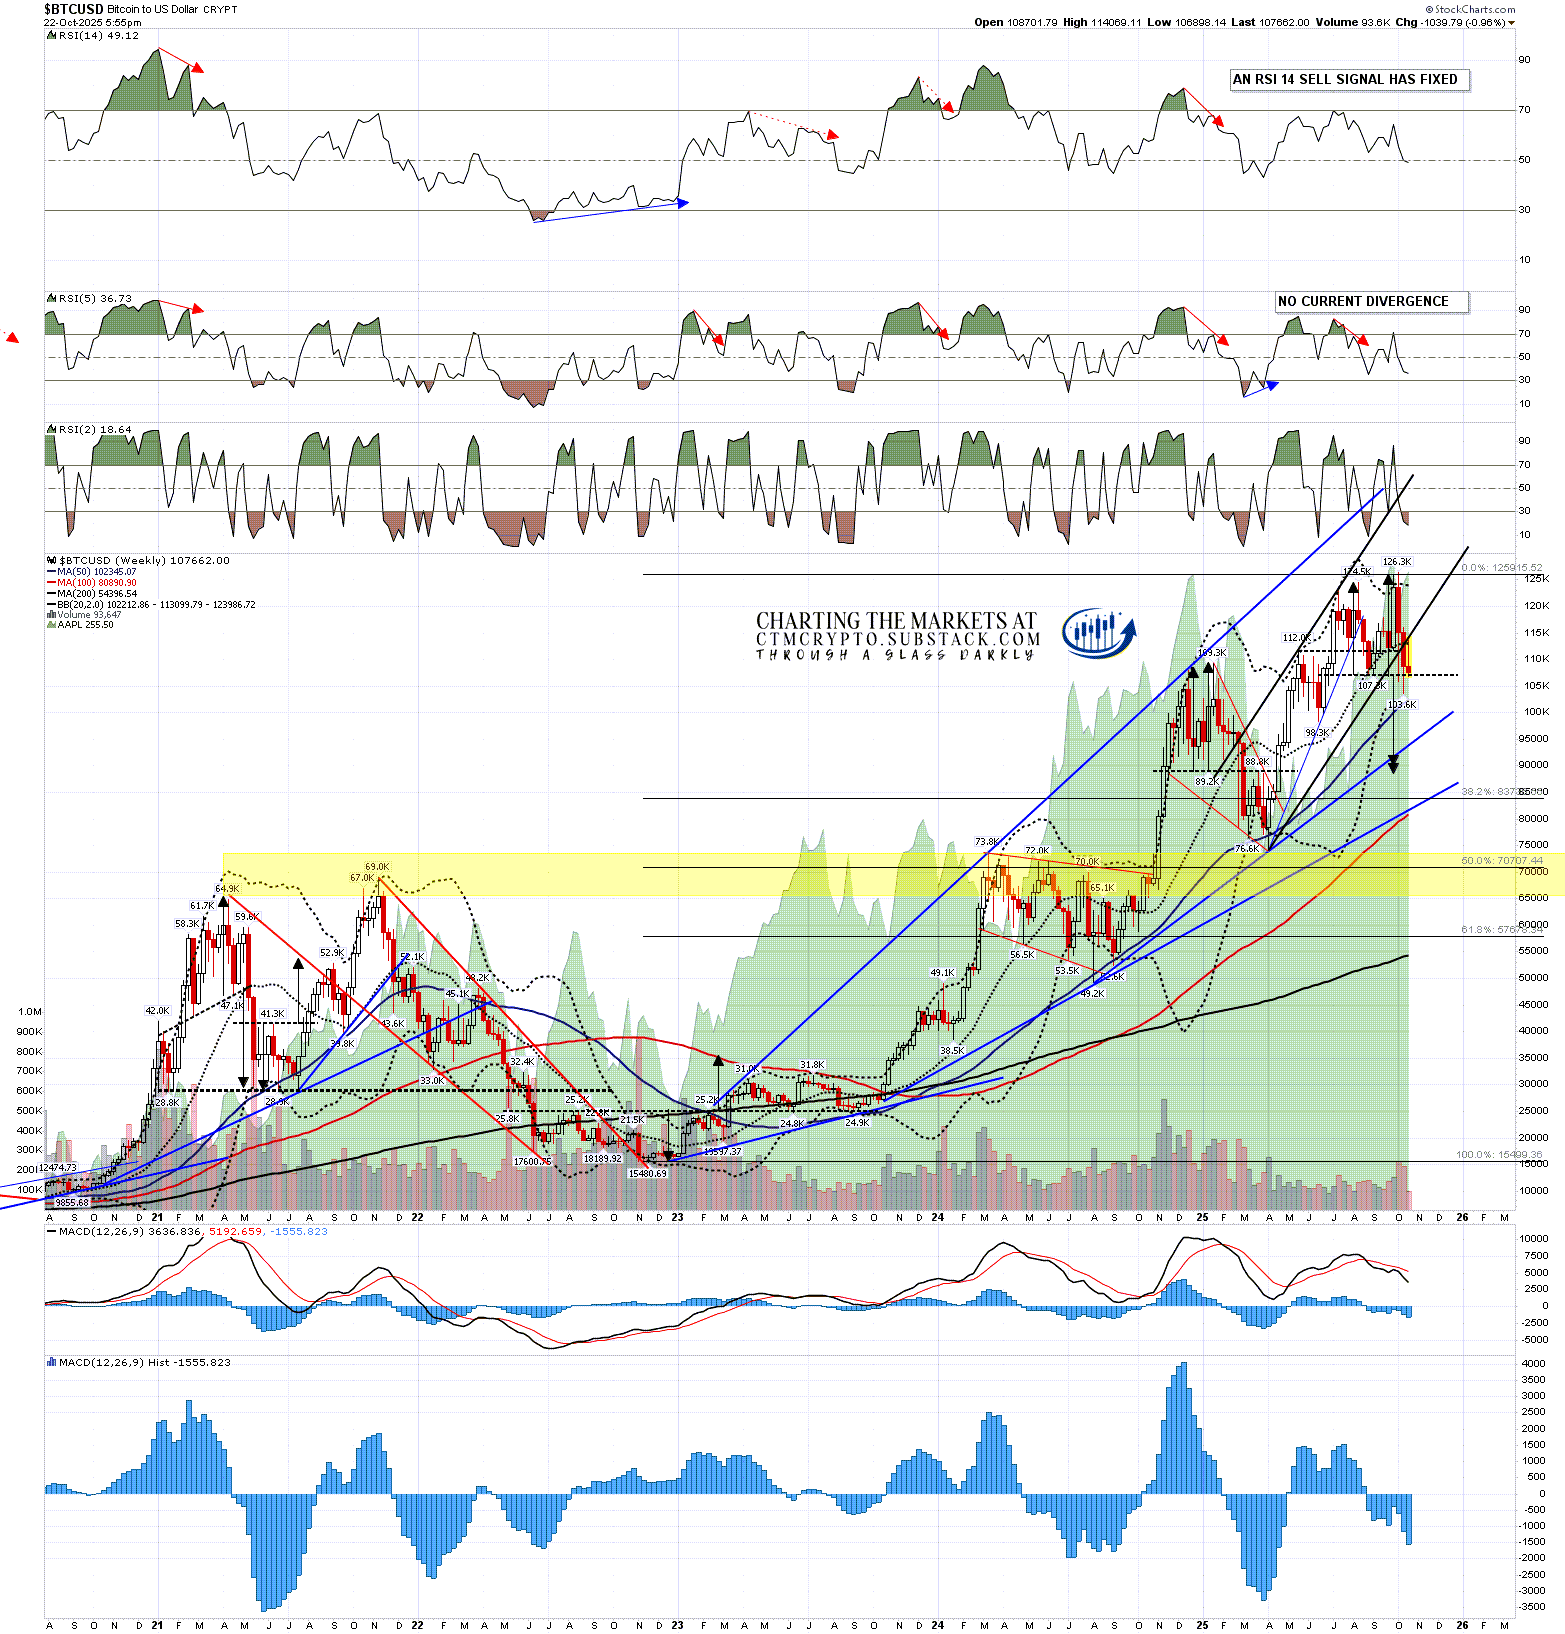
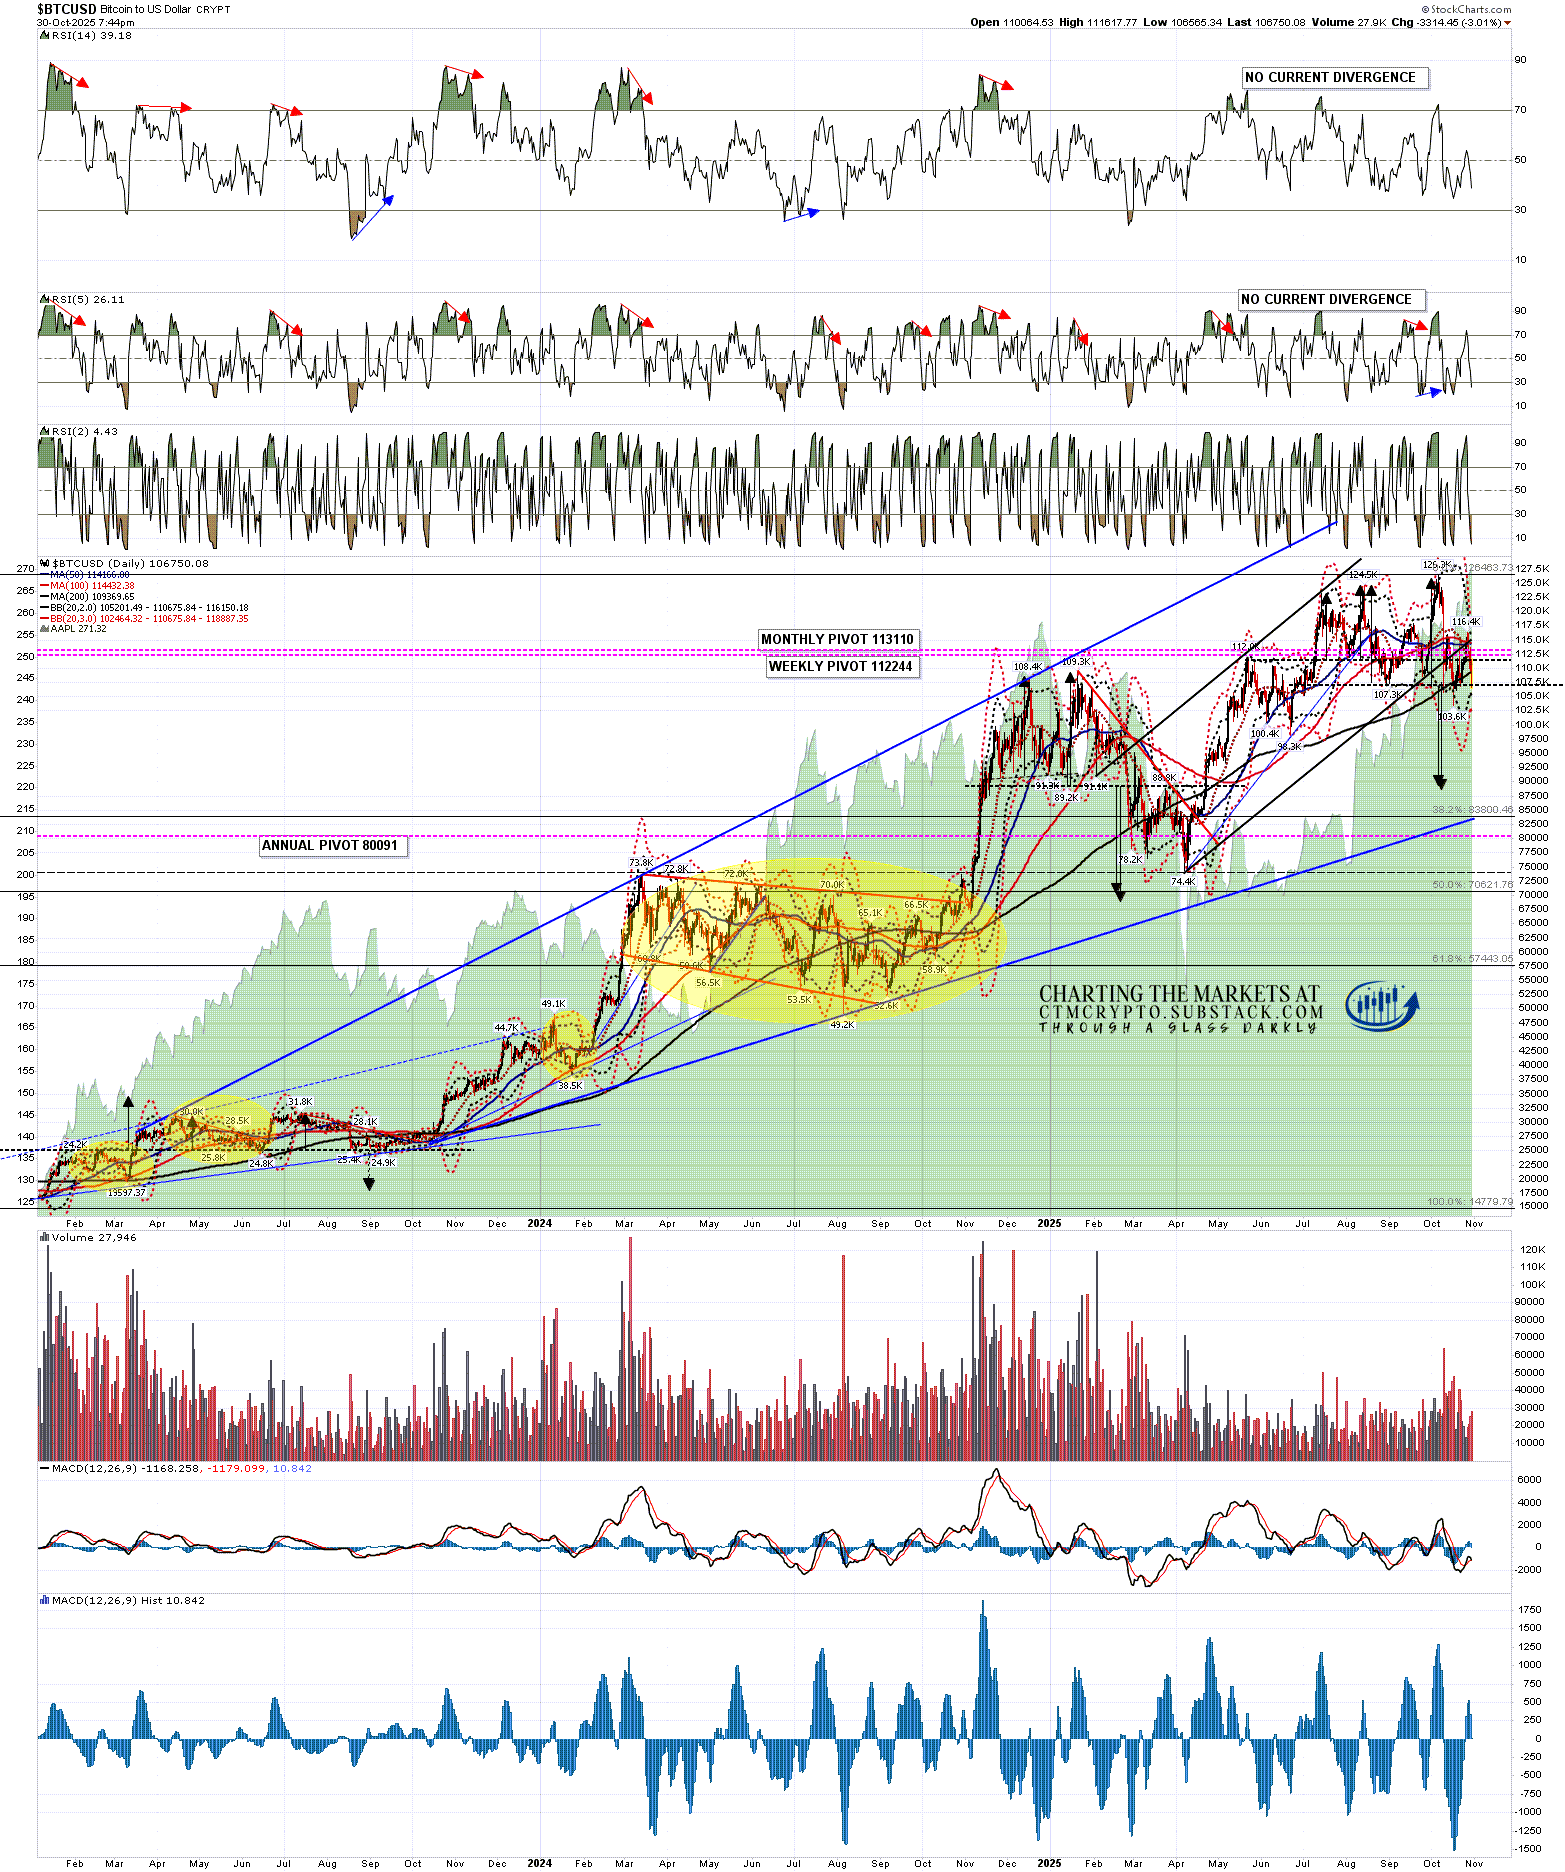
On the Bitcoin weekly chart the first big support is the weekly middle band, which was tested as support for six or the seven weeks before Bitcoin broke below it at the weekly close before last. That failed to confirm the support break at the end of last week with Bitcoin closing back above it. Bitcoin is back below that again at the moment.

The second big support is at the 50 week MA, currently at 102,832, and this is the really important level, that held as support on a weekly close basis through the last bull market until after the final high, and has held so far as support in this bull market. If we should see a significant closing break below that then there will be a strong case that this bull market is over or ending.

BTCUSD weekly chart:

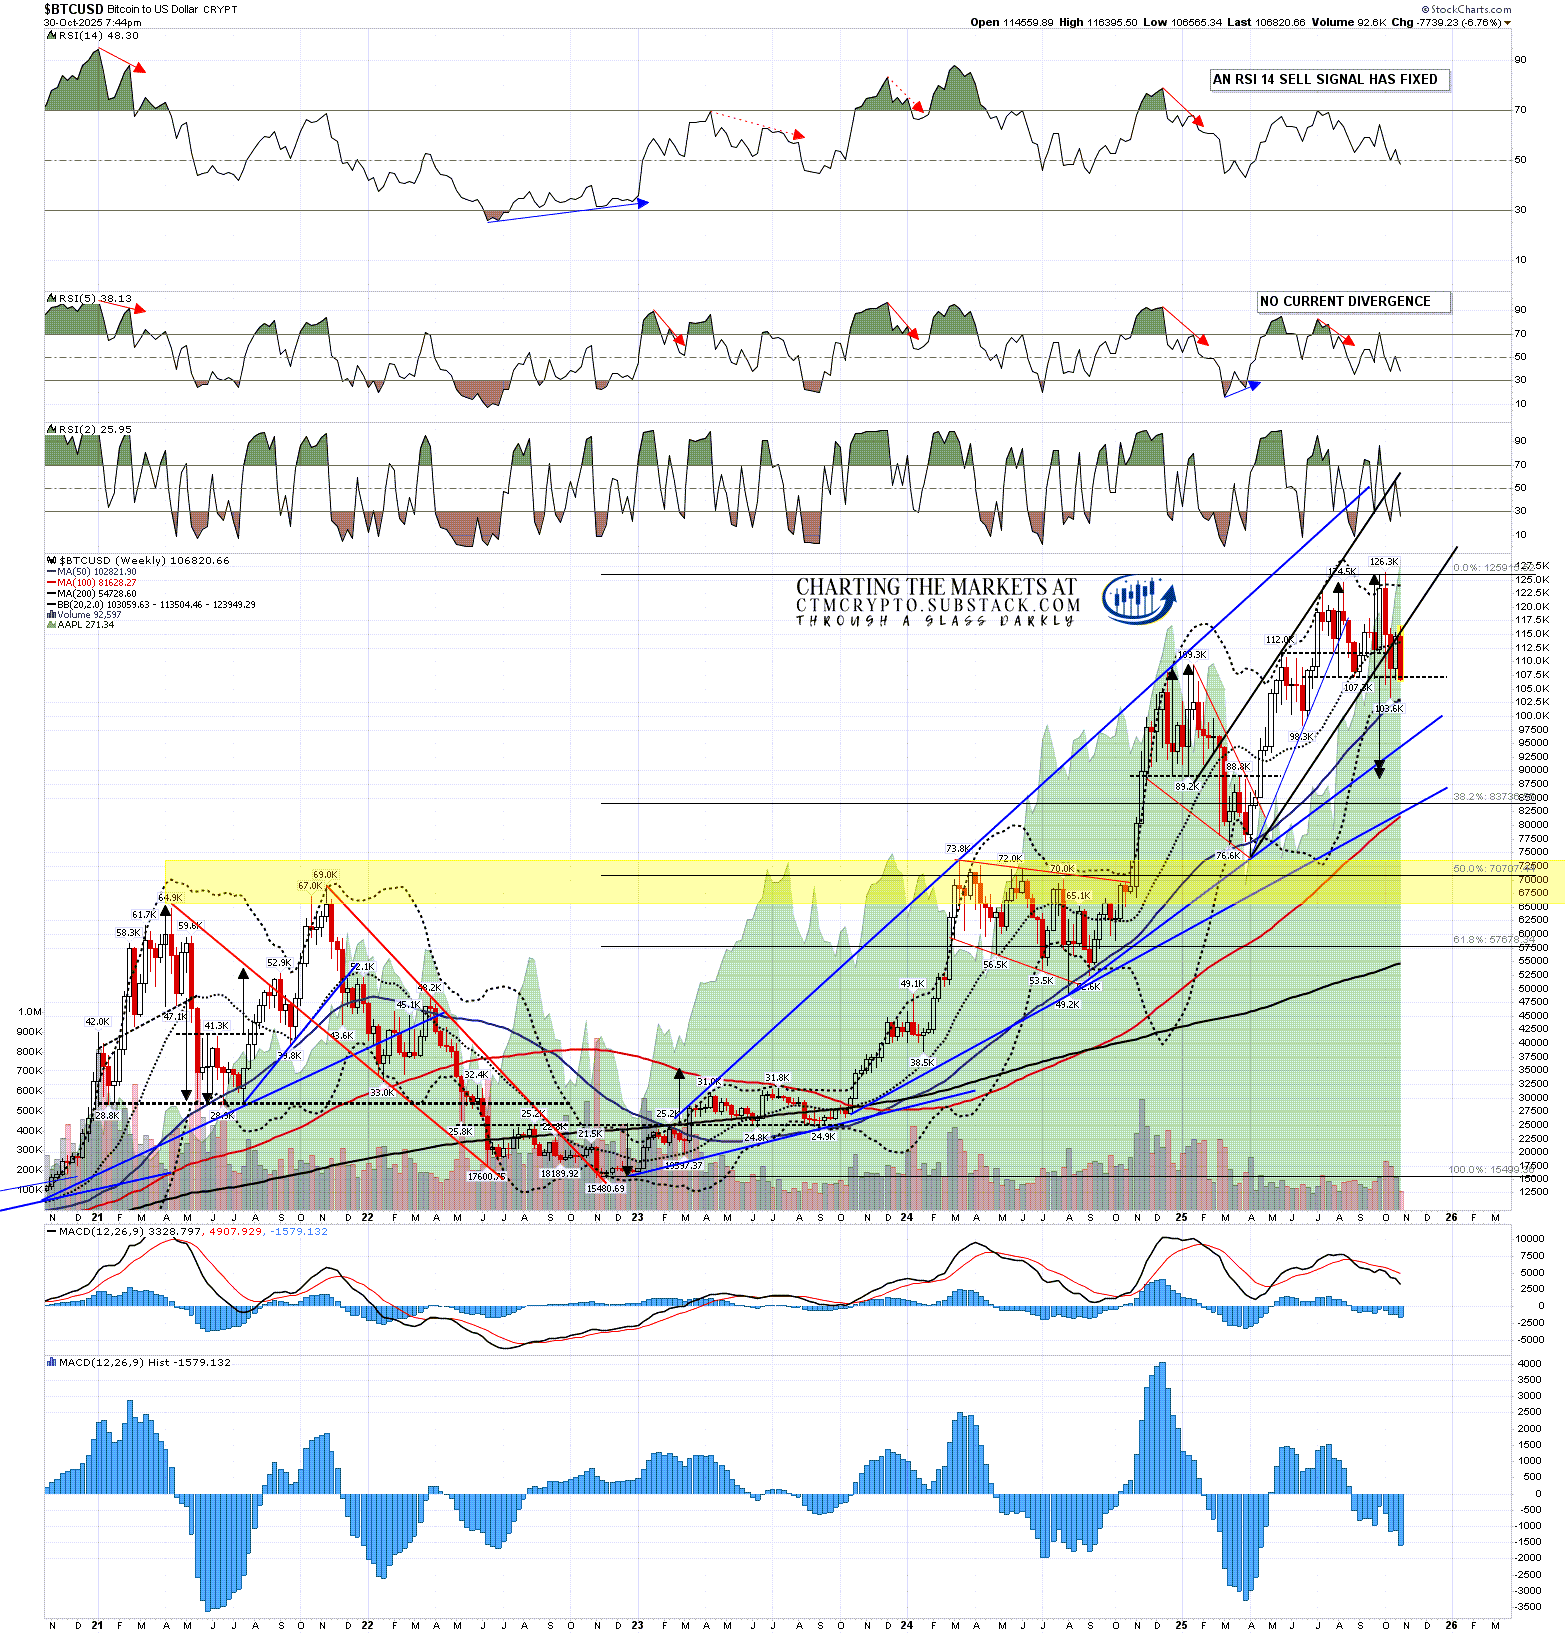
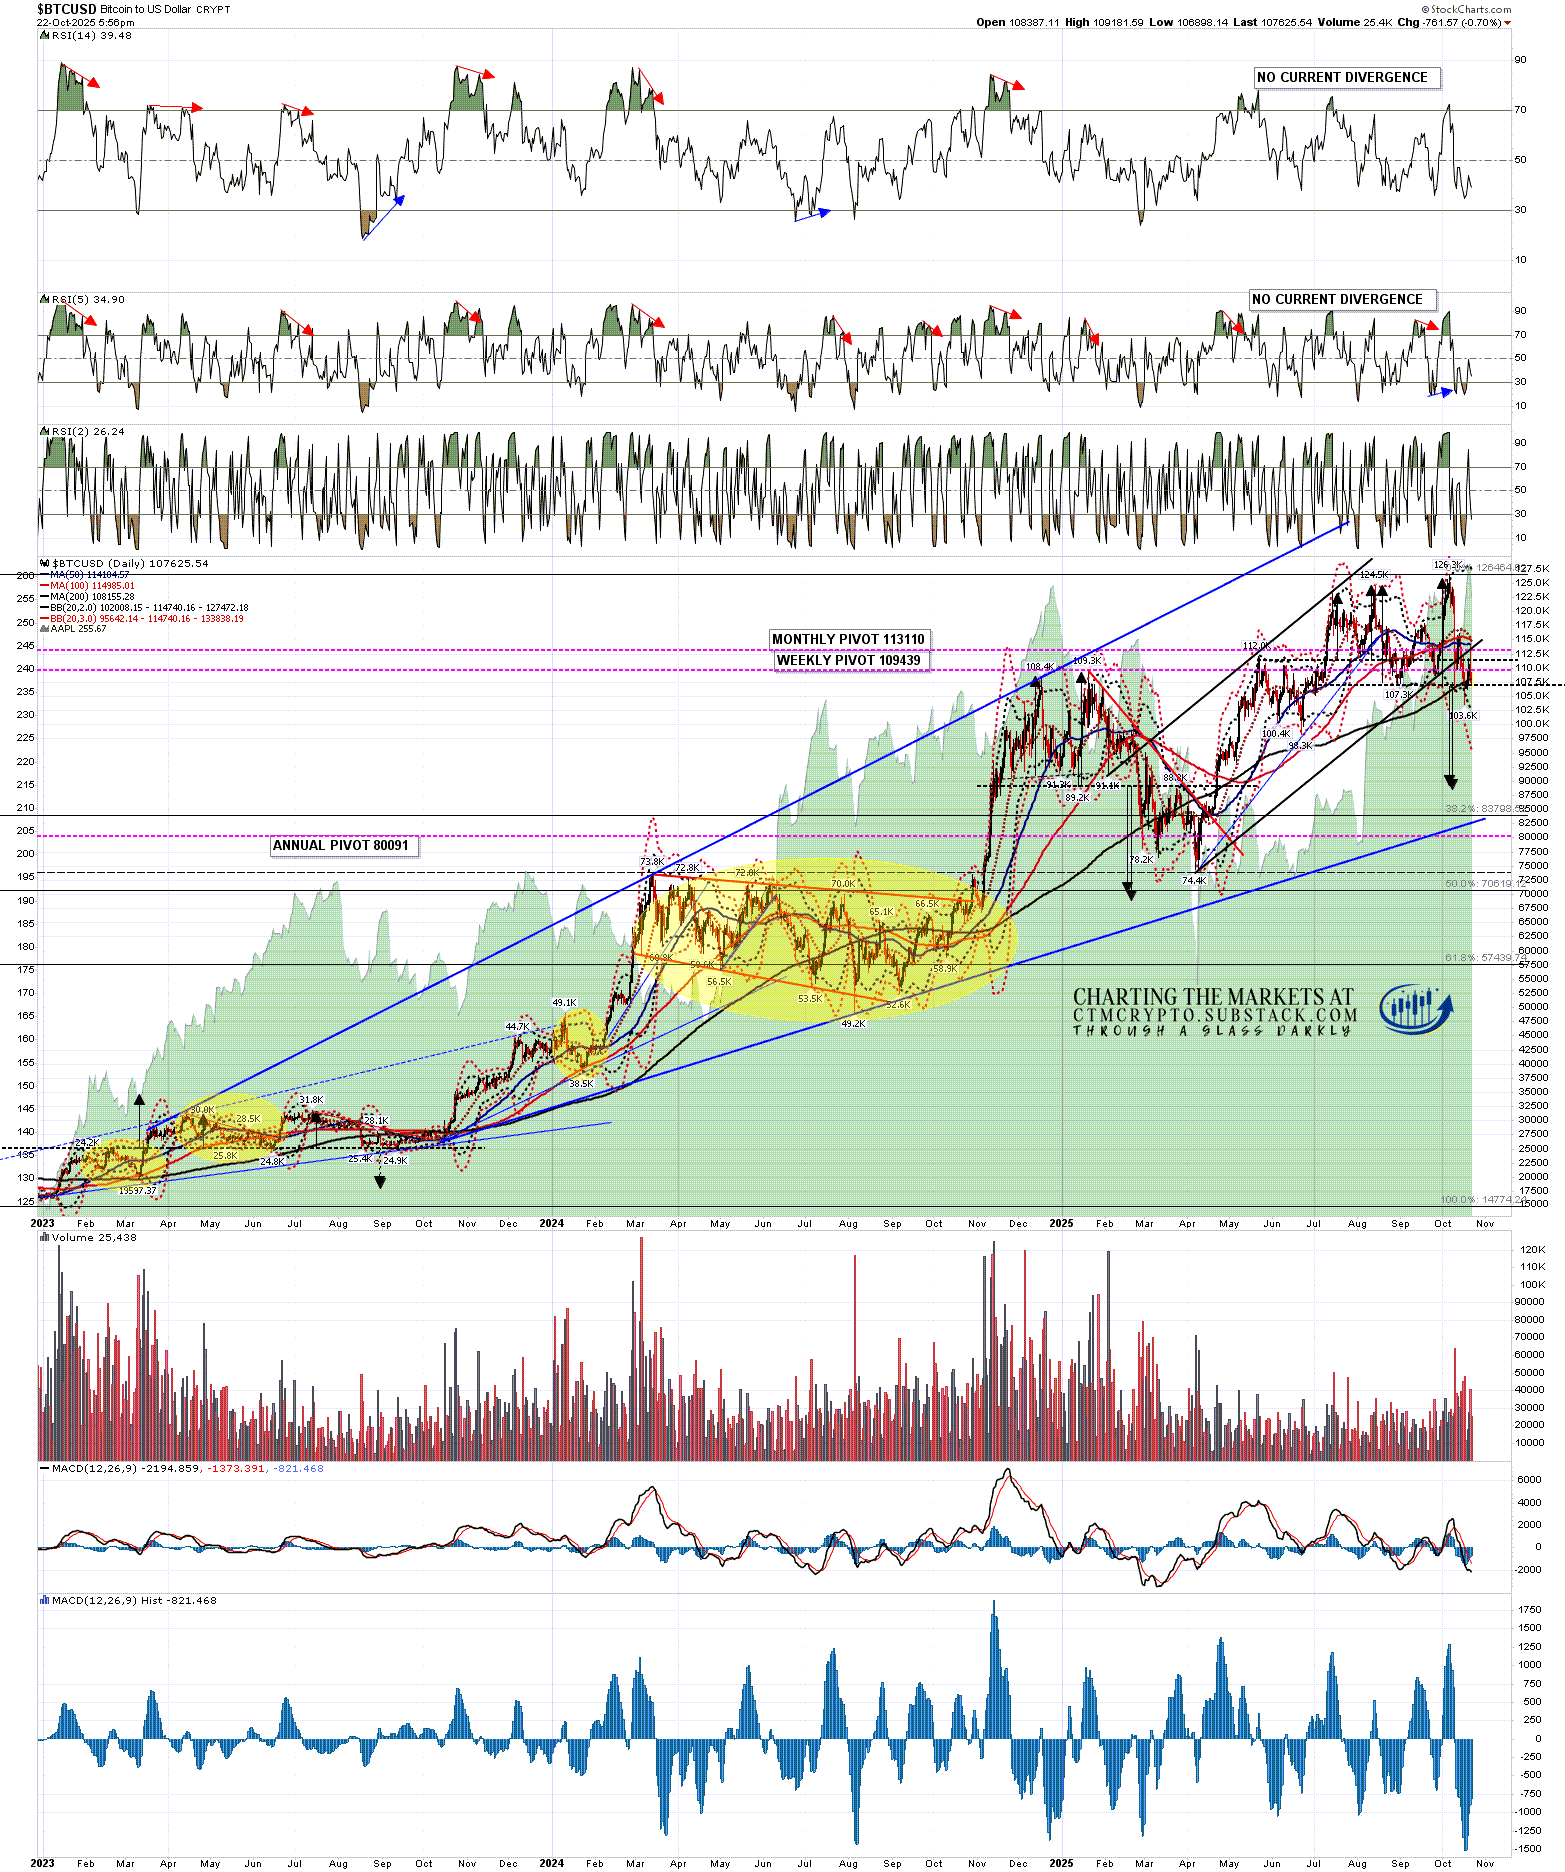
On the daily chart Bitcoin is testing the 200dma as support, currently at 109,372. This has been good support during this bull market and has been broken with conviction three times in the last two years, with these breaks delivering extended retracements lasting a further one, three and seven months before a sustained break back above.

If Bitcoin breaks down from this inflection point then a double top has already broken down with a target in the 88.3k to 90k area. If Bitcoin breaks up from this inflection point then a sustained break up directly from here (106.8k area), over the last rally high at 116.4k, would look for a retest of the all time high.

BTCUSD daily chart:

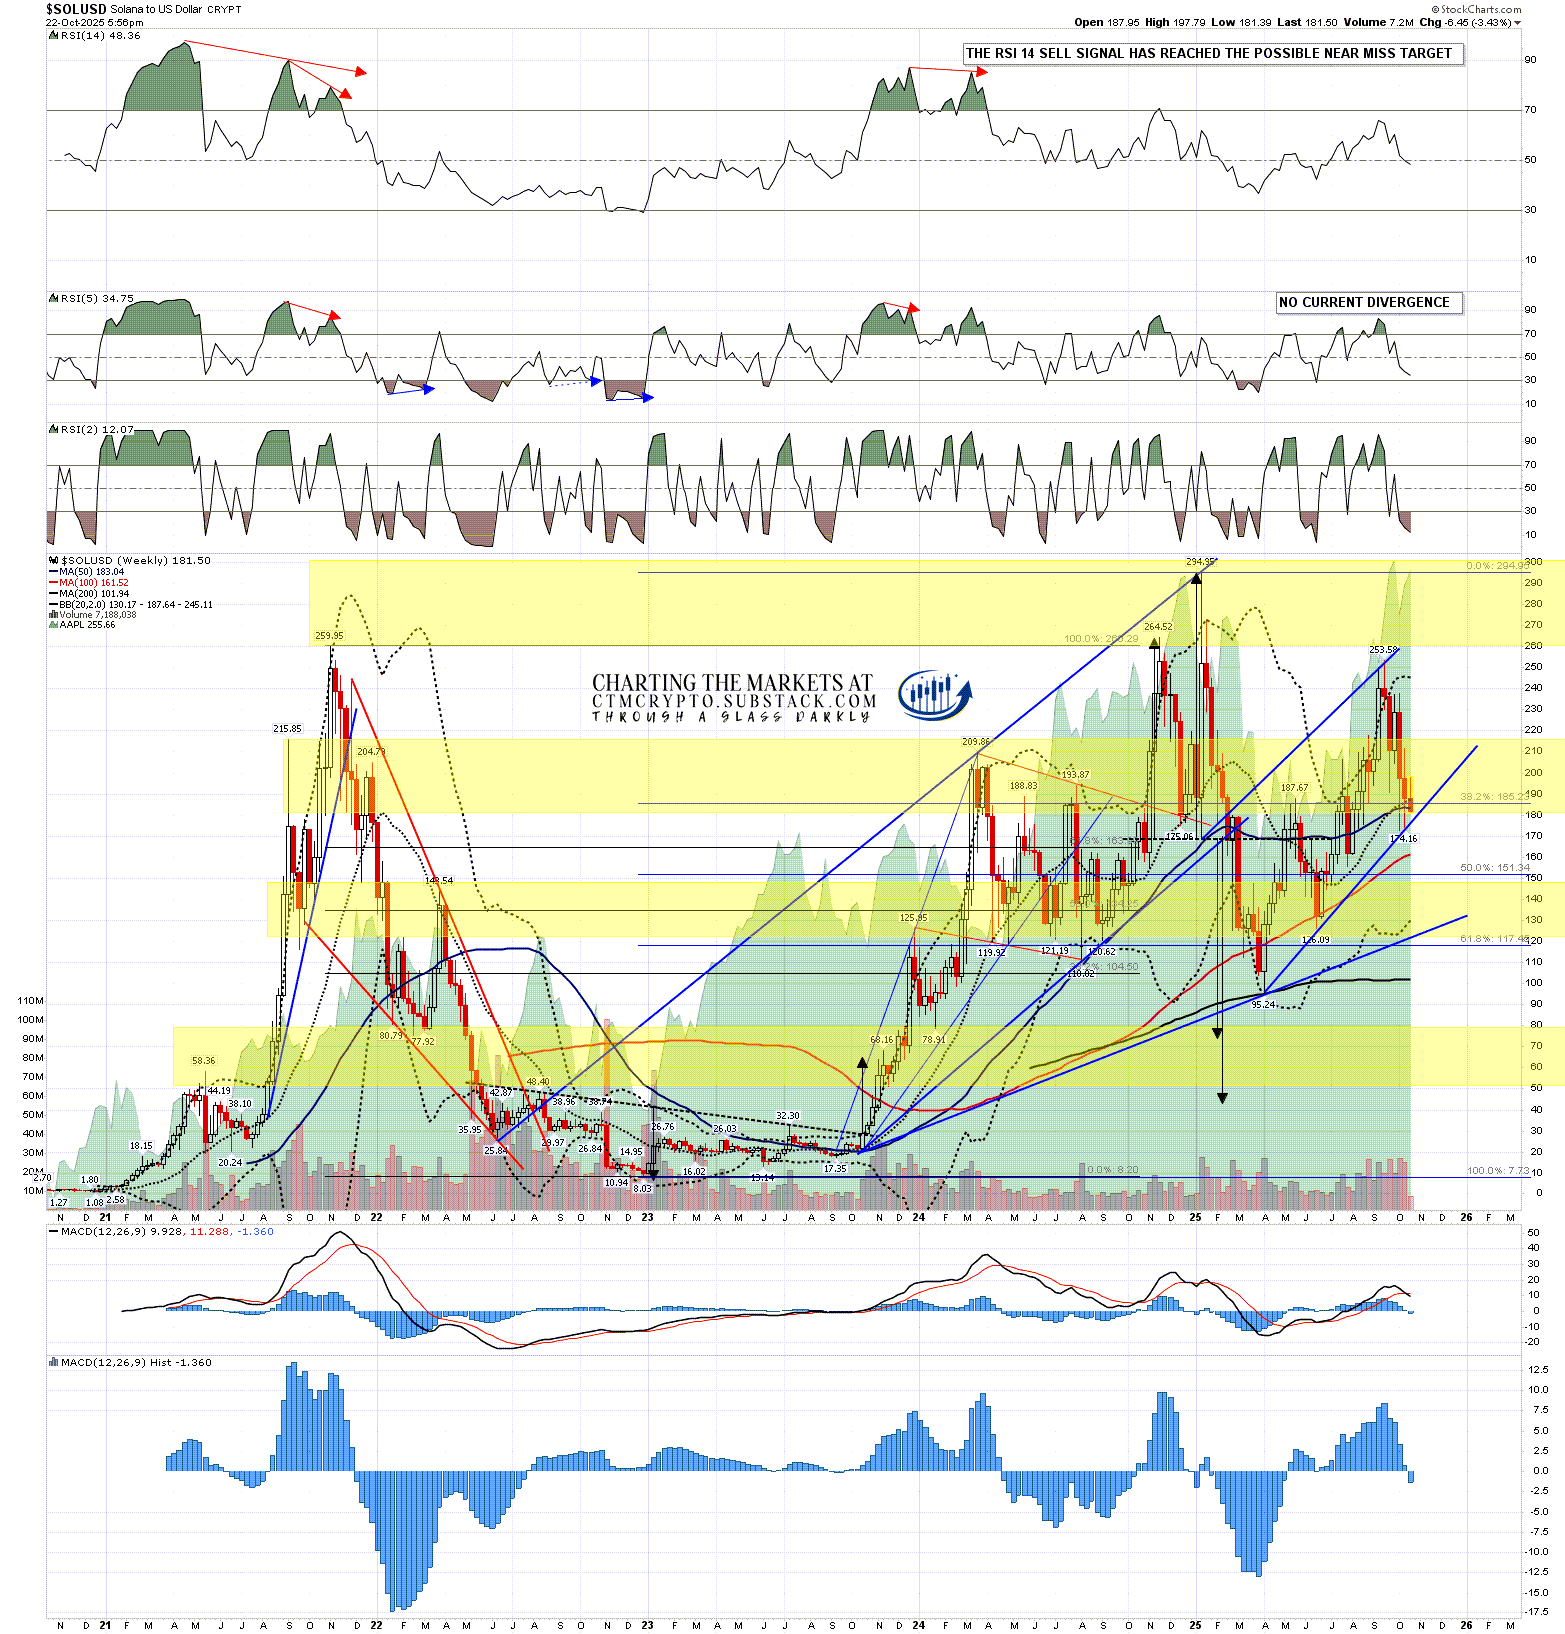
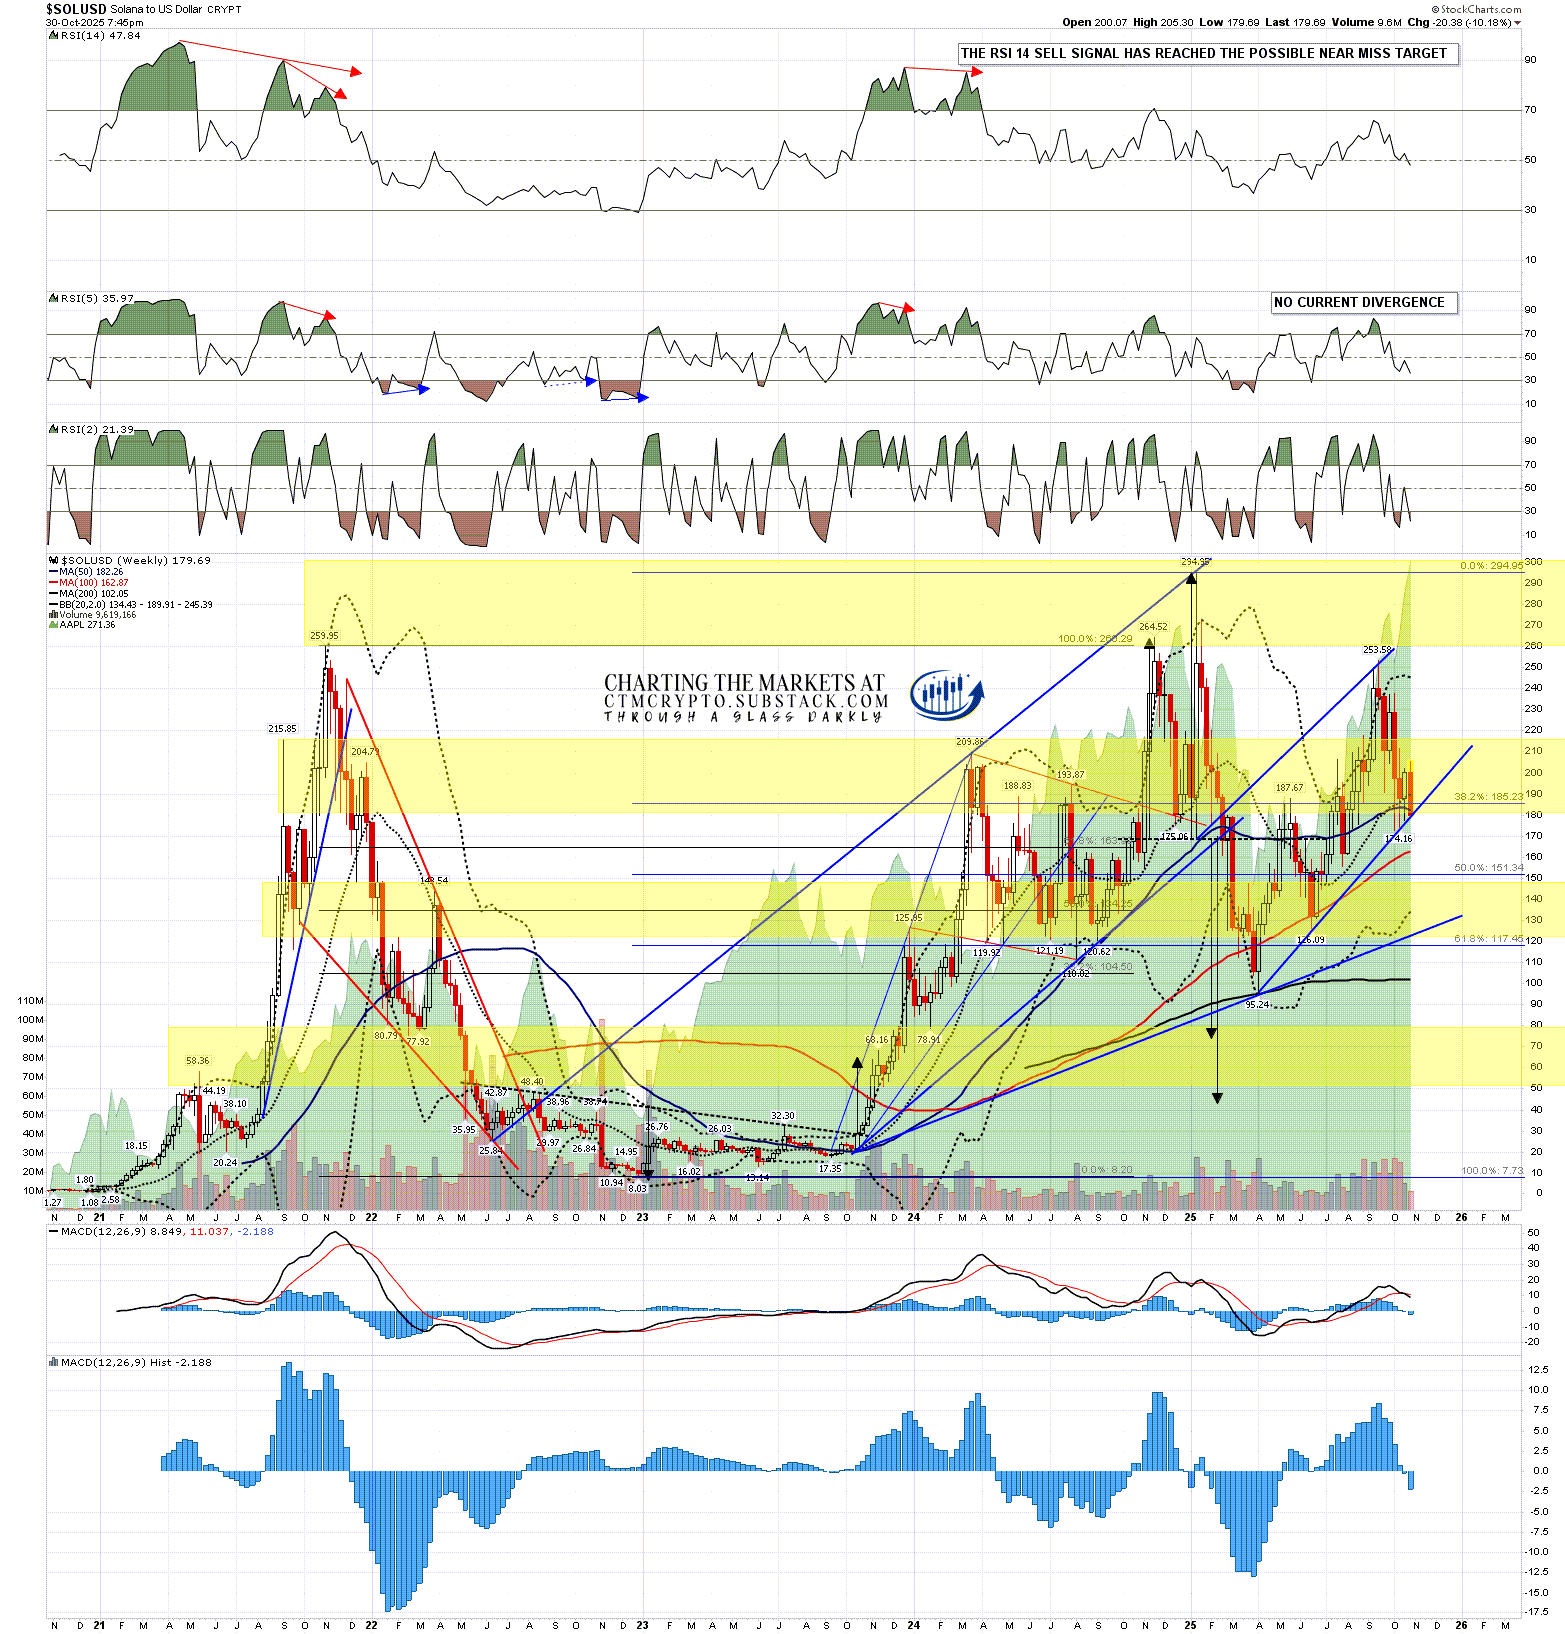
On Solana the weekly middle band has been tested as support every week for the last four weeks and has still not been broken on a weekly close basis. That may still hold as support. That’s currently at 190, just above the 50 week MA at 182.29. That 50 week MA was again only broken after the last bull market high in Q3 2021, but was broken hard weeks after the all time high made in January, with Solana only breaking back above it with confidence in July.

These are the two big levels on the weekly chart and the only other big level on this chart is the 200 week MA, which was tested at the 2025 low, and is currently at 102.06.

SOLUSD weekly chart:

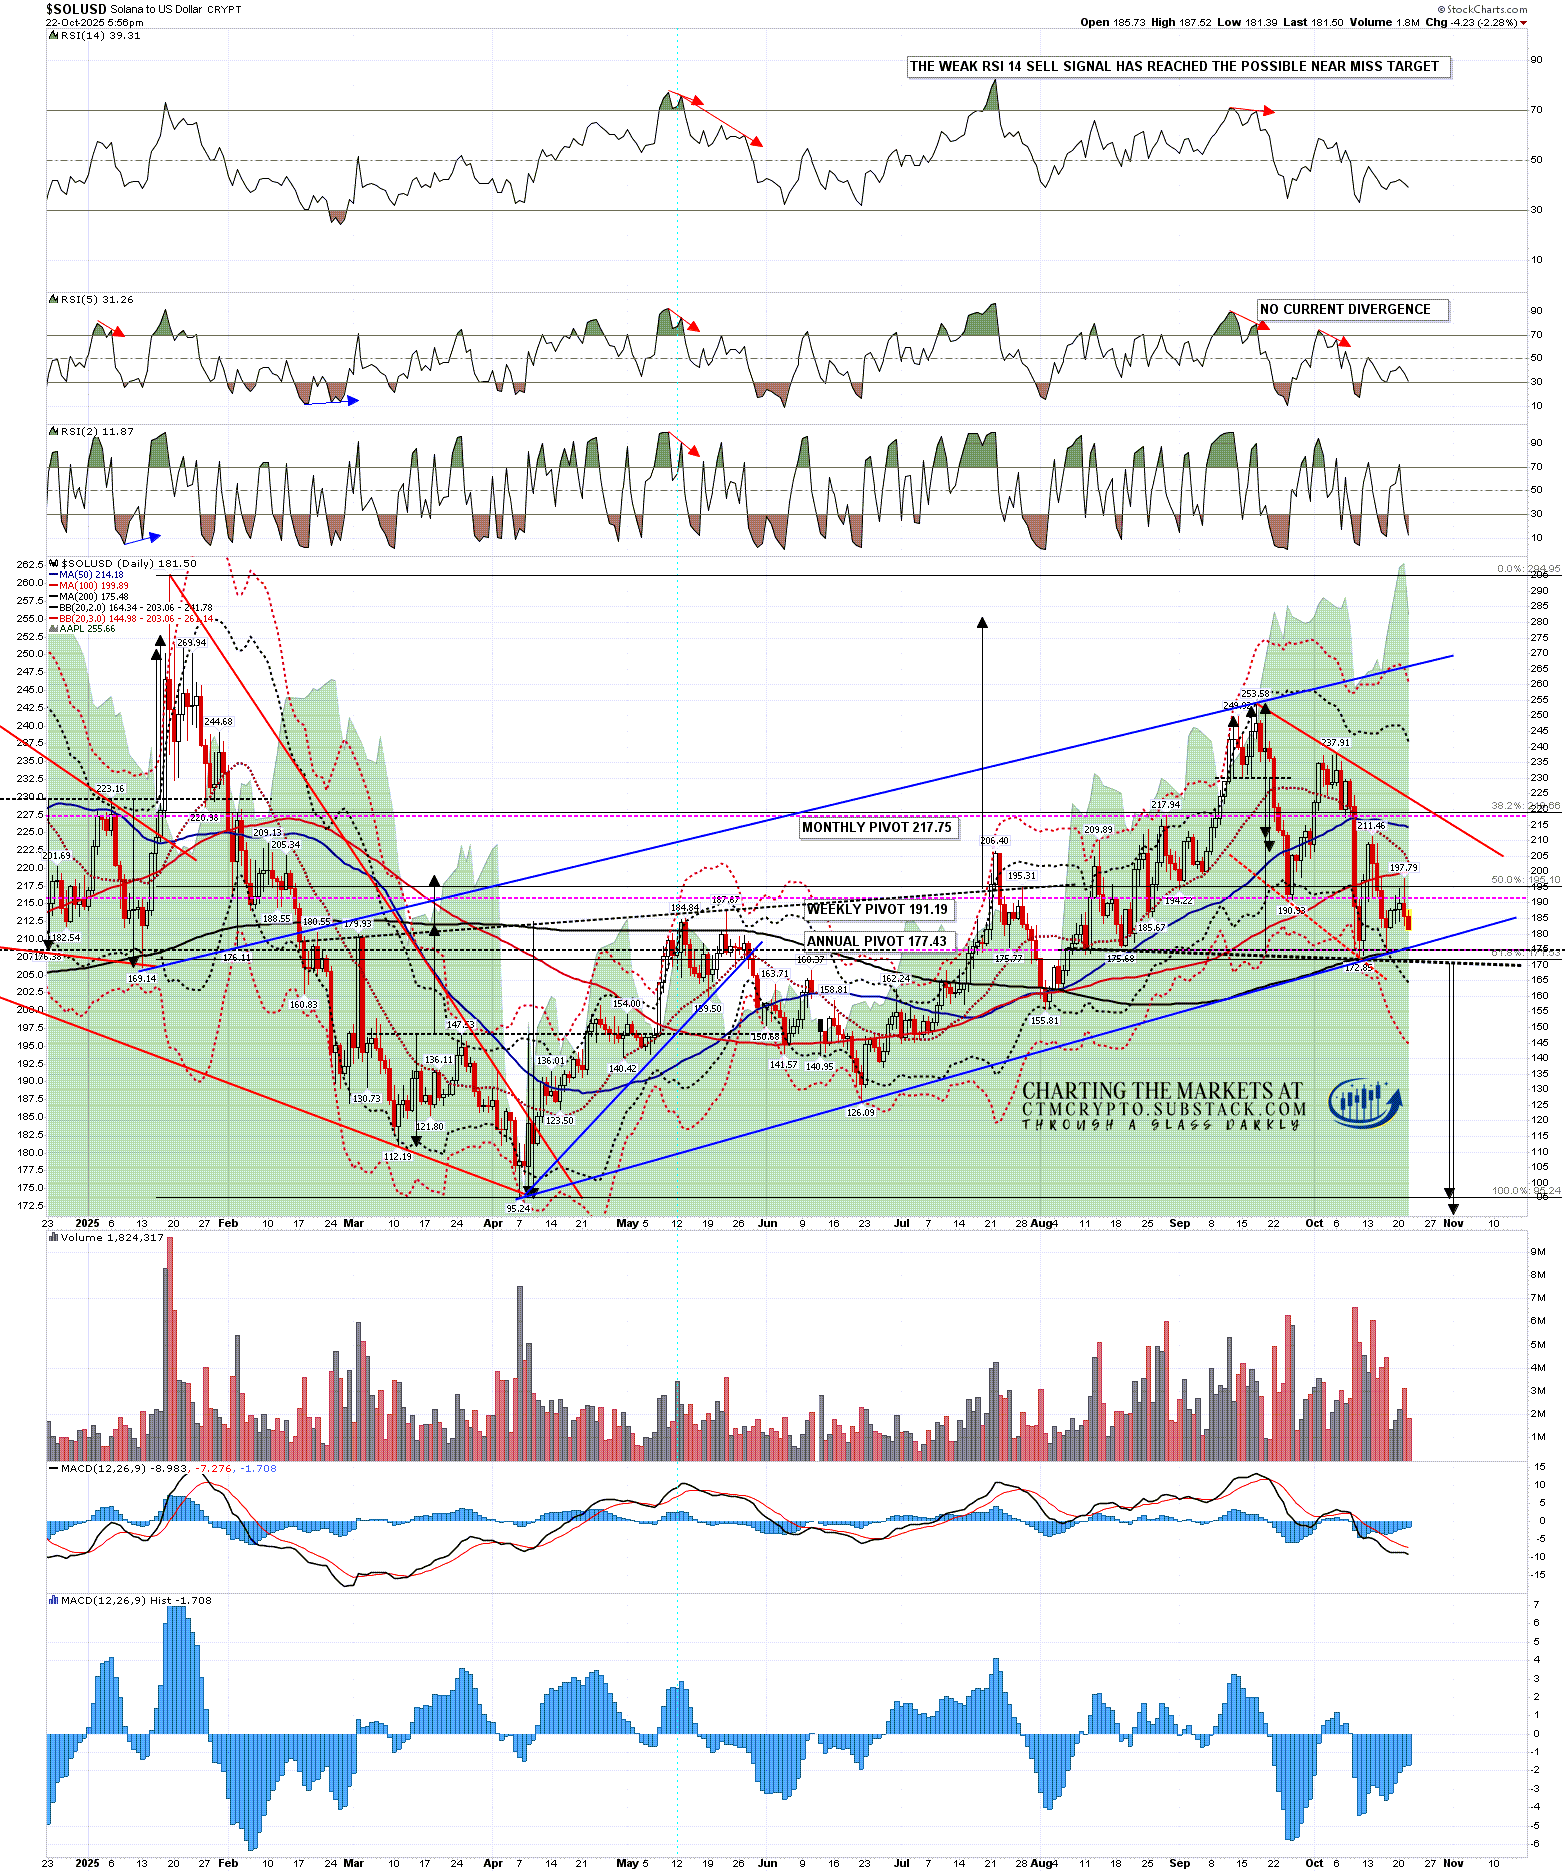
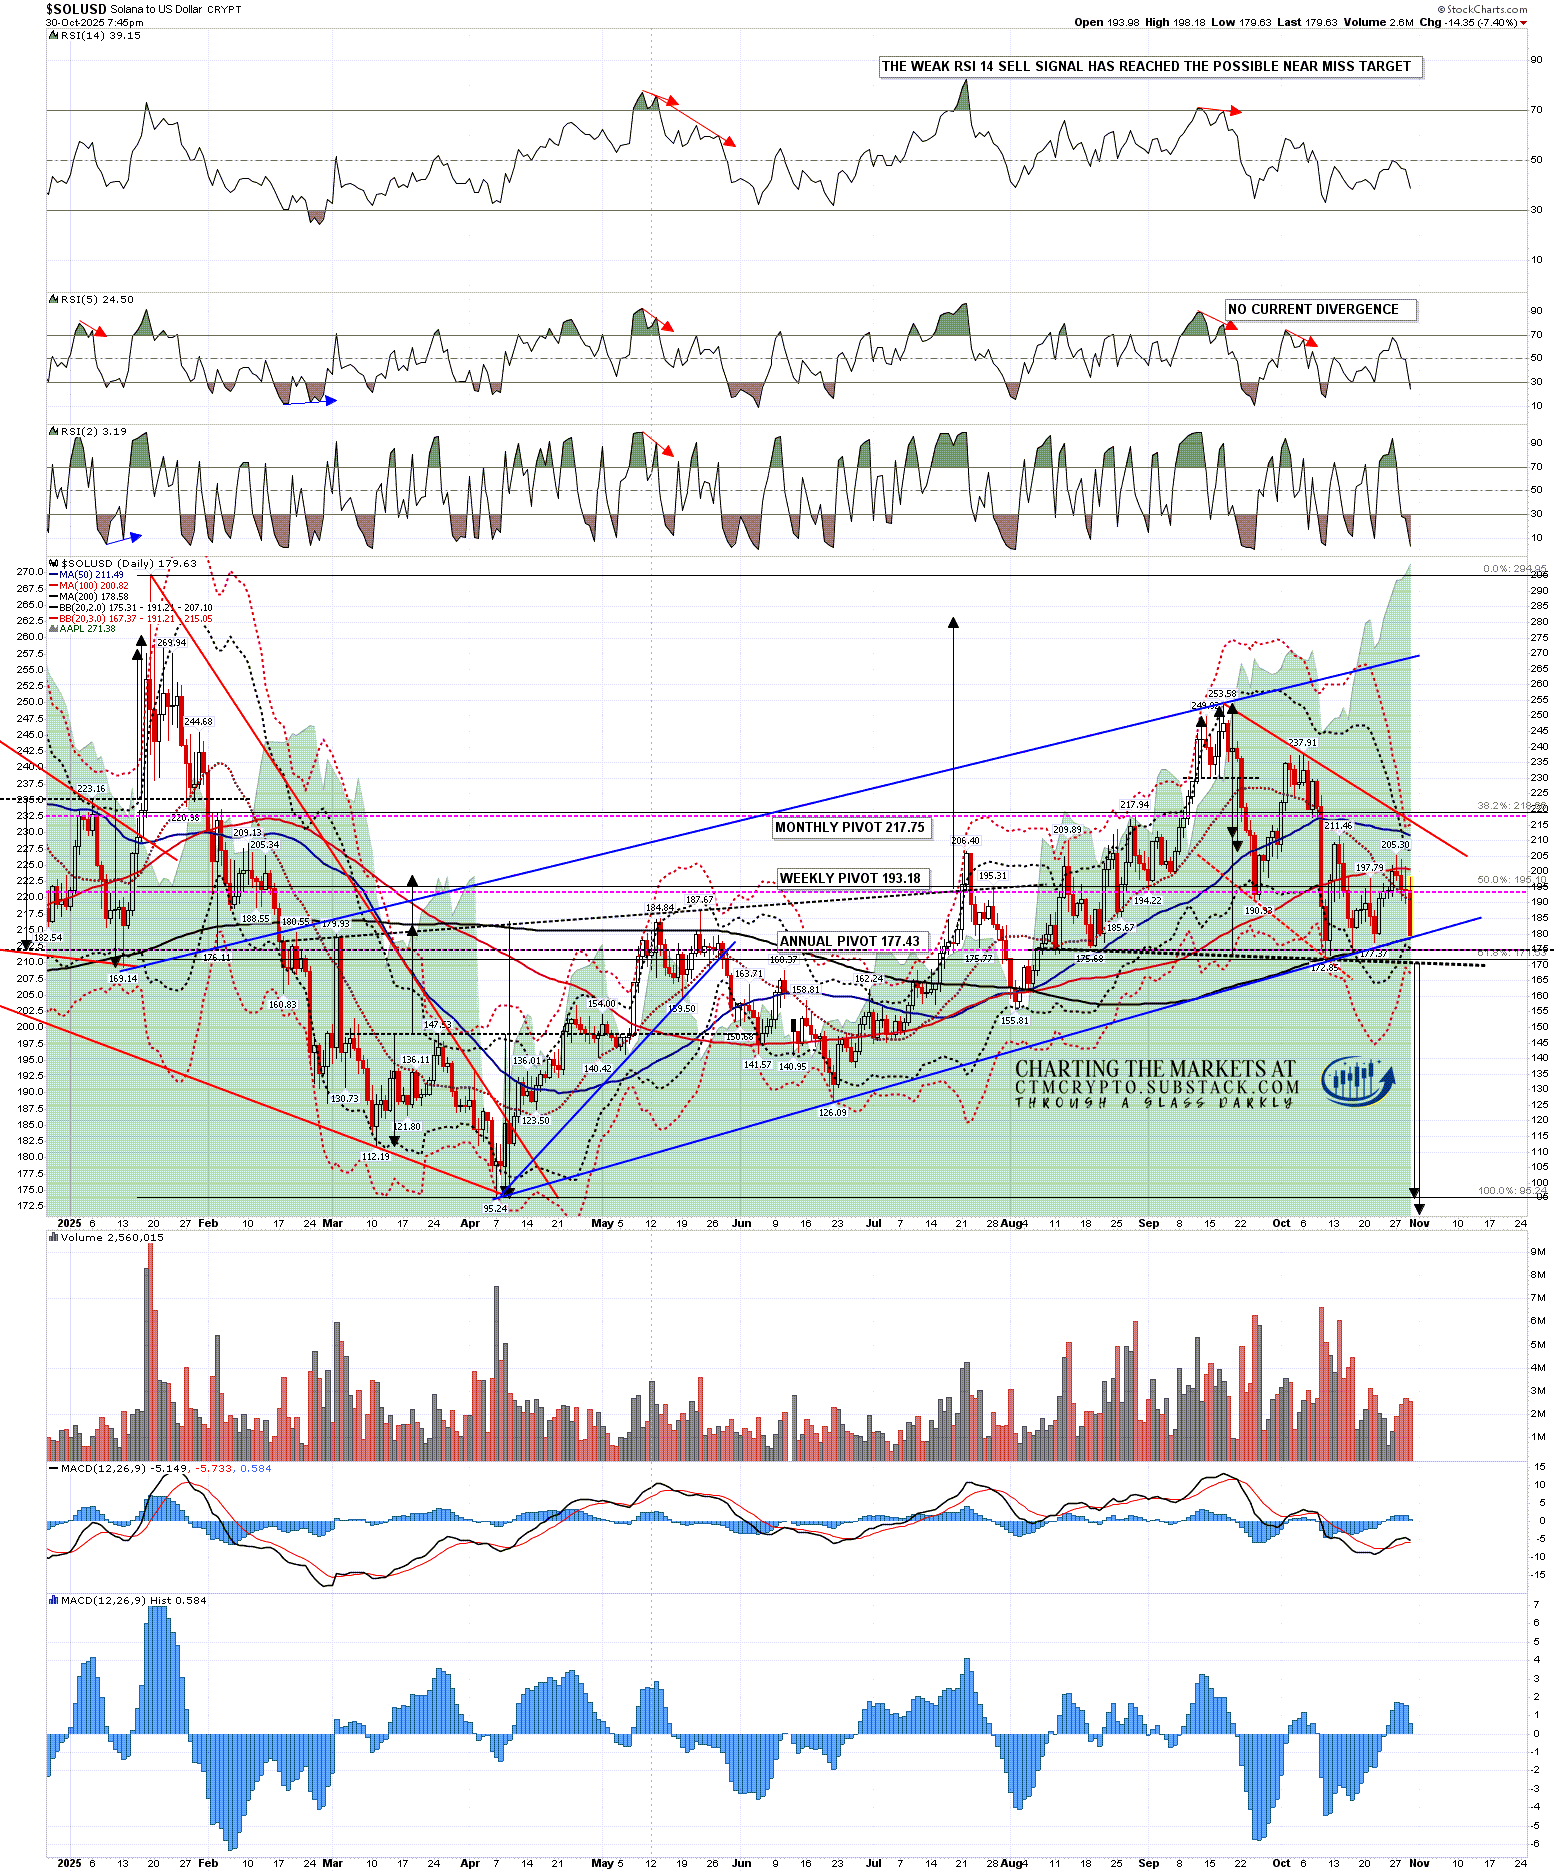
On the daily chart rising wedge support from the April low and the 200dma are currently in the 178.50 area. If that wedge support breaks then the odds that the bull market high on Solana has already been made increase considerably, but a short term double bottom may still be forming.

If Solana breaks down from this inflection point then on a sustained break below the H&S neckline at 170 the H&S target would be at a retest of the April low at 95.24. If Solana breaks up from this inflection point, then a sustained break up directly from here or lower, over the last rally high at 211.4k, would look for a retest of the September high at 253.58.

SOLUSD daily chart:

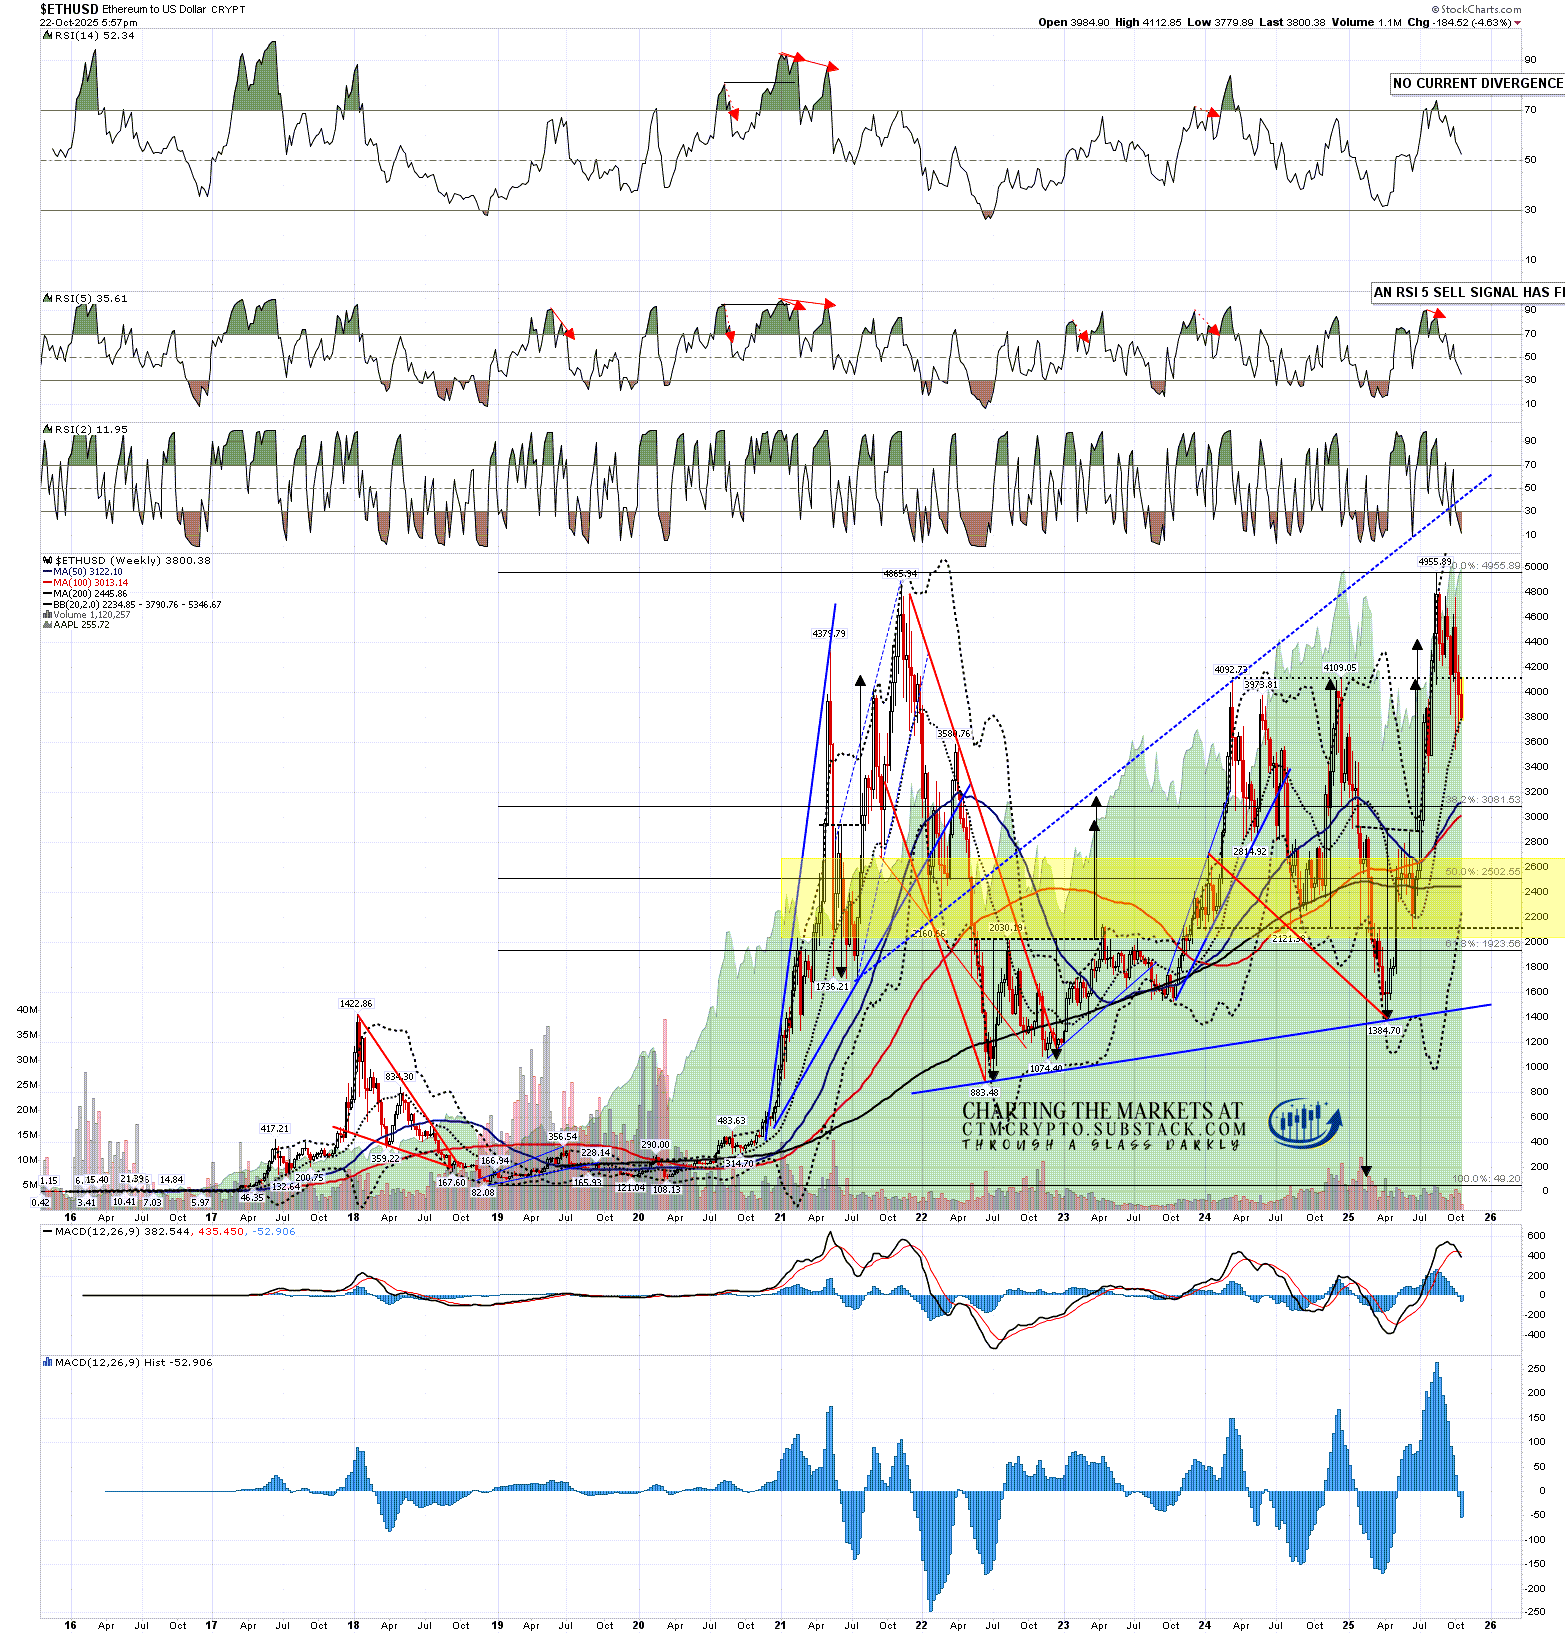
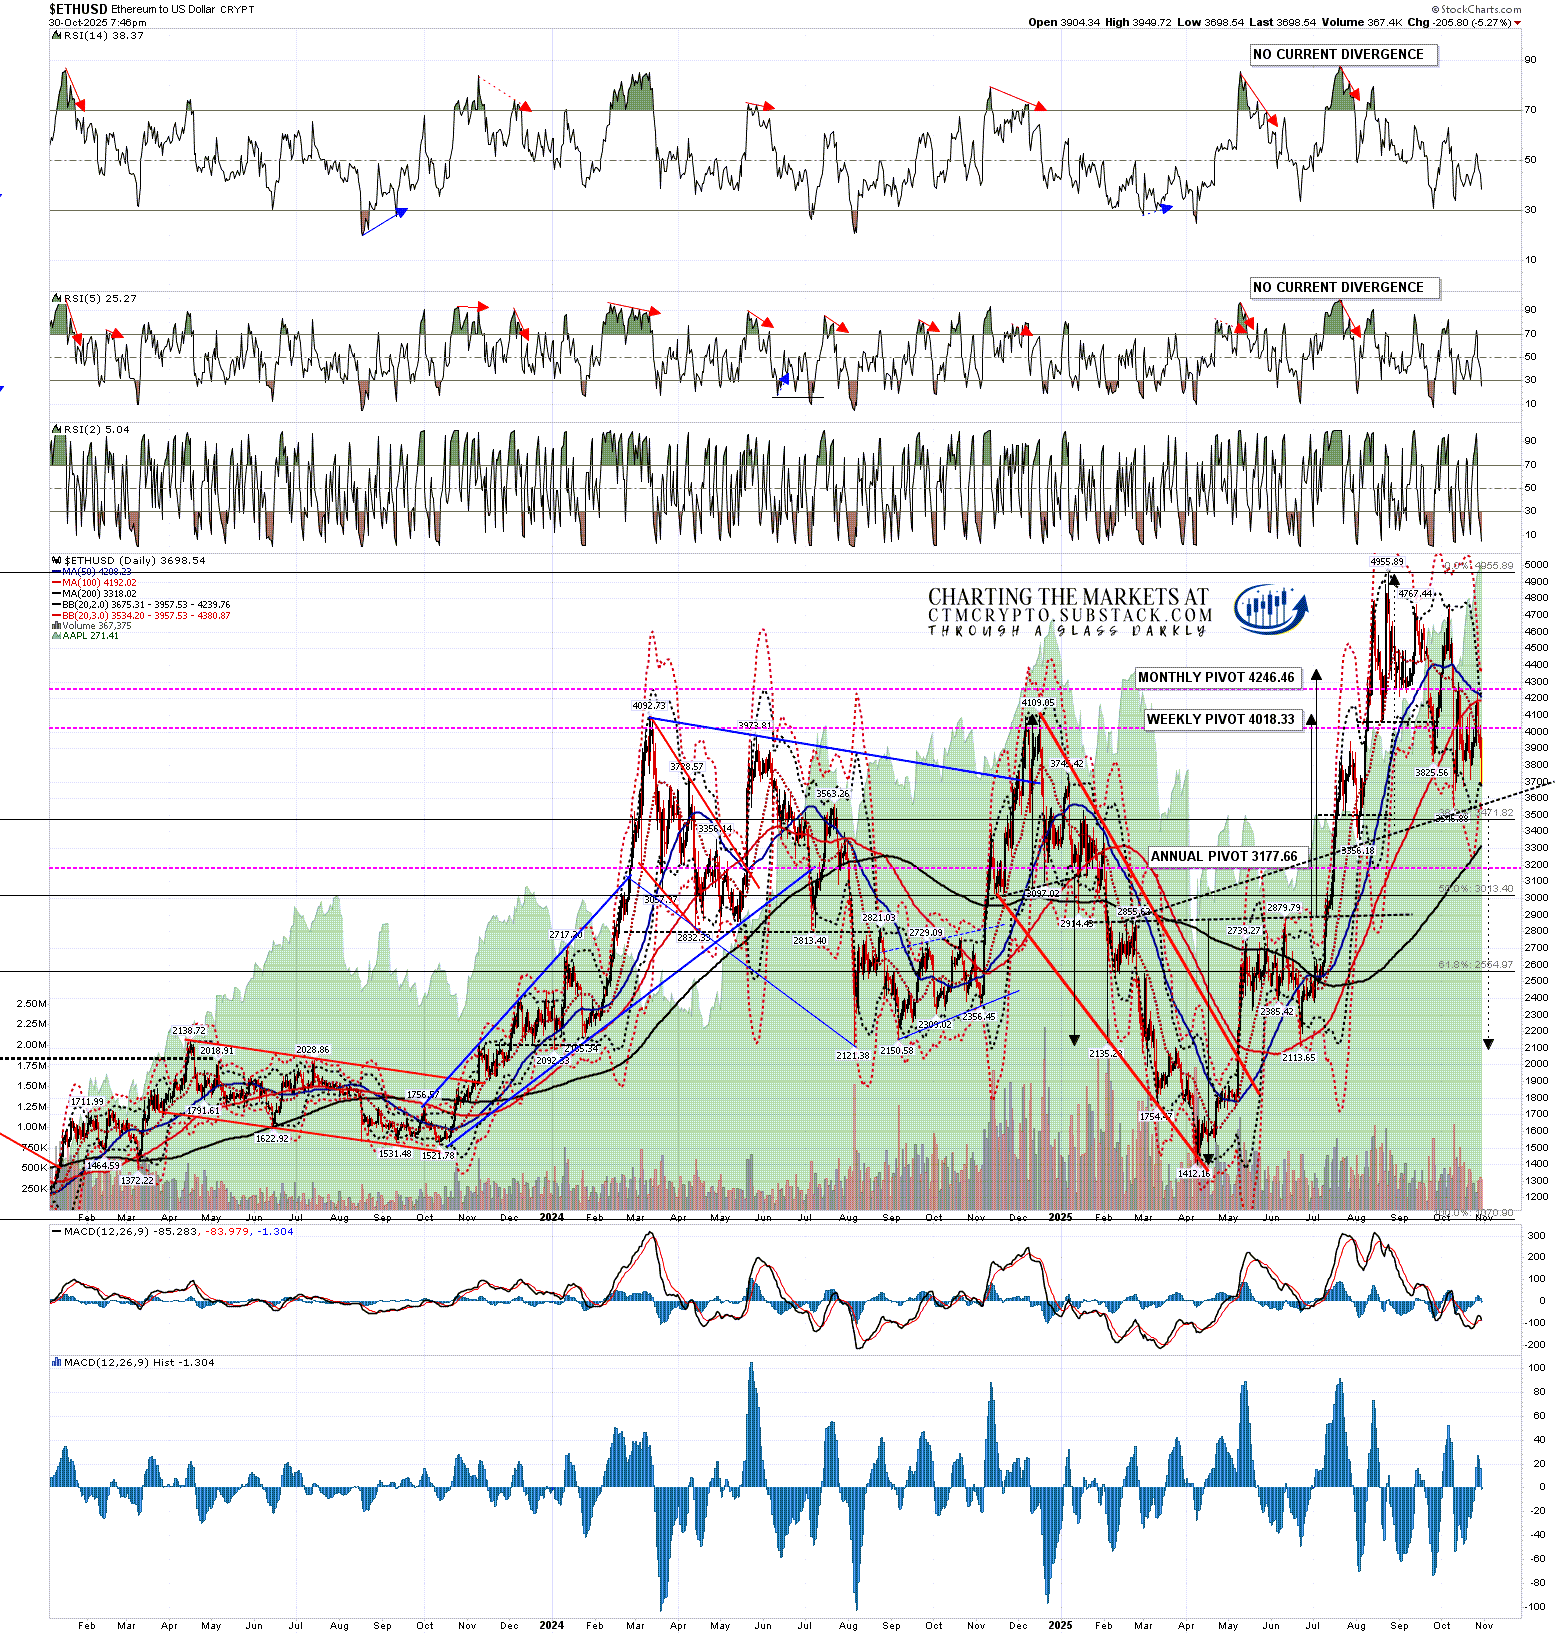
On Ethereum the weekly middle band has been tested as support every week for the last four weeks and has still not been broken on a weekly close basis. That’s currently at 3857.27. That is a big level on the weekly chart, with the other bigger level at the 50 week MA, currently at 3142.14. The 50 week MA on Ethereum was not broken until after the highs on the last two bull markets in early 2018 (on Ethereum, but in late 2017 on Bitcoin), and late 2021.

ETHUSD weekly chart:

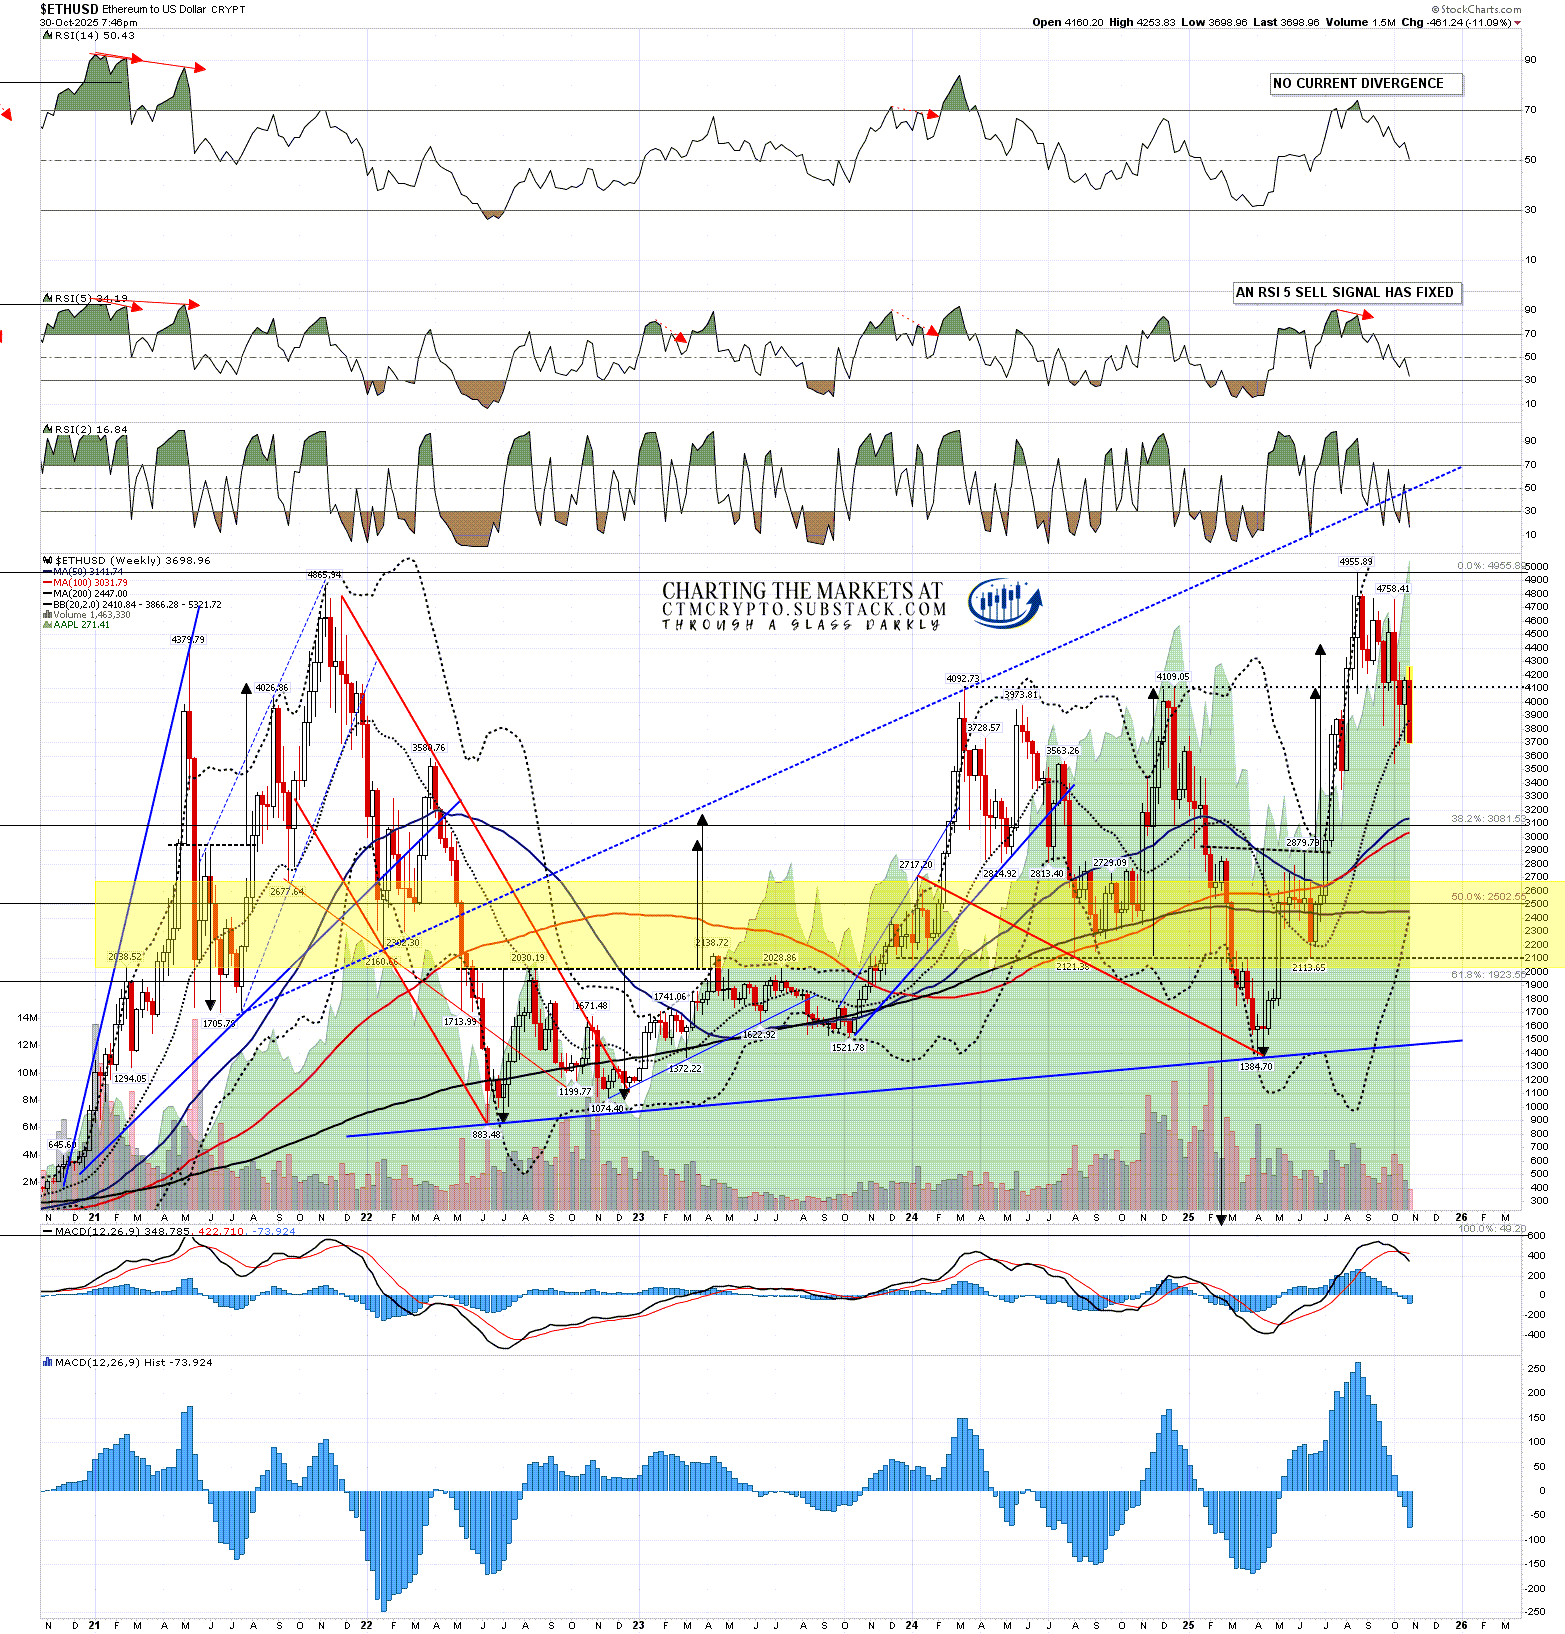
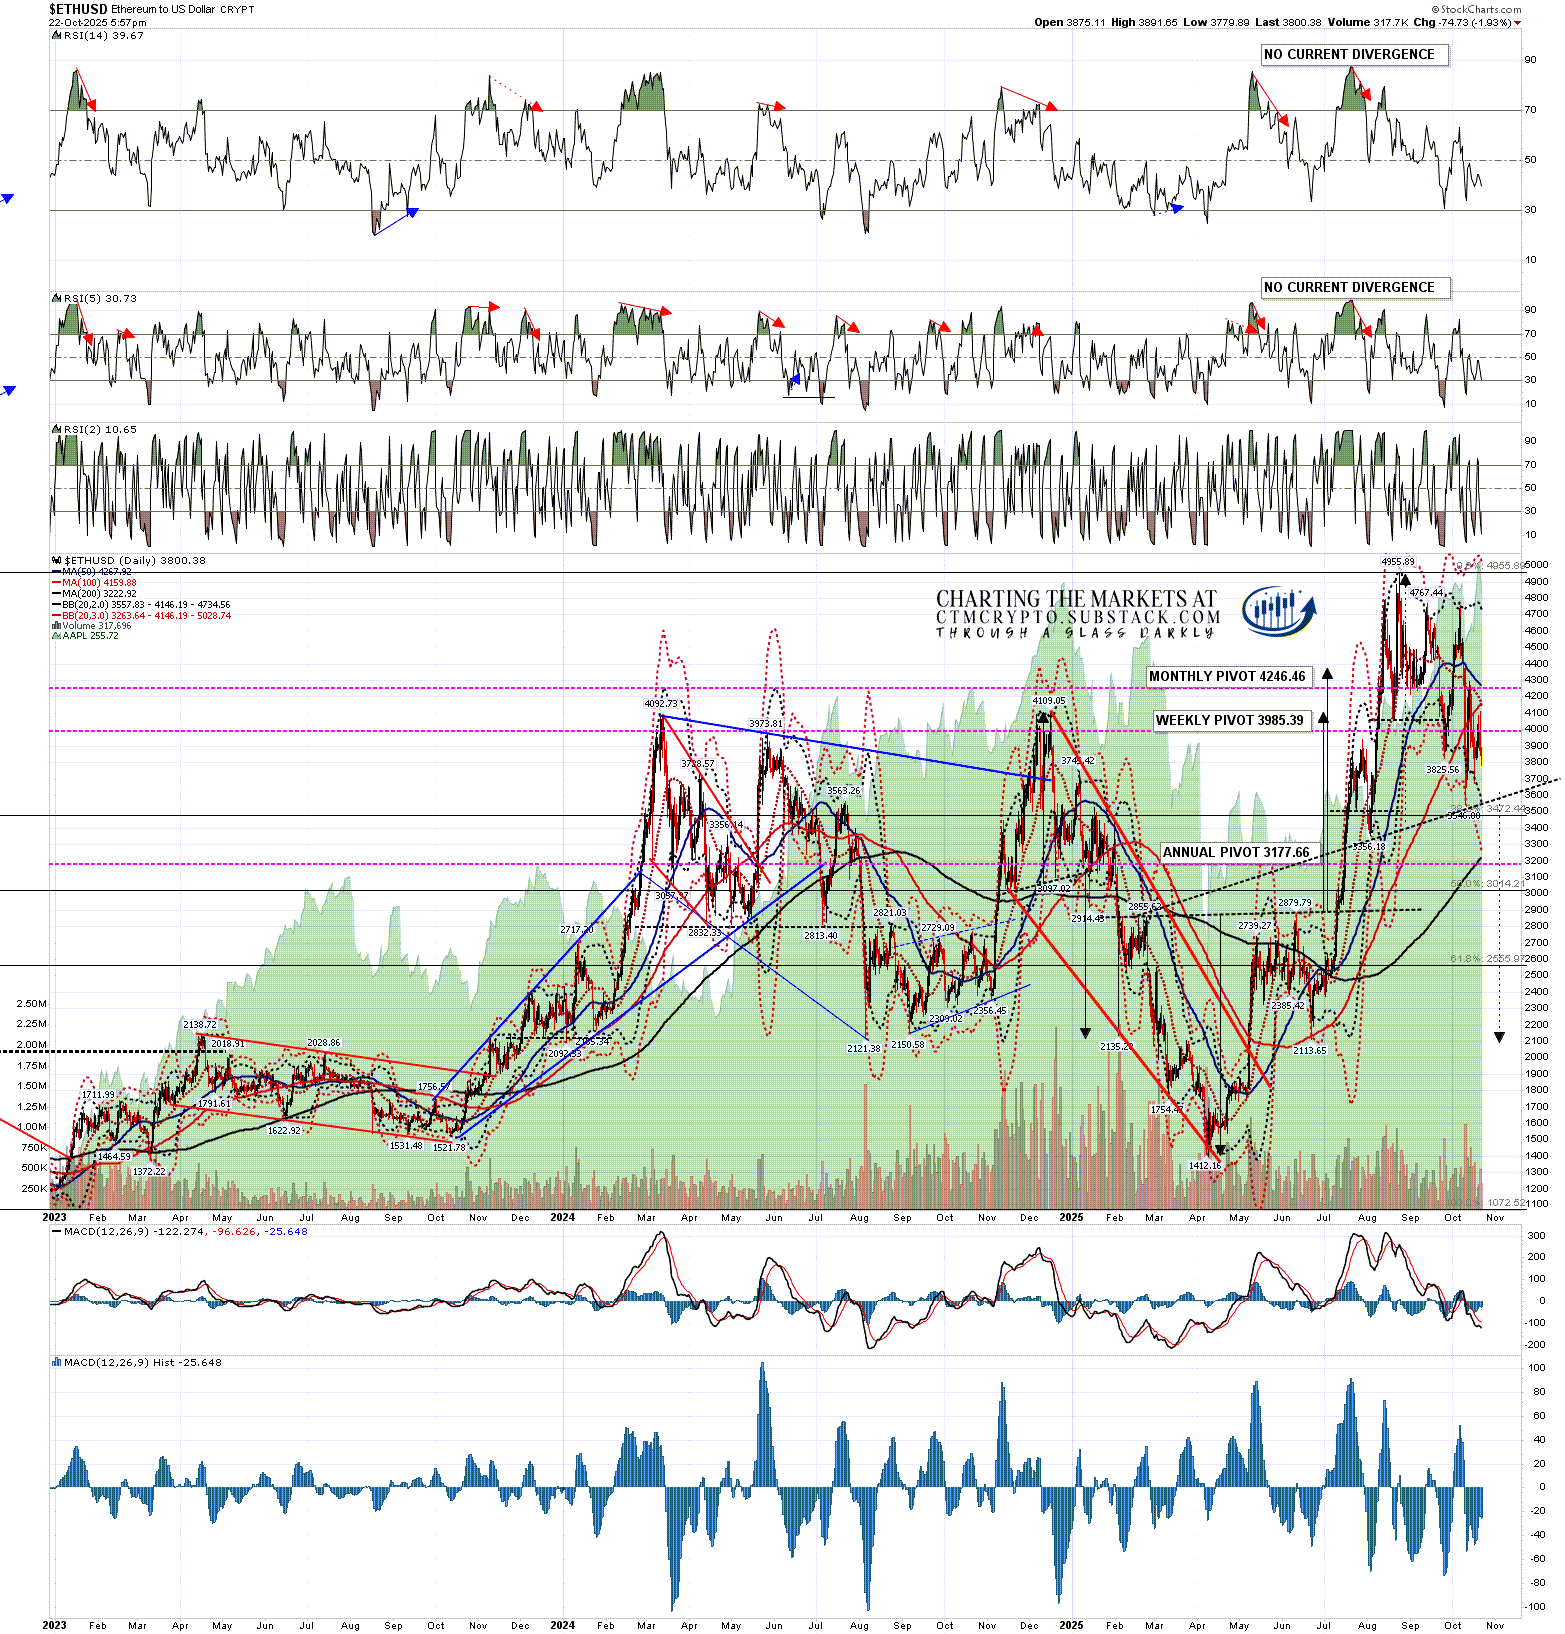
On the Ethereum daily chart the next big support is at the 200dma, currently at 3318.17. That’s been good support and is a decent match with the 50 week MA, so there is a big double support level in the 3100-3350 area.

If Ethereum breaks down from this inflection point then on a sustained break below the H&S neckline at 3600 the H&S target would be in the 2050 area. If Ethereum breaks up from this inflection point directly then there is no current bottoming pattern but if we see a retest of the recent low at 3546.88 then on a sustained break over the last rally high at 4253.83, I’d be looking for a retest of the all time high at 4955.89.

ETHUSD daily chart:

What’s the bottom line here? Well that we are seeing this inflection point now at all is suggesting that the bull market high is close, but then I’ve been talking about a high in the December 2025 area all year, and tomorrow is the last day of October.

Since I started doing daily videos on Crypto early last year I’ve got Crypto direction right most of the time and more so than any other analyst anywhere that I’m aware of. I’m a very good analyst and all three of these instruments are very classical chartist friendly. I’m not much of a marketer though, and the free Crypto substack I set up last August still has less than 200 readers. I’d like to increase that readership and invite any suggestions on how I could do that.

If you’d like to see more of these posts please subscribe for free to my Crypto substack. I also do a premarket video every day on Crypto at 9.05am EST with morning charts for paying subscribers. All the videos I record are posted shortly afterwards on my Youtube channel, and every post I publish is linked on my twitter.

Tuesday, 28 October 2025

Overthrowing The Rising Wedges

In my last post on 24th October I was looking at rising wedges on SPX, QQQ, DIA and IWM from the April lows and weighing the odds of these breaking down into a substantial retracement in the near future.

For SPX, QQQ and DIA I was looking at possible upside targets if they went higher, which they have, but not on IWM where I was just looking for a possible high retest, which we have not quite seen yet.

Looking at the rising wedge on SPX the rising wedge resistance has been hit, and I have redrawn the wedge support through the last low as this means that the wedge has expanded, and has therefore not yet broken down. The high at the time of writing is breaking slightly over the high quality rising wedge resistance and this may be a bearish overthrow.

As I mentioned in my last post, this move has eliminated the double top setup but may still be an H&S forming.

SPX 60min chart:

Looking at the rising wedge on QQQ the first rising wedge resistance I showed has been hit and broken, and I have redrawn the wedge support through the last low as this means that the wedge has expanded. The high at the time of writing could be a bearish overthrow.

I posted a possible alternate wedge resistance trendline and that is now in the 834/5 area and may be hit next. If so, that would become the main wedge resistance trendline.

This move has eliminated the double top setup but may still be an H&S forming.

QQQ 60min chart:

Looking at the rising wedge on DIA the first rising wedge resistance I showed has been hit and broken, and I have redrawn the wedge support through the last low as this means that the wedge has expanded. The high at the time of writing could be a bearish overthrow.

I also posted a possible alternate wedge resistance trendline on DIA and that is now in the 484 area and may be hit next. If so, that would become the main wedge resistance trendline.

This move has eliminated the double top setup but may still be an H&S forming.

DIA 60min chart:

Looking at the rising wedge on IWM I was wondering about a high retest there and we almost saw one yesterday, but not quite. That may still need a retest.

IWM 60min chart:

So how is this looking now? Well the first thing to say is that all of SPX, QQQ and DIA have hit wedge resistance trendlines and may be overthrowing those bearishly. All are looking very short term overbought on the hourly RSIs.

On the SPX, QQQ and DIA daily charts they have also all hit or come very close to their 3sd upper bands this week, so we would usually see a period of consolidation or retracement over the next few days.

SPX daily chart:

I’m expecting to see at least some retracement or consolidation from this area. There is a case for a bit higher short term on QQQ, DIA and IWM, but after that at least a period of consolidation looks likely. In the short term I’m seeing hourly sell signals fixed or brewing on ES, NQ and YM that are generally a reliable signal of a short term high forming. There is also a historically bearish leaning day tomorrow.

Against a more substantial retracement here we have no current reversal patterns on SPX, QQQ and DIA, though H&S patterns may be forming. There are no current hourly RSI 14 or daily RSI 5 sell signals fixed or brewing on any of these four RTH indices.

We are now also almost through October, with only three full trading days left. There are good reasons to see a significant decline in November, the ongoing government shutdown, possible failure of trade negotiation with China, or the generally fragile state of the US economy, but November and December are still historically two of the most bullish months of the year, and all year I’ve been looking for a significant high on both equities and Crypto being made in or close to December.

The chart below shows the average daily price performance of the S&P 500 from 1928-2024. The average Santa rally starts on 27th October and over that period the average rise into the end of the year has been over 3%:

If we are seeing a break higher here then we would need to see some sustained breaks over the wedge resistance trendlines from the April lows, but that seems unlikely to start from here, and I am doubtful about that happening at all. These are high quality patterns and they have not delivered any meaningful retracement yet. We might instead see a slower move that just expands these wedges to the upside somewhat instead, though the higher probability resistance trendlines for these are the ones we have been testing here. Higher trendlines beyond would be harder to identify. At minimum we should see some consolidation from the current area.

The historical stats for the rest of this week are bearish on Wednesday, bullish on Thursday and neutral on Friday. For next week, the first trading week of November, Monday through Friday all lean bullish with the exception of Wednesday. There is only one bearish leaning day in November and only two in December, one of which is the last trading day of 2025.

If you like my analysis and would like to see more, please take a free subscription at my chartingthemarkets substack, where I publish these posts first. I also do a premarket video every day on equity indices, bonds, currencies, energies, precious commodities and other commodities at 8.45am EST, but only for paying subscribers. Other places to find me are my twitter, and my Youtube channel.

Friday, 24 October 2025

So Here We Are Again

In my post on Monday 6th October I was looking at the negative divergences on SPX and QQQ, with daily RSI 14 and RSI 5 sell signals brewing on both of those. All of those fixed on Friday 10th October, with both RSI 5 sell signals also reaching target on that Friday.

In my next post on Tuesday 14th October I was noting that there were now daily RSI 14 sell signals fixed on SPX, QQQ, DIA and (weaker signal) IWM. I was saying then that was suggesting a larger retracement soon to reach those targets.

I was also looking at possible topping patterns forming on SPX, QQQ, DIA and IWM then and saying that those would likely break down or reject back up to the highs in what might then be the second highs on a series of double tops.

In my post on Friday 17th October I was noting the still decent looking topping patterns on US indices and talking about the market risks from the ongoing government shutdown and the possible escalation of the trade war with China. The Kalahi odds I showed then were at a total government shutdown length at 39.8 days. At the time of writing a week later they are now at 44.3 days.

I was also looking at the important test taking place at the 45dma on SPX, holding so far, and the historical stats for this week, which have delivered perfectly so far, with a bearish leaning Wednesday into a bullish leaning Thursday and Friday.

In my last post on Monday 20th October I was looking at the very high quality rising wedges formed from the April lows on SPX, QQQ and IWM and the decent quality rising wedge on DIA, and noting that these are all supporting a possible intermediate high forming here and a possible more impressive retracement from this area in the near future.

So here we are, SPX, QQQ and DIA all recovered over their daily middle bands all recovered over their daily middle bands and have retested their all time highs and this is the nicest looking topping setup that I have seen on US equity indices since the ones I was looking at the February highs in my post on Wednesday 19th February.

Those February topping patterns all more than made target of course. Is that going to happen here? Who can say? The only way ever to know for sure is to wait and see what happens, but the setup is certainly very nice, and to add to the uncertainties about the government shutdown and negotiations with China, we have now in the last few days had the first real signs of weakness in the AI Tech frenzy, and possible speculative bubble, which has underpinned most of the rise in US equities since the April low. That may mean that a much bigger high is forming here, and that a smaller high here would be just part of that larger high forming.

Looking at SPX a new all time high has been made today and a good quality double top is now forming. If that breaks down then the target area would be in the 6300-40 range. There is a good support level and possible H&S neckline in the 6200 area.

On the upside, SPX could go higher if an H&S is forming rather than a double top, but I’d note that if the resistance trendline above is hit, currently in the 6850 area, then the rising wedge would have expanded and I would redraw the rising wedge support trendline through the most recent low. I’d still be looking for strong resistance at that trendline above and a top might still be forming.

SPX hourly chart:

Looking at QQQ a new all time high has been made today and a good quality double top is now forming. If that breaks down then the target area would be in the 558-63 range. There is a good support level and possible H&S neckline in the 558 area, which is a strong match with the lower target.

On the upside, QQQ could go higher if an H&S is forming rather than a double top, but I’d note that if the resistance trendline above is hit, currently in the 621 area, then the rising wedge would have expanded and I would redraw the rising wedge support trendline through the most recent low. I’d still be looking for strong resistance at that trendline above or at an even better quality alternate rising wedge resistance trendline that is currently in the 626-8 area.

QQQ 60min chart:

Looking at DIA a new all time high was made a few days ago and another was made today. A good quality double top is now forming. If that breaks down then the target area would be in the 435-437.5 range. There is a good support level and possible H&S neckline in the 432 area.

On the upside, DIA could go higher if an H&S is forming rather than a double top, but I’d note that if the resistance trendline above is hit, currently in the 477 area, then the rising wedge would have expanded and I would redraw the rising wedge support trendline through the most recent low. I’d still be looking for strong resistance at that trendline above or at an even better quality alternate rising wedge resistance trendline that is currently in the 479-80 area.

DIA 60min chart:

Looking at IWM a new all time high was made last week and another may be made soon. A decent quality double top is now forming. If that breaks down then the target area would be in the 222.5-227.5 range.

On the upside, IWM could go higher if an H&S is forming rather than a double top, but I’d note that if the resistance trendline above is hit, currently in the 255.5 area, then the rising wedge would have expanded and I would redraw the rising wedge support trendline through the most recent low. I’d still be looking for strong resistance at that trendline above or at an even better quality alternate rising wedge resistance trendline that is currently in the 257 area.

IWM 60min chart:

Overall this is a nice looking topping setup, the market backdrop looks promising, and I think this has a good chance of delivering.

The historical stats for next week are also encouraging as they are bearish on Monday, neutral on Tuesday, bearish on Wednesday, bullish on Thursday and neutral on Friday. That gives a significant bearish lean at the start of next week though I would note that the rest of the week and the first week of November then lean strongly bullish.

In the next few days I’ll be looking at the pattern setup for a possible bigger picture high forming here in another post.

If you like my analysis and would like to see more, please take a free subscription at my chartingthemarkets substack, where I publish these posts first. I also do a premarket video every day on equity indices, bonds, currencies, energies, precious commodities and other commodities at 8.45am EST, but only for paying subscribers. Other places to find me are my twitter, and my Youtube channel.

Wednesday, 22 October 2025

The Bull Market in Crypto Could Be Over

In my last post on Tuesday 14th October I was looking at the double top that had just broken down on Bitcoin. I was leaning towards this rejecting back up to the highs along with equities, but that high retest has been playing out on equities without any meaningful participation so far from Bitcoin (BTCUSD), Solana (SOLUSD), or Ethereum (ETHUSD). Last week Bitcoin actually broke and closed below the weekly middle band, in what was a significant support break.

This is bearish and the odds of that double top on Bitcoin playing out have risen considerably. If that double top plays out then there will likely also be serious further support breaks on Solana and Ethereum of a kind that would suggest that the bull market may have already ended on both, and possibly all three. This is what I wrote at the end of my last post:

‘If Bitcoin does reach the double top target would the bull market be over? No, but it would increase the chance that it might be. I would still be leaning towards at least a retest of the all time high from there but that might be forming a double top that could end this bull market cycle. There would also likely be some serious technical damage done on Ethereum and Solana while that played out.’

The problem is that Crypto is still closely directionally tied to equities and on equities I was only really looking for a retest of the all time highs on SPX and QQQ, which I’m thinking will likely happen by the close on Friday, before a fail into a larger retracement. If seen that might well then fail into a larger retracement matching the one forming on Bitcoin and the others here. If you’re interested I was looking at this in my equities post on Monday 20th October.

I’d still be then looking for a last leg up into December on Bitcoin, and likely equities too, but that might well just be to make the second high on a larger Bitcoin double top to finish the bull market there. I would note that the last two bull market highs on Bitcoin were in December 2017 and November 2021, close to the end of the year and four years apart, so the end of 2025 is the obvious period to be looking for an end to the current bull market.

On the Bitcoin weekly chart, as I mentioned, support at the weekly middle band, currently at 113,125, was lost last week and that was backtested as resistance at the high this week. If this week closes below then that support break will be confirmed.

There is another big area on the weekly chart at the 50 week MA, currently at 102,354 and that is historically very good support during bull markets, such good support in fact that it was only broken after the highs of the last two bull markets had been made.

BTCUSD weekly chart:

On the daily chart Bitcoin is testing the 200dma, currently at 108,158, as support. That has been broken three times since the start of 2024, for periods ranging from two weeks to two months. Still a big support level though, and strong breaks below this and the 50 week MA would clear the path for Bitcoin to reach the double top target in the 88.3k to 90k area.

BTCUSD daily chart:

On Solana the weekly middle band has still not been broken on a weekly close basis and that may still hold as support. That’s currently at 187.75, and just above the 50 week MA at 183.08. That 50 week MA was again only broken after the last bull market high in Q3 2021. These are the two big levels on the weekly chart and the only other big level on this chart is the 200 week MA, which was tested at the 2025 low, and is currently at 101.95.

SOLUSD weekly chart:

On the Solana daily chart the big support is at the 200dma, currently at 175.49. That is a strong support level that broke hard in February before Solana almost halved from that break into the low at 95.24. The only other big support on the daily chart is rising support from that 95.24 low, currently in the 176 area and currently unbroken. That is strong double support.

In terms of the pattern setup here that rising support trendline is the support trendline on a large and high quality rising wedge from that low, so a break below would also be a serious break for that reason.

On the bull side there is an IHS that broke up in July with a target in the 282/3 area, but there is also now a possible H&S forming here that on a break below the neckline in the 170 area would have a target at a retest of the March low at 95.24. A break below 126.09 would invalidate the bullish IHS, and a break below the March low at 95.24 would likely mean that this bull market high in Solana was likely made in January at 294.95.

One thing I would mention that I have said many times over the years is that when an H&S or IHS pattern fails, it is very often after a similar pattern has formed in the other direction. That would obviously be the case here.

SOLUSD daily chart:

On Ethereum the weekly middle band has still not been broken on a weekly close basis and that may still hold as support. That’s currently at 3792.57. That is a big level on the weekly chart, with the other big level at the 50 week MA, currently at 3122.85. The 50 week MA was not broken until after the highs on the last two bull markets in early 2018 (on Ethereum, but in late 2017 on Bitcoin), and late 2021.

ETHUSD weekly chart:

On the Ethereum daily chart the next big support is at the 200dma, currently at 3223.06. That’s been good support and is a decent match with the 50 week MA, so there is a big double support level in the 3100-3250 area.

In term of the pattern setup there isn’t an obvious overall pattern but I’ll be watching rising support from the April low at 1384.70, and that trendline is currently in the 3250 area (but rising), so in effect there is overall a very strong triple support level in the 3100-3300 range.

The bullish IHS that was also on the Ethereum chart made target in August, so that is no longer an issue. As with Solana a possible H&S is forming and on a sustained break below the H&S neckline at 3600 the target would be in the 2100 area. If that target was to be hit then this bull market high in Ethereum was likely made in August at 4955.89.

ETHUSD daily chart:

What’s the bottom line here? The odds that bull market in Crypto is topping out on Bitcoin and already over on Solana and Ethereum have risen considerably over the last two weeks. All of them are testing big support levels at the moment and if those levels break then the odds will rise a lot more. We’ll see.

Since I started doing daily videos on Crypto early last year I’ve got Crypto direction right most of the time and more so than any other analyst anywhere that I’m aware of. I’m a very good analyst and all three of these instruments are very classical chartist friendly. I’m not much of a marketer though, and the free Crypto substack I set up last August still has less than 200 readers. I’d like to increase that readership and invite any suggestions on how I could do that.

If you’d like to see more of these posts and the other Crypto videos and information I post, please subscribe for free to my Crypto substack. I also do a premarket video every day on Crypto at 9.05am EST. If you’d like to see those I post the links every morning on my twitter, and the videos are posted shortly afterwards on my Youtube channel.

Monday, 20 October 2025

High Quality Patterns from the April Low

I’ve been having a very careful look over the weekend at the longer and shorter term patterns on the main US equity indices to assess the odds of a high forming here and today I’m going to be looking at the patterns from the April low, which are now looking as good or better than they did in early August.

First though, the rally on Friday from the lows was decent, but failed again to close back over the daily middle band, which closed Friday at 6674.42. That was tested as resistance every day last week and if it continues to hold as resistance then we will likely soon see a break below the 50dma, currently at 6565 and which held as support last week.

If we see that break down then the topping patterns I was looking at in my post on Friday will start to break down and may well then make the targets that I was looking at.

SPX daily chart:

On SPX there is now a very high quality rising wedge from the April low. If this is now topping out for a retracement then a 50% retracement of that move would be in the 5800 area. The topping pattern to deliver that retest though has not yet formed and might well involve further retests of the all time high as it formed.

SPX 60min chart:

On QQQ there is now also a very high quality rising wedge from the April low. If this is now topping out for a retracement then a 50% retracement of that move would be in the 508 area. The topping pattern to deliver that retest though has not yet formed and might well involve further retests of the all time high as it formed.

QQQ 60min chart:

On DIA there is now also a fair quality rising wedge from the April low. If this is now topping out for a retracement then a 50% retracement of that move would be in the 417 area. The topping pattern to deliver that retest though has not yet formed and might well involve further retests of the all time high as it formed.

DIA 60min chart:

On IWM there is now also a high quality rising wedge from the April low. If this is now topping out for a retracement then a 50% retracement of that move would be in the 212 area. The topping pattern to deliver that retest though has not yet formed and might well involve further retests of the all time high as it formed.

IWM 60min chart:

This looks promising for at least an intermediate high forming here, though I would note that these rising wedges often break up briefly as part of the topping process, and none of these have done that yet.

Later this week I’ll be looking at the pattern setup for a possible bigger picture high forming here in another post.

In terms of the historical stats this week they are neutral today and tomorrow, lean bearish on Wednesday and lean bullish on Thursday and Friday. Overall a neutral week with a modestly bullish lean.

In terms of short term headwinds the government shutdown is continuing without any apparent negotiations to end it. There is serious talk of this continuing into Thanksgiving which would not be good for equity markets. There is also still a threatened trade war with China looming, that would start in earnest at the start of November which, if that goes ahead, would also not be good for equity markets. There is a serious risk of either of both of these triggering a much larger retracement than we have already seen.

If you like my analysis and would like to see more, please take a free subscription at my chartingthemarkets substack, where I publish these posts first. I also do a premarket video every day on equity indices, bonds, currencies, energies, precious commodities and other commodities at 8.45am EST, but only for paying subscribers. Other places to find me are my twitter, and my Youtube channel.

Friday, 17 October 2025

Still Some Decent Looking Topping Patterns Here

In my post on Monday 6th October I was looking at the negative divergences on SPX and QQQ, with daily RSI 14 and RSI 5 sell signals brewing on both of those. All of those daily sell signals fixed last Friday, with both RSI sell signals also reaching target on Friday. There are now daily RSI 14 sell signals fixed on all of SPX, QQQ, DIA and (weaker signal) IWM. This is suggesting a larger retracement soon to reach those targets.

I was also saying then that until we saw some strong breaks below the daily middle bands on US indices they remained in a strong uptrend from the April low. On Friday they all broke hard below their daily middle bands. Since then SPX and DIA have backtested the daily middle bands but failed to break above, and QQQ and IWM have broken back above but are currently back below at the time of writing. Unless that changes that larger retracement may already be in progress.

In my post on Monday 13th October I was looking at Friday’s decline and weighing the short term risk to equity markets of the China trade disputes and the government shutdown.

On the China dispute I was saying that China clearly held the much stronger negotiating position due to their control of the vitally important rare earths market, so the US was likely to be keen to make a deal, but so far there’s little sign of that on the US side and tariffs are still scheduled to be raised 100% on China at the end of this month as Trump threatens online that the US may stop buying chinese cooking oil (?). That seems akin to the US bringing a wok to a gunfight but if this escalates further that will likely impact markets.

There is another things to mention here. There is no current trade war with China from the US perspective, but from China’s perspective they have now been in a trade war with the US for much of the year, with US tariffs on chinese goods already at an eye-watering minimum 57%. They want to bring that down, they feel that they have a strong hand in negotiations and objectively they’re right about that.

If the US imposes draconian further tariffs on China then they will likely dig in and wait it out. China doesn’t have to worry about elections, and they have already experiencing much of the pain from higher tariffs for much of this year. From the US perspective the shops may be looking thinly and very expensively stocked for Xmas, the main shopping event of the year, and voters may well get angry about that. If China cuts off rare earth exports to the US in retaliation then once current stocks run out, a lot of US manufacturing may also have to shut down.

On the government shutdown front that is also not looking great, with the last negotiations on ending this, if those can be described as negotiations, at the start of October. The chart below is from Kalshi today with even odds currently on the shutdown lasting another 39.8 days, past Thanksgiving.

If seen that would not only exceed the current record set by the second government shutdown in Trump’s first term at 35 days, but would also equal the total days of all other government shutdowns ever (only seen in their current form since 1980), excluding that last Trump shutdown, at 56 days. There’s a good page on these at wikipedia here, and this is also the first shutdown ever to happen when the same party controlled the White House and both houses of Congress.

None of this looks bullish short term.

Kalshi Government Shutdown Odds:

In my last post on Tuesday 14th October I was looking at the possible topping patterns forming on US indices and they are mostly still looking pretty good. I’ll review those but first I’ll show my SPX daily chart vs the 45dma. This is my reversion to the mean chart and the low on Friday was a close to perfect backtest of the 45dma. This is the second backtest since the break back above in late April and this is a very obvious level to reject back into high retests. We may still see this hold as support but a break below would be the first such break since the April low.

If we do see a significant break below the 45dma that may well be a sign that a larger top is near. I would suggest you look at the late 2022 high and the early 2025 high on the chart below as examples where a break below the 45dma was the first step in forming large double tops that then delivered a technical bear market decline of more than 20%.

SPX daily vs 45dma chart:

On SPX the H&S I posted on Tuesday as a possibility is still looking good. A sustained break below the neckline would look for a target in the 6325 area.

SPX 15min chart:

On QQQ the H&S I posted on Tuesday as a possibility is still looking good. A sustained break below the neckline would look for a target in the 564 area.

QQQ 15min chart:

On DIA the H&S I posted on Tuesday as a possibility is still looking good. A sustained break below the neckline would look for a target in the 438 area.

DIA 15min chart:

Every so often IWM follows a different path to the others and it did that this week, making a new all time high with confidence with a rare test at the high of the 3sd daily upper band. The double top setup I posted on Tuesday is gone, and while there may be a less good double top setup here it might also be a part-formed H&S. Some downside potential but no clear topping pattern.

IWM 15min chart:

It may be that none of these topping patterns break down, but if they do then there is also an obvious point of failure there where they could fail and reject back up to the highs. On sustained breaks down though, I’d be looking for those targets.

If we do see this larger retracement I’d still be looking for high retests afterwards, but those retests might then be making second highs on much larger double tops. Big highs are often preceded by a sharp retracement in a sequence I call ‘the low before the high’.

In terms of the historical stats today is opex and tends to be neutral. Looking into next week they lean neutral to bullish Monday and Tuesday, 61.9% bearish on Wednesday, 71.4% bullish on Thursday and 66.7% bullish on Friday. Overall a neutral week with a modestly bullish lean.

Everyone have a great weekend :-)

If you like my analysis and would like to see more, please take a free subscription at my chartingthemarkets substack, where I publish these posts first. I also do a premarket video every day on equity indices, bonds, currencies, energies, precious commodities and other commodities at 8.45am EST, but only for paying subscribers. Other places to find me are my twitter, and my Youtube channel.


Tuesday, 14 October 2025

Some Decent Looking Topping Patterns Here

In my post on Monday 6th October I was looking at the negative divergences on SPX and QQQ, with daily RSI 14 and RSI 5 sell signals brewing on both of those. All of those fixed on Friday, with both RSI sell signals also reaching target on Friday. There are now daily RSI 14 sell signals fixed on SPX, QQQ, DIA and (weaker signal) IWM. This is suggesting a larger retracement soon to reach those targets.

I was also saying that until we saw some strong breaks below the daily middle bands on US indices they remained in a strong uptrend from the April low. On Friday they all broke hard below their daily middle bands so are all now in a possible topping process for larger retracements than the ones we saw on Friday.

In my post yesterday I was looking at Friday’s decline, and the likely strong rally yesterday, and mentioned that there were already possible topping patterns forming that would not require a retest of the highs.

Those patterns have continued forming and are looking pretty good, so I’ll run through those today in case they break down into what might then become a much more significant pullback.

On the SPX daily chart yesterday’s rally backtested the daily middle band and has failed there so far. As long as that remains the case the downside is open.

I would mention that QQQ and IWM closed over their daily middle bands yesterday and if SPX and DIA can follow suit soon I’ll be leaning towards high retests across the board.

SPX daily chart:

The H&S setup is looking nice on SPX, with that mostly formed and close to breaking down at the low this morning. If it breaks down then the target would be in the 6325 area.

The low retest this morning also set up a possible double bottom that on a sustained break over yesterday’s high at 6555.07 would look for a retest of the all time high.

SPX 15min chart:

On QQQ there is another possible H&S forming that didn’t quite break down at the low this morning. If that should break down then the target would be in the 564 area.

Again a possible alternate double bottom may be forming, but the quality would be improved with a full retest of Friday’s low.

QQQ 15min chart:

On DIA there is a third possible and decent quality H&S forming. On a break down the H&S target would be in the 438.50 area.

On a break up over yesterday’s high the double bottom target would be in the 468.40 area.

DIA 15min chart:

On IWM there was already a high quality double top setup, though it could be evolving into an IHS. On a break down from here the IHS or full double top target would be in the 226.7 area.

No current bullish double bottom setup but if IWM retests Friday’s low then we’d have a decent looking double bottom setup with a target at a retest of the all time high.

IWM 15min chart:

Now it may be that none of these get as far as breaking down, but if they do then there is an obvious point of failure there where they could fail and reject back up to the highs. On sustained breaks down though, I’d be looking for these targets.

If we do see this larger retracement I’d still be looking for high retests afterwards, but those retests might then be making second highs on much larger double tops.

In terms of the historical stats this week they lean neutral to bullish today and tomorrow, 71% bullish on Thursday and neutral to bullish on Friday. Overall a neutral week with a modestly bullish lean.

If you like my analysis and would like to see more, please take a free subscription at my chartingthemarkets substack, where I publish these posts first. I also do a premarket video every day on equity indices, bonds, currencies, energies, precious commodities and other commodities at 8.45am EST, but only for paying subscribers. Other places to find me are my twitter, and my Youtube channel.