
I’ve been having a very careful look over the weekend at the longer and shorter term patterns on the main US equity indices to assess the odds of a high forming here and today I’m going to be looking at the patterns from the April low, which are now looking as good or better than they did in early August.
First though, the rally on Friday from the lows was decent, but failed again to close back over the daily middle band, which closed Friday at 6674.42. That was tested as resistance every day last week and if it continues to hold as resistance then we will likely soon see a break below the 50dma, currently at 6565 and which held as support last week.
If we see that break down then the topping patterns I was looking at in my post on Friday will start to break down and may well then make the targets that I was looking at.
SPX daily chart:
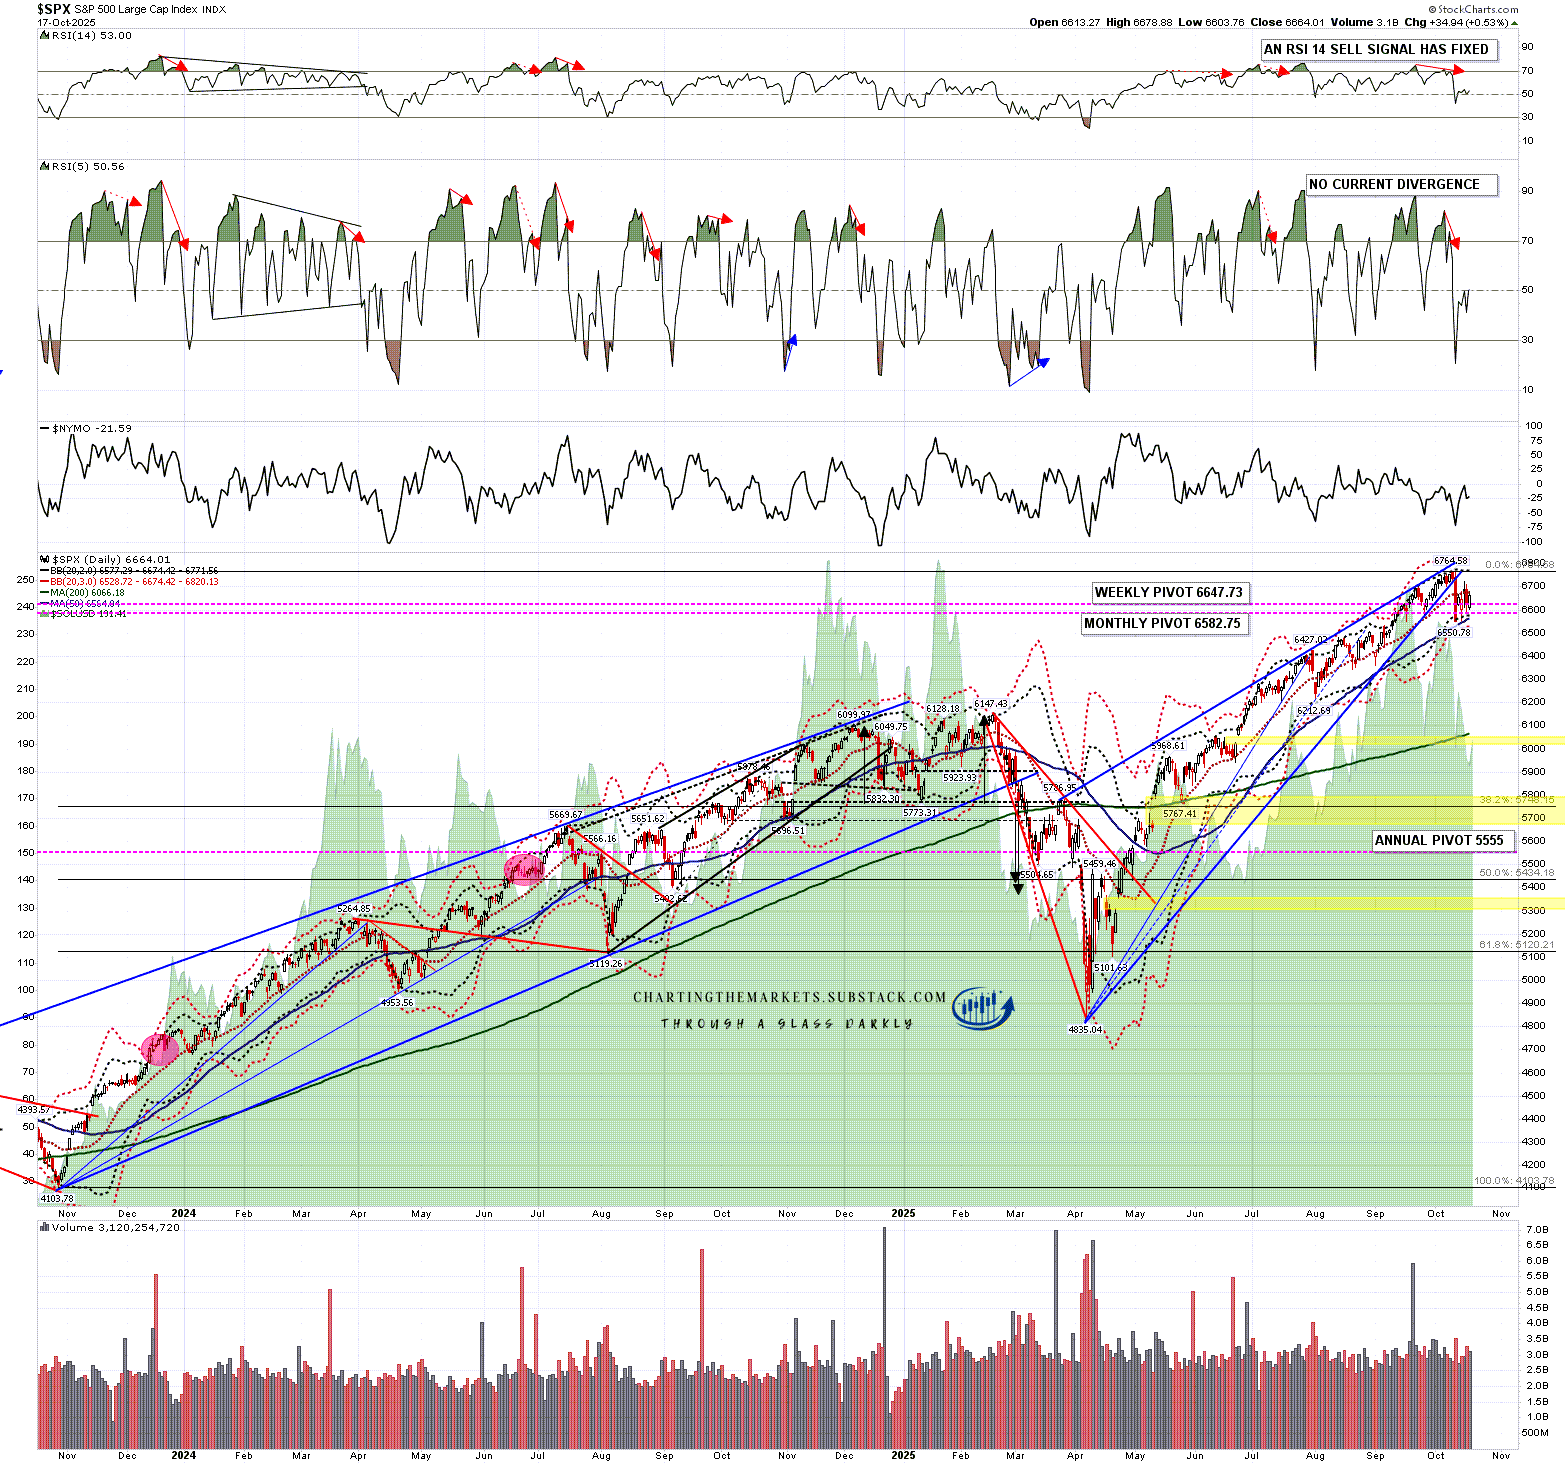
On SPX there is now a very high quality rising wedge from the April low. If this is now topping out for a retracement then a 50% retracement of that move would be in the 5800 area. The topping pattern to deliver that retest though has not yet formed and might well involve further retests of the all time high as it formed.
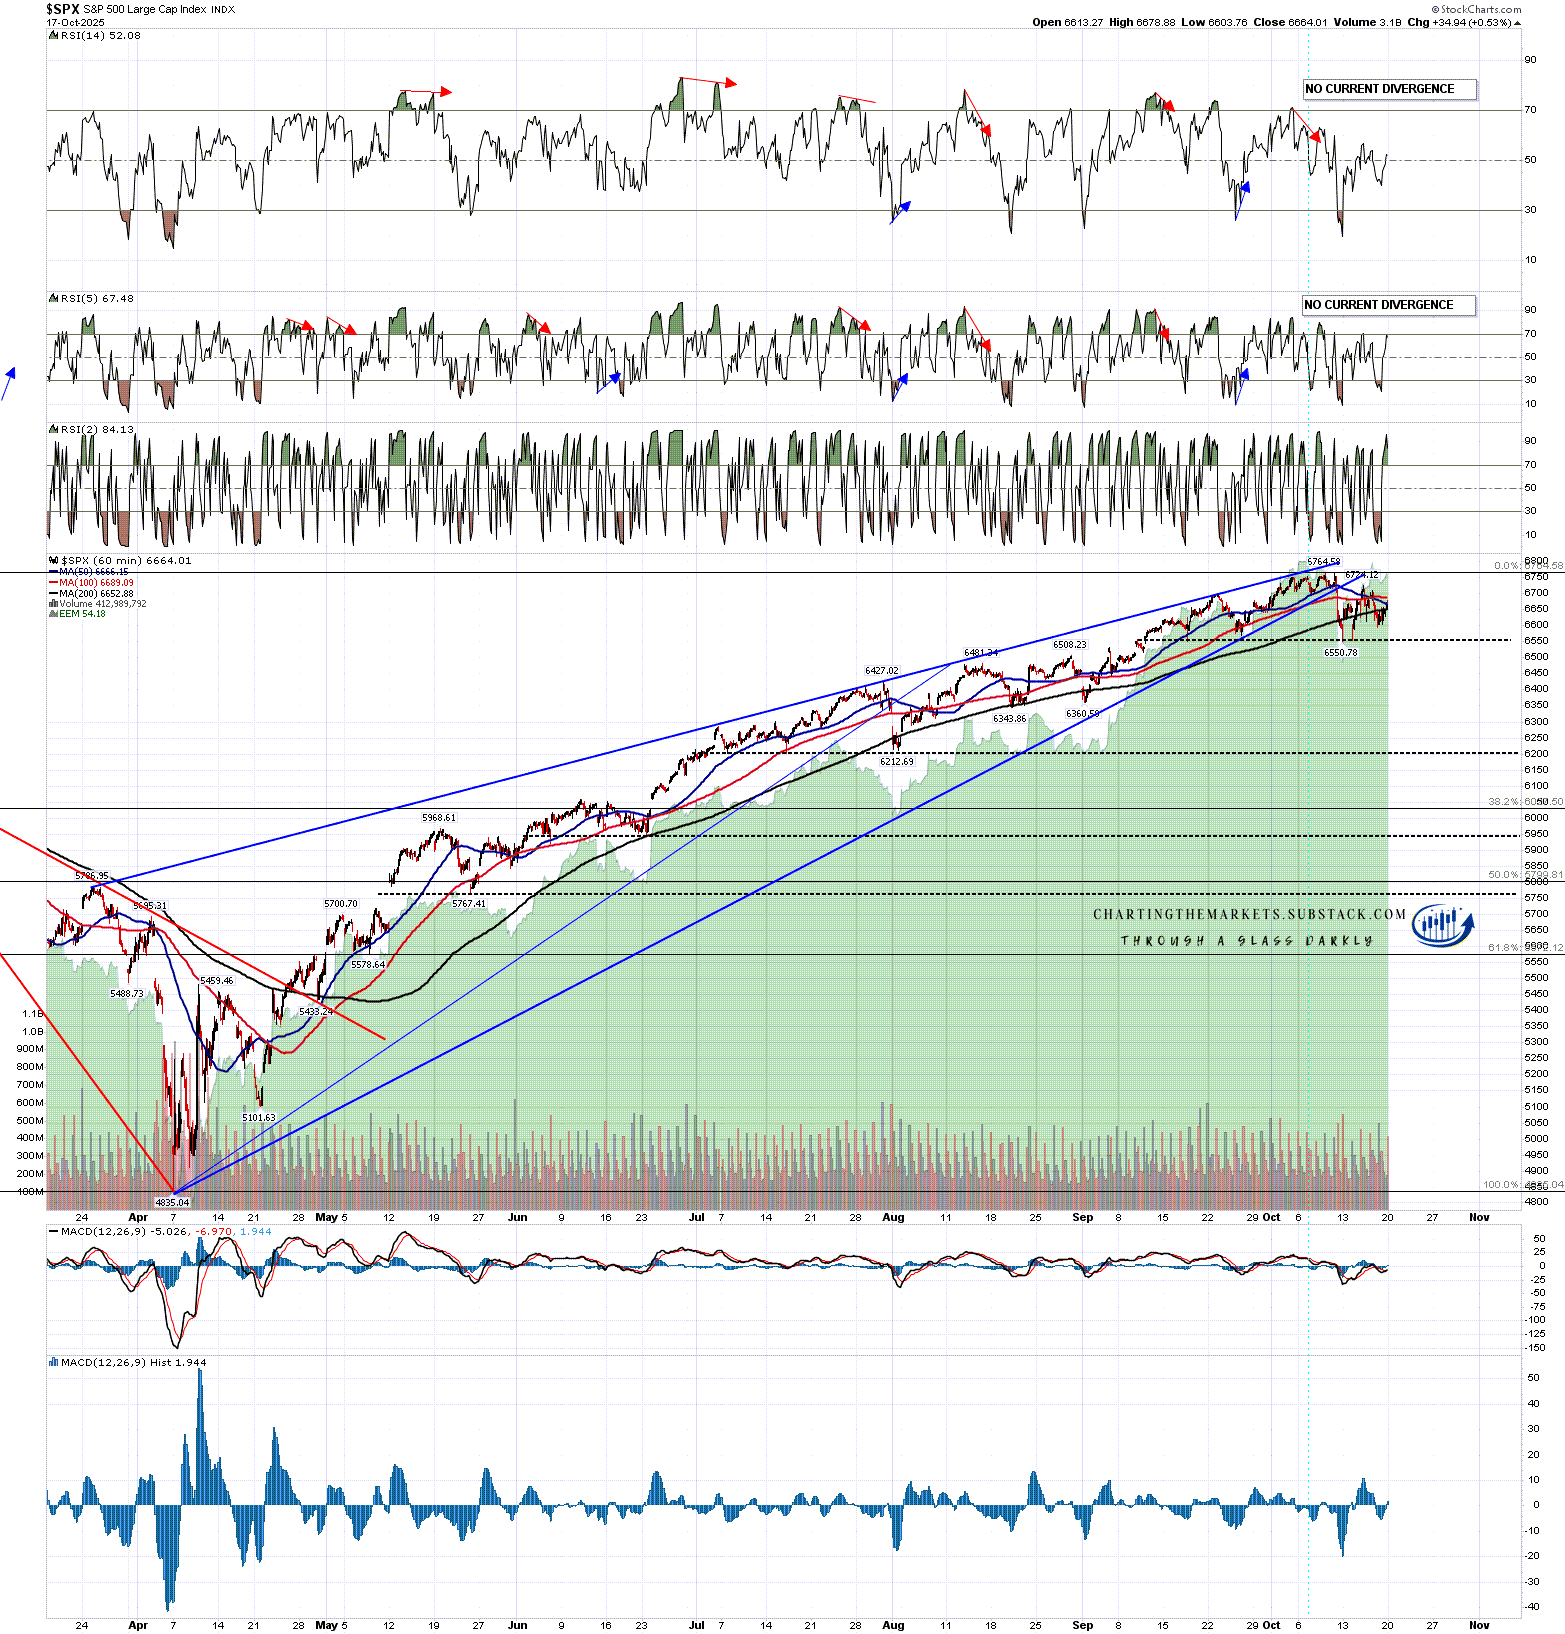
SPX 60min chart:
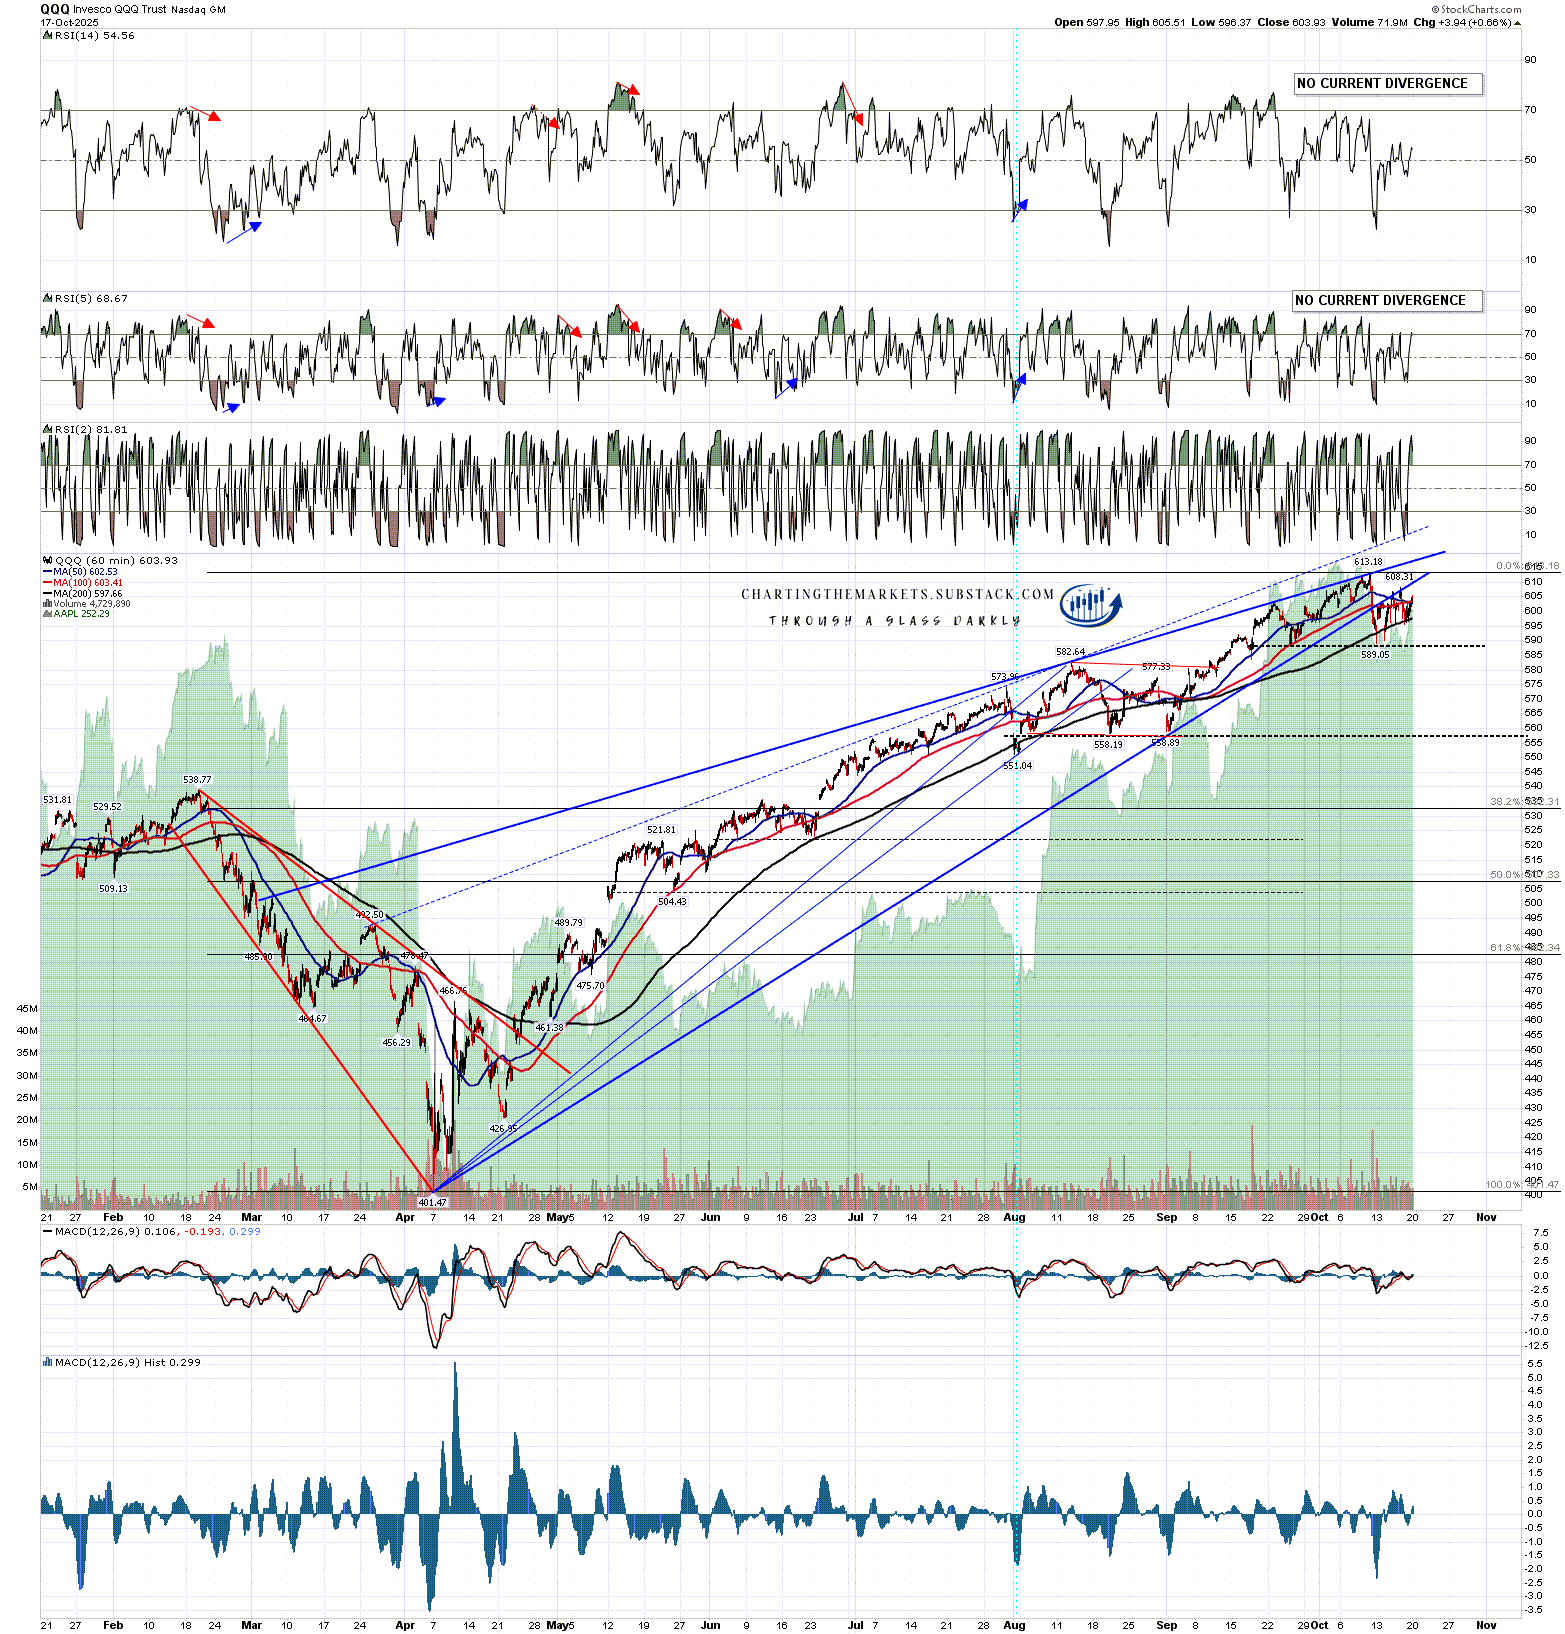
On QQQ there is now also a very high quality rising wedge from the April low. If this is now topping out for a retracement then a 50% retracement of that move would be in the 508 area. The topping pattern to deliver that retest though has not yet formed and might well involve further retests of the all time high as it formed.
QQQ 60min chart:
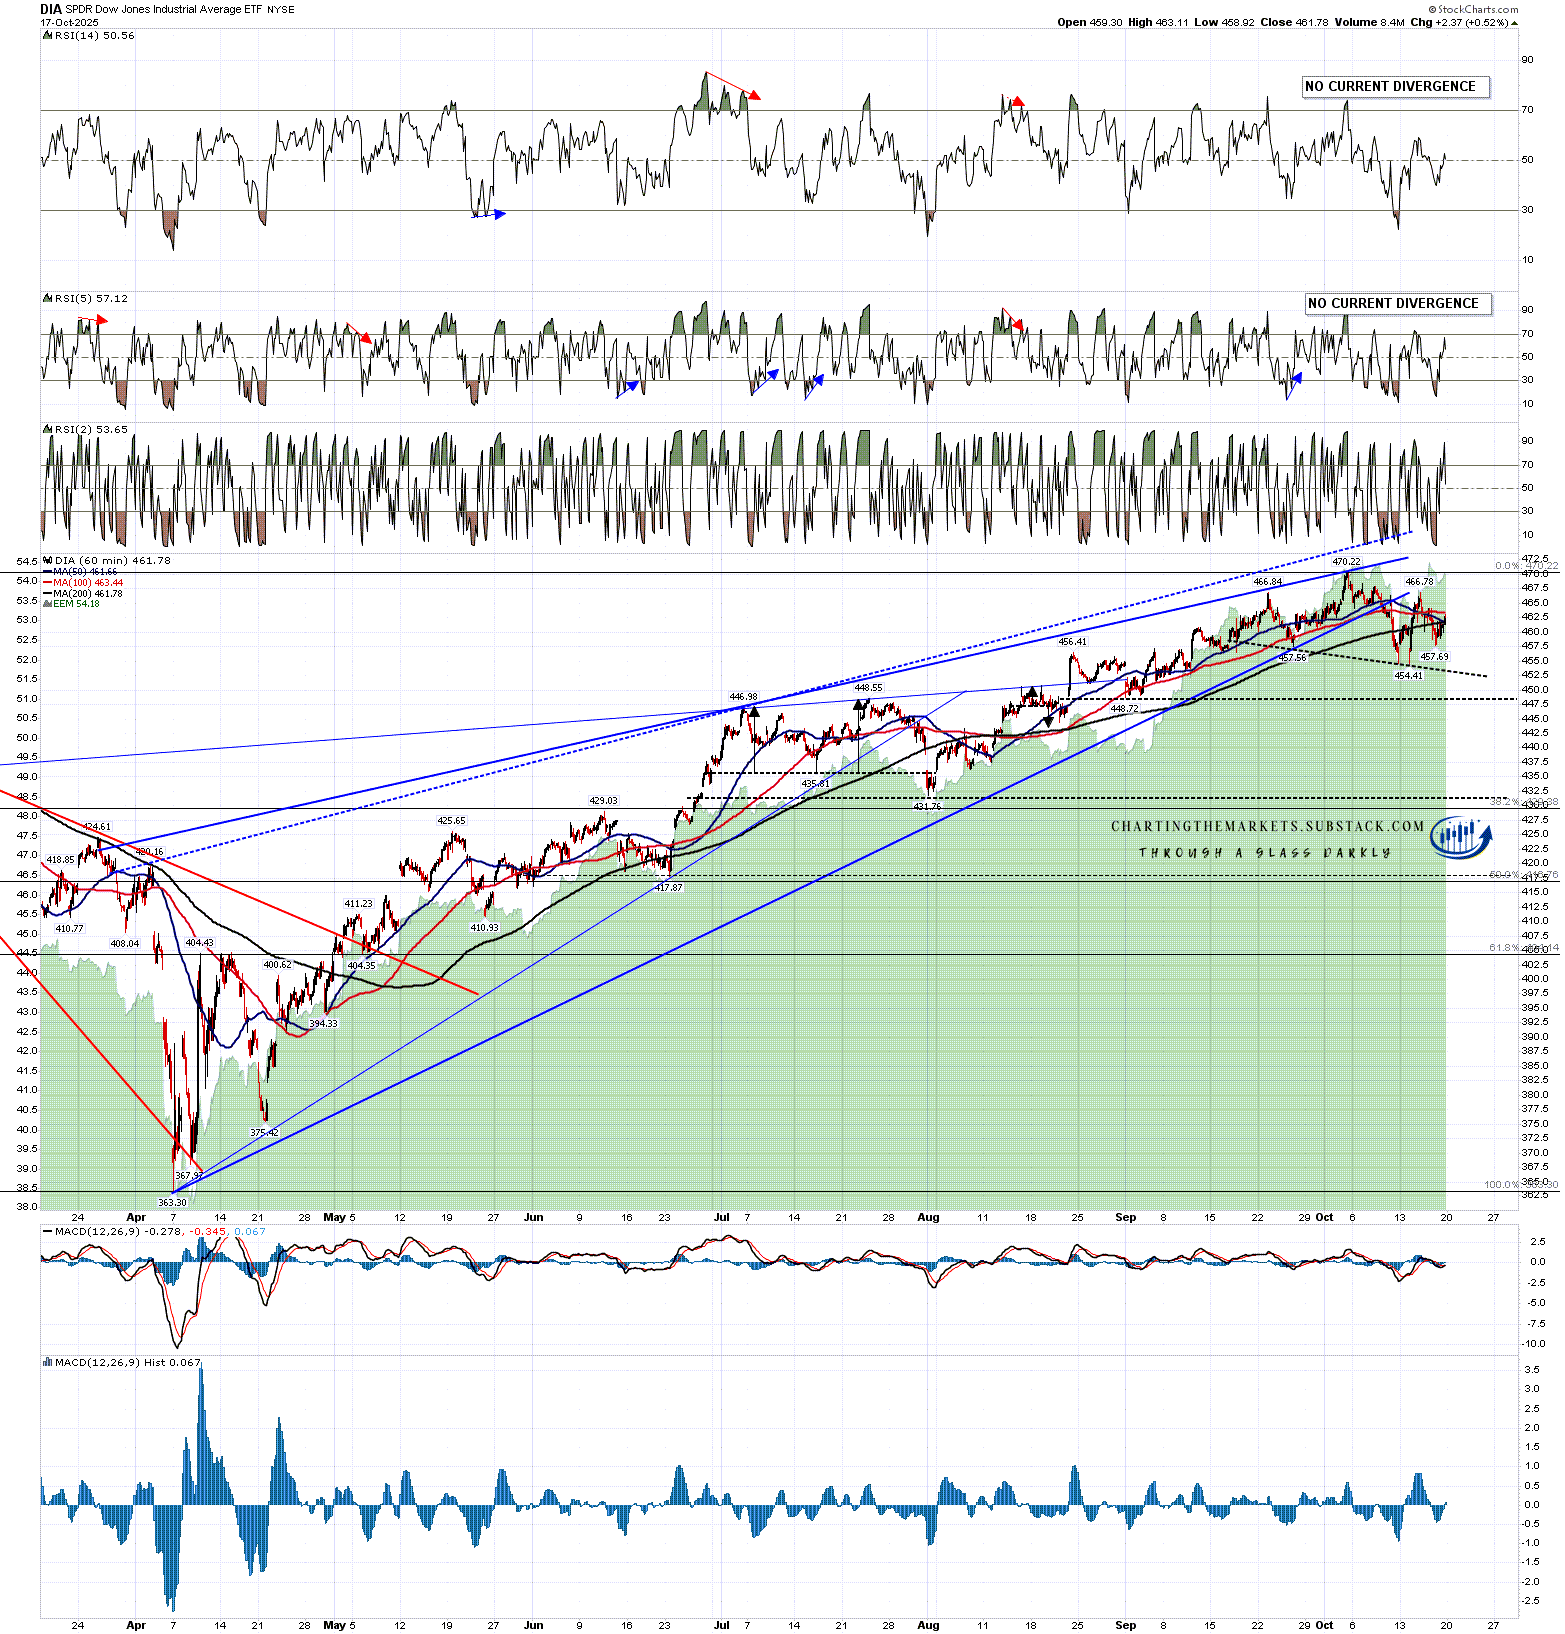
On DIA there is now also a fair quality rising wedge from the April low. If this is now topping out for a retracement then a 50% retracement of that move would be in the 417 area. The topping pattern to deliver that retest though has not yet formed and might well involve further retests of the all time high as it formed.
DIA 60min chart:

On IWM there is now also a high quality rising wedge from the April low. If this is now topping out for a retracement then a 50% retracement of that move would be in the 212 area. The topping pattern to deliver that retest though has not yet formed and might well involve further retests of the all time high as it formed.
IWM 60min chart:
This looks promising for at least an intermediate high forming here, though I would note that these rising wedges often break up briefly as part of the topping process, and none of these have done that yet.
Later this week I’ll be looking at the pattern setup for a possible bigger picture high forming here in another post.
In terms of the historical stats this week they are neutral today and tomorrow, lean bearish on Wednesday and lean bullish on Thursday and Friday. Overall a neutral week with a modestly bullish lean.
In terms of short term headwinds the government shutdown is continuing without any apparent negotiations to end it. There is serious talk of this continuing into Thanksgiving which would not be good for equity markets. There is also still a threatened trade war with China looming, that would start in earnest at the start of November which, if that goes ahead, would also not be good for equity markets. There is a serious risk of either of both of these triggering a much larger retracement than we have already seen.
If you like my analysis and would like to see more, please take a free subscription at my chartingthemarkets substack, where I publish these posts first. I also do a premarket video every day on equity indices, bonds, currencies, energies, precious commodities and other commodities at 8.45am EST, but only for paying subscribers. Other places to find me are my twitter, and my Youtube channel.
No comments:
Post a Comment