
In my post on Monday 6th October I was looking at the negative divergences on SPX and QQQ, with daily RSI 14 and RSI 5 sell signals brewing on both of those. All of those fixed on Friday, with both RSI sell signals also reaching target on Friday. There are now daily RSI 14 sell signals fixed on SPX, QQQ, DIA and (weaker signal) IWM. This is suggesting a larger retracement soon to reach those targets.
I was also saying that until we saw some strong breaks below the daily middle bands on US indices they remained in a strong uptrend from the April low. On Friday they all broke hard below their daily middle bands so are all now in a possible topping process for larger retracements than the ones we saw on Friday.
In my post yesterday I was looking at Friday’s decline, and the likely strong rally yesterday, and mentioned that there were already possible topping patterns forming that would not require a retest of the highs.
Those patterns have continued forming and are looking pretty good, so I’ll run through those today in case they break down into what might then become a much more significant pullback.
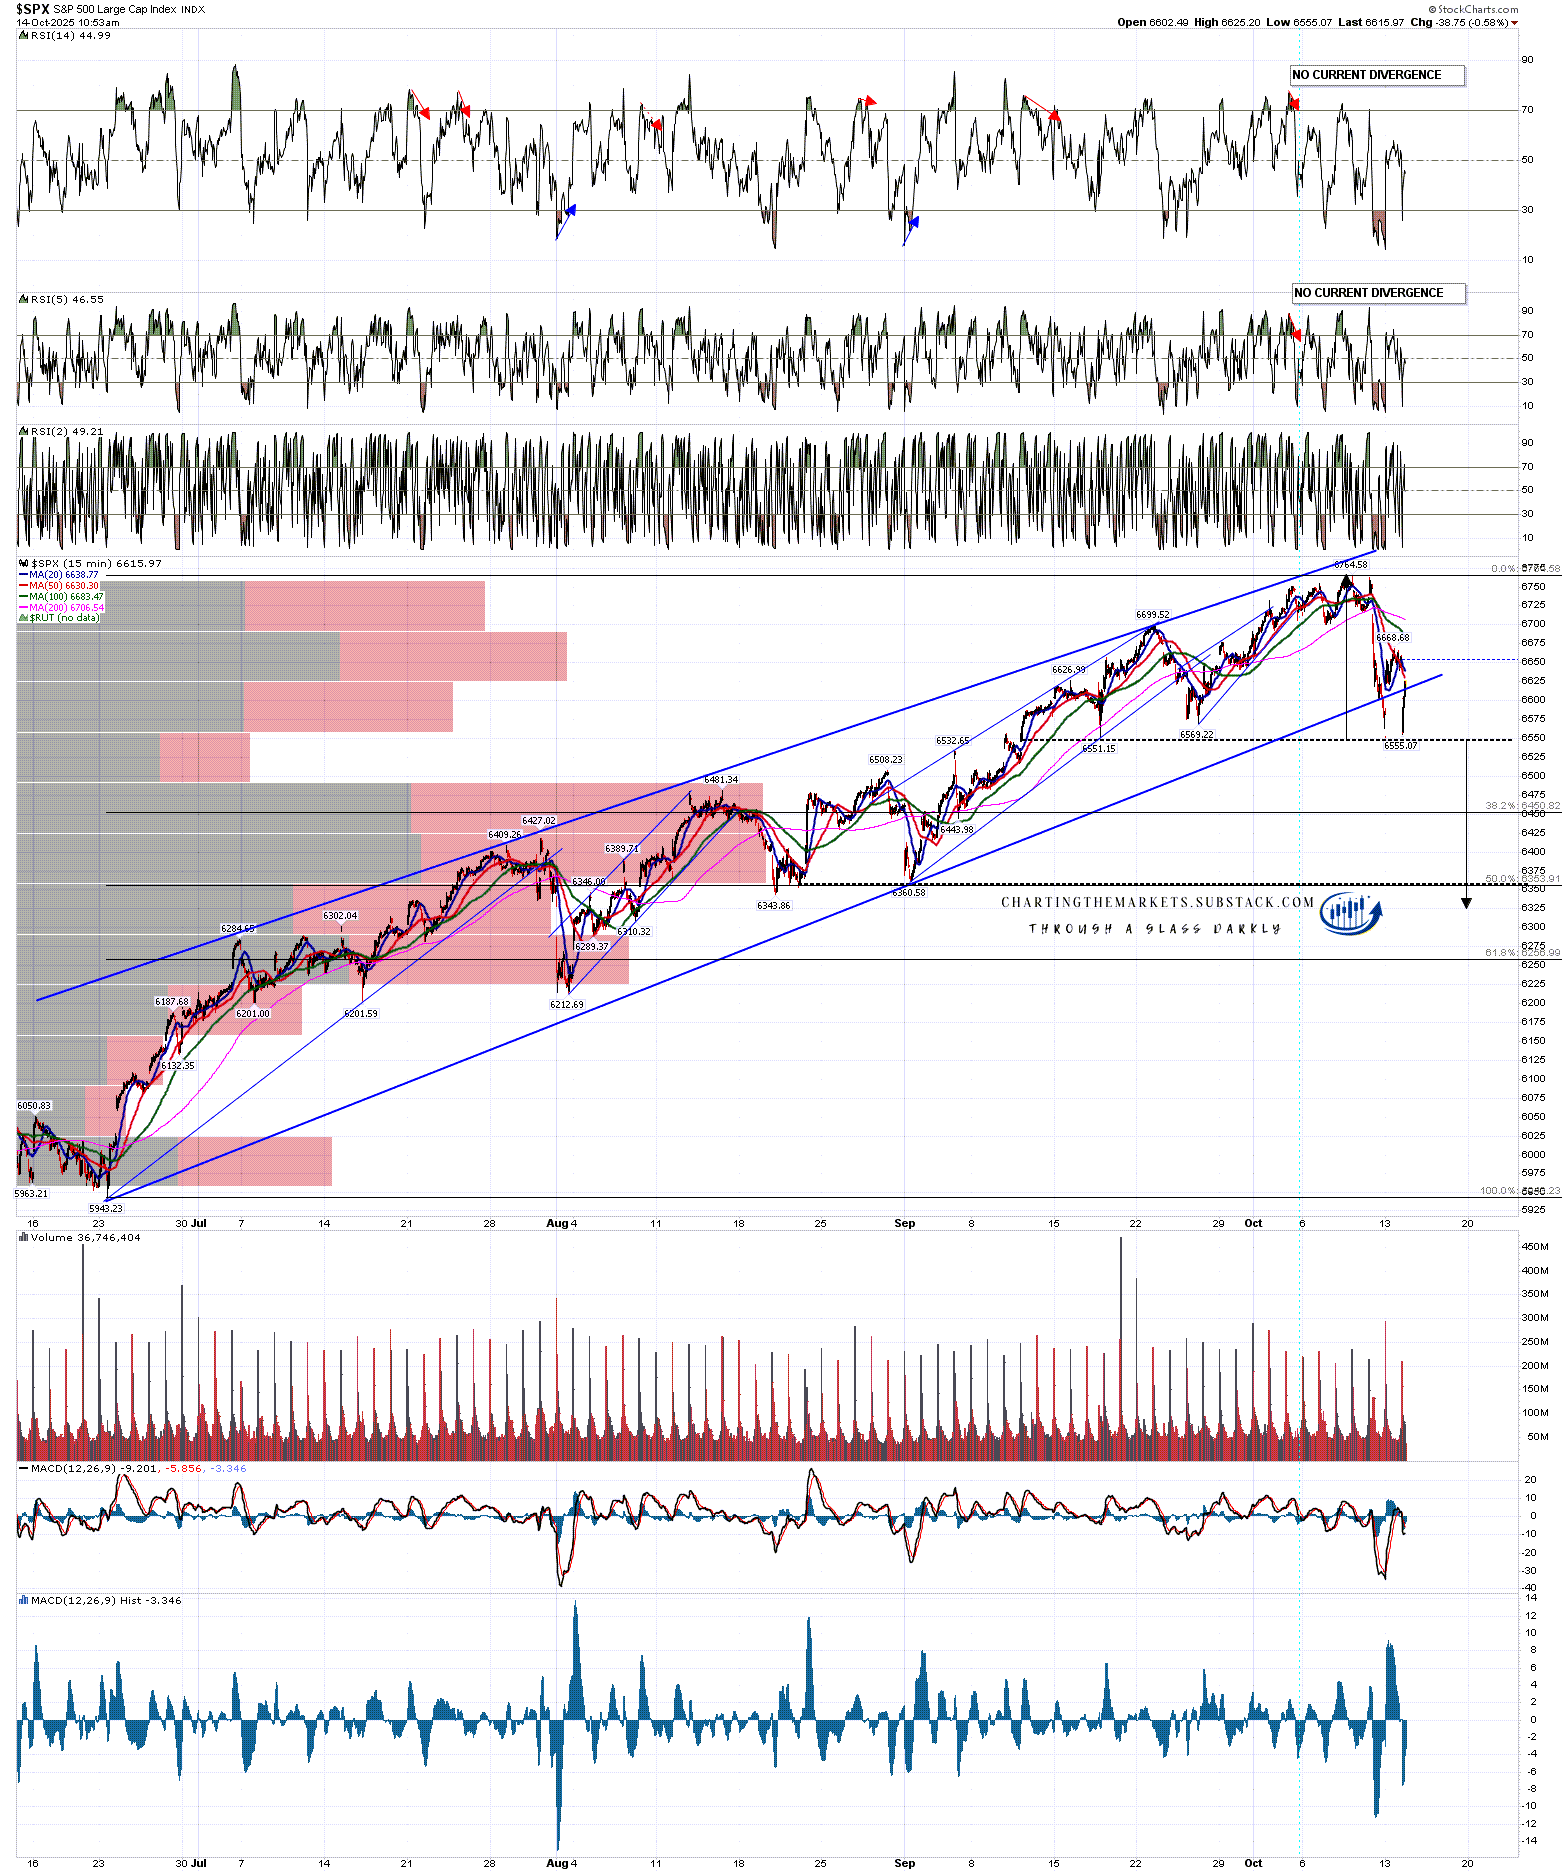
On the SPX daily chart yesterday’s rally backtested the daily middle band and has failed there so far. As long as that remains the case the downside is open.
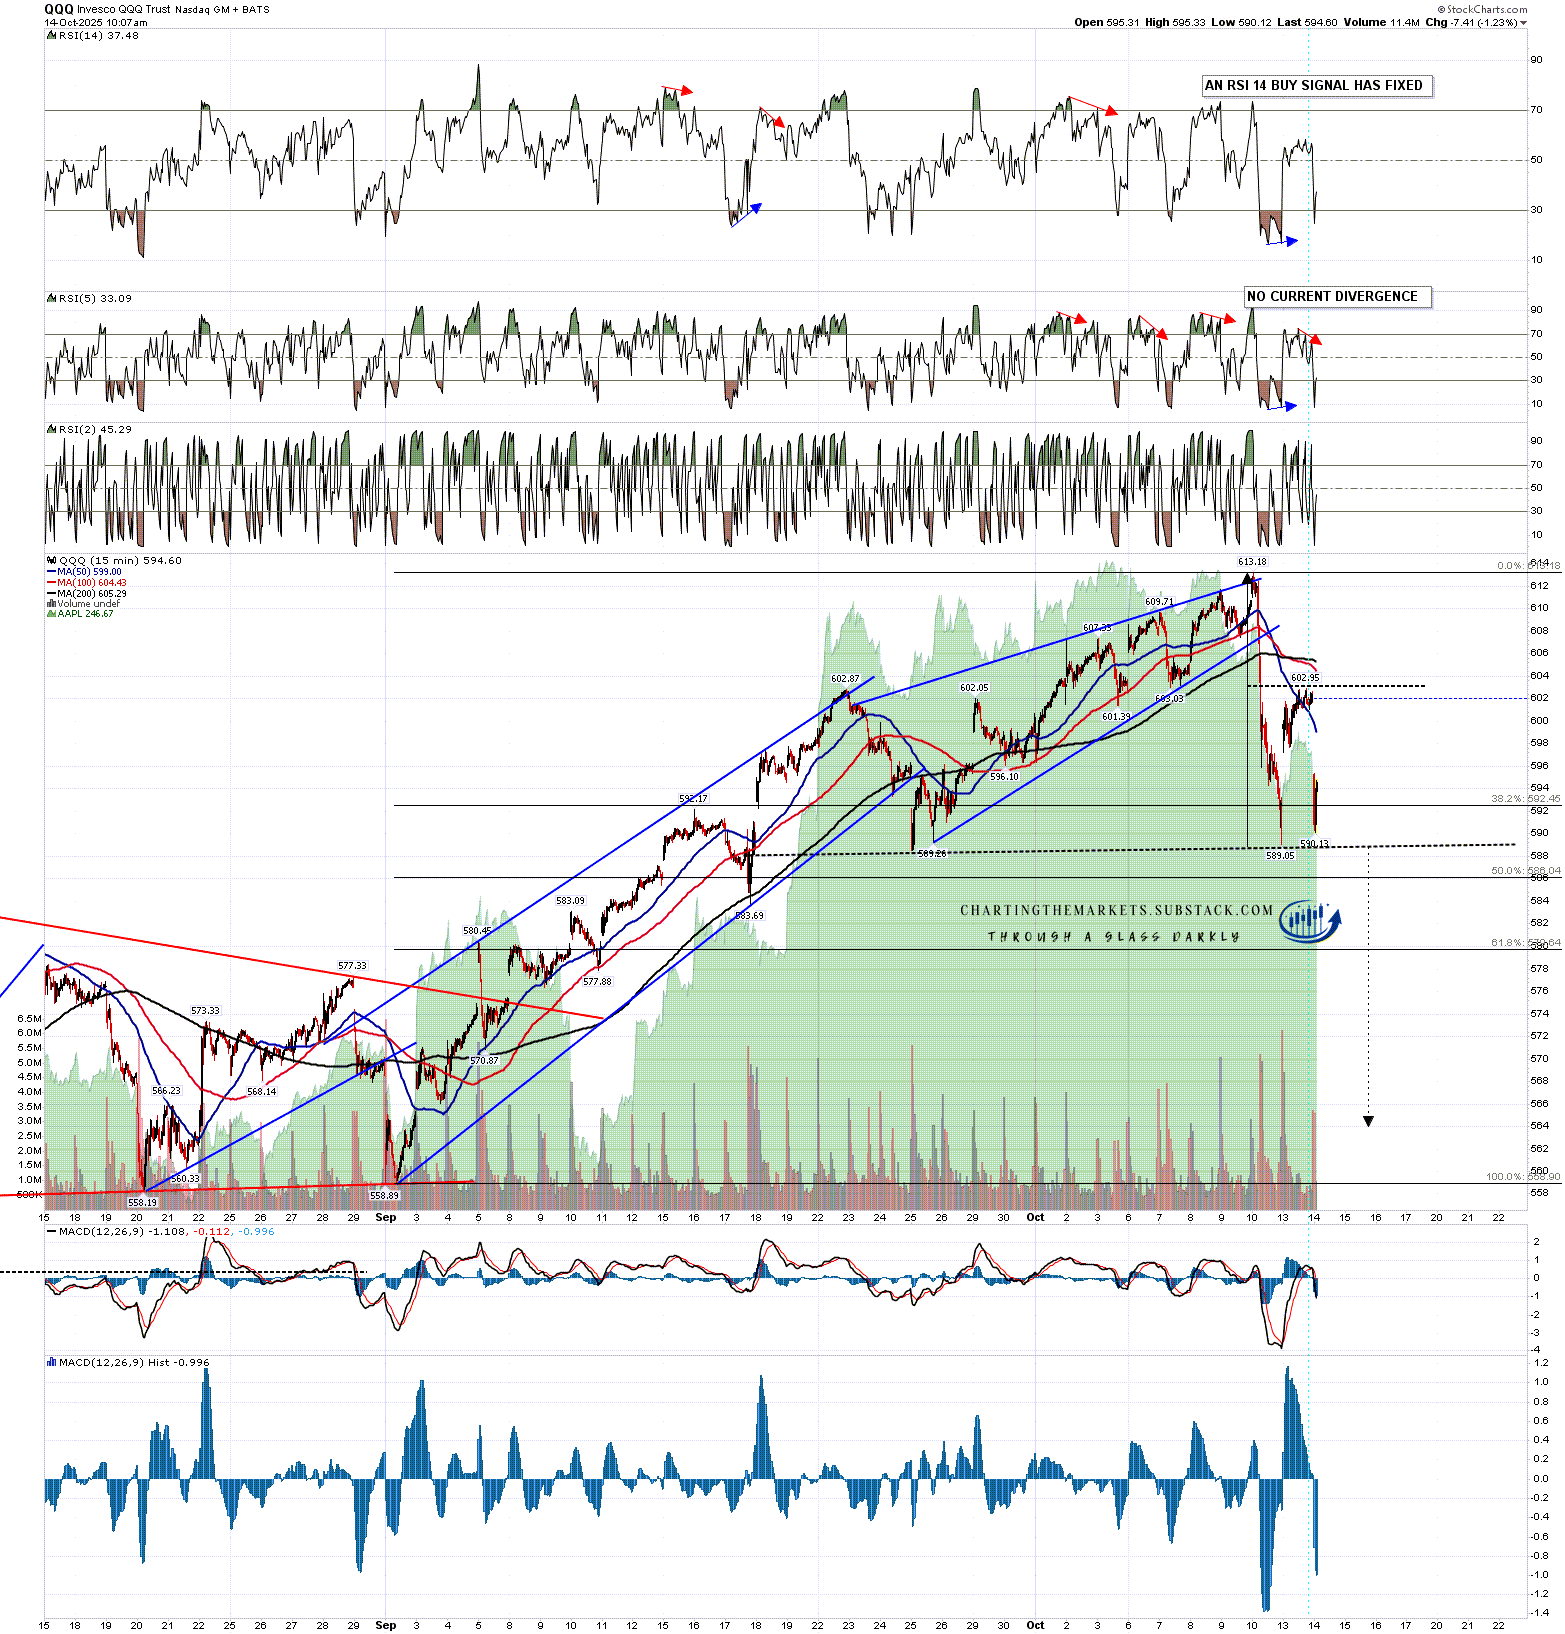
I would mention that QQQ and IWM closed over their daily middle bands yesterday and if SPX and DIA can follow suit soon I’ll be leaning towards high retests across the board.
SPX daily chart:
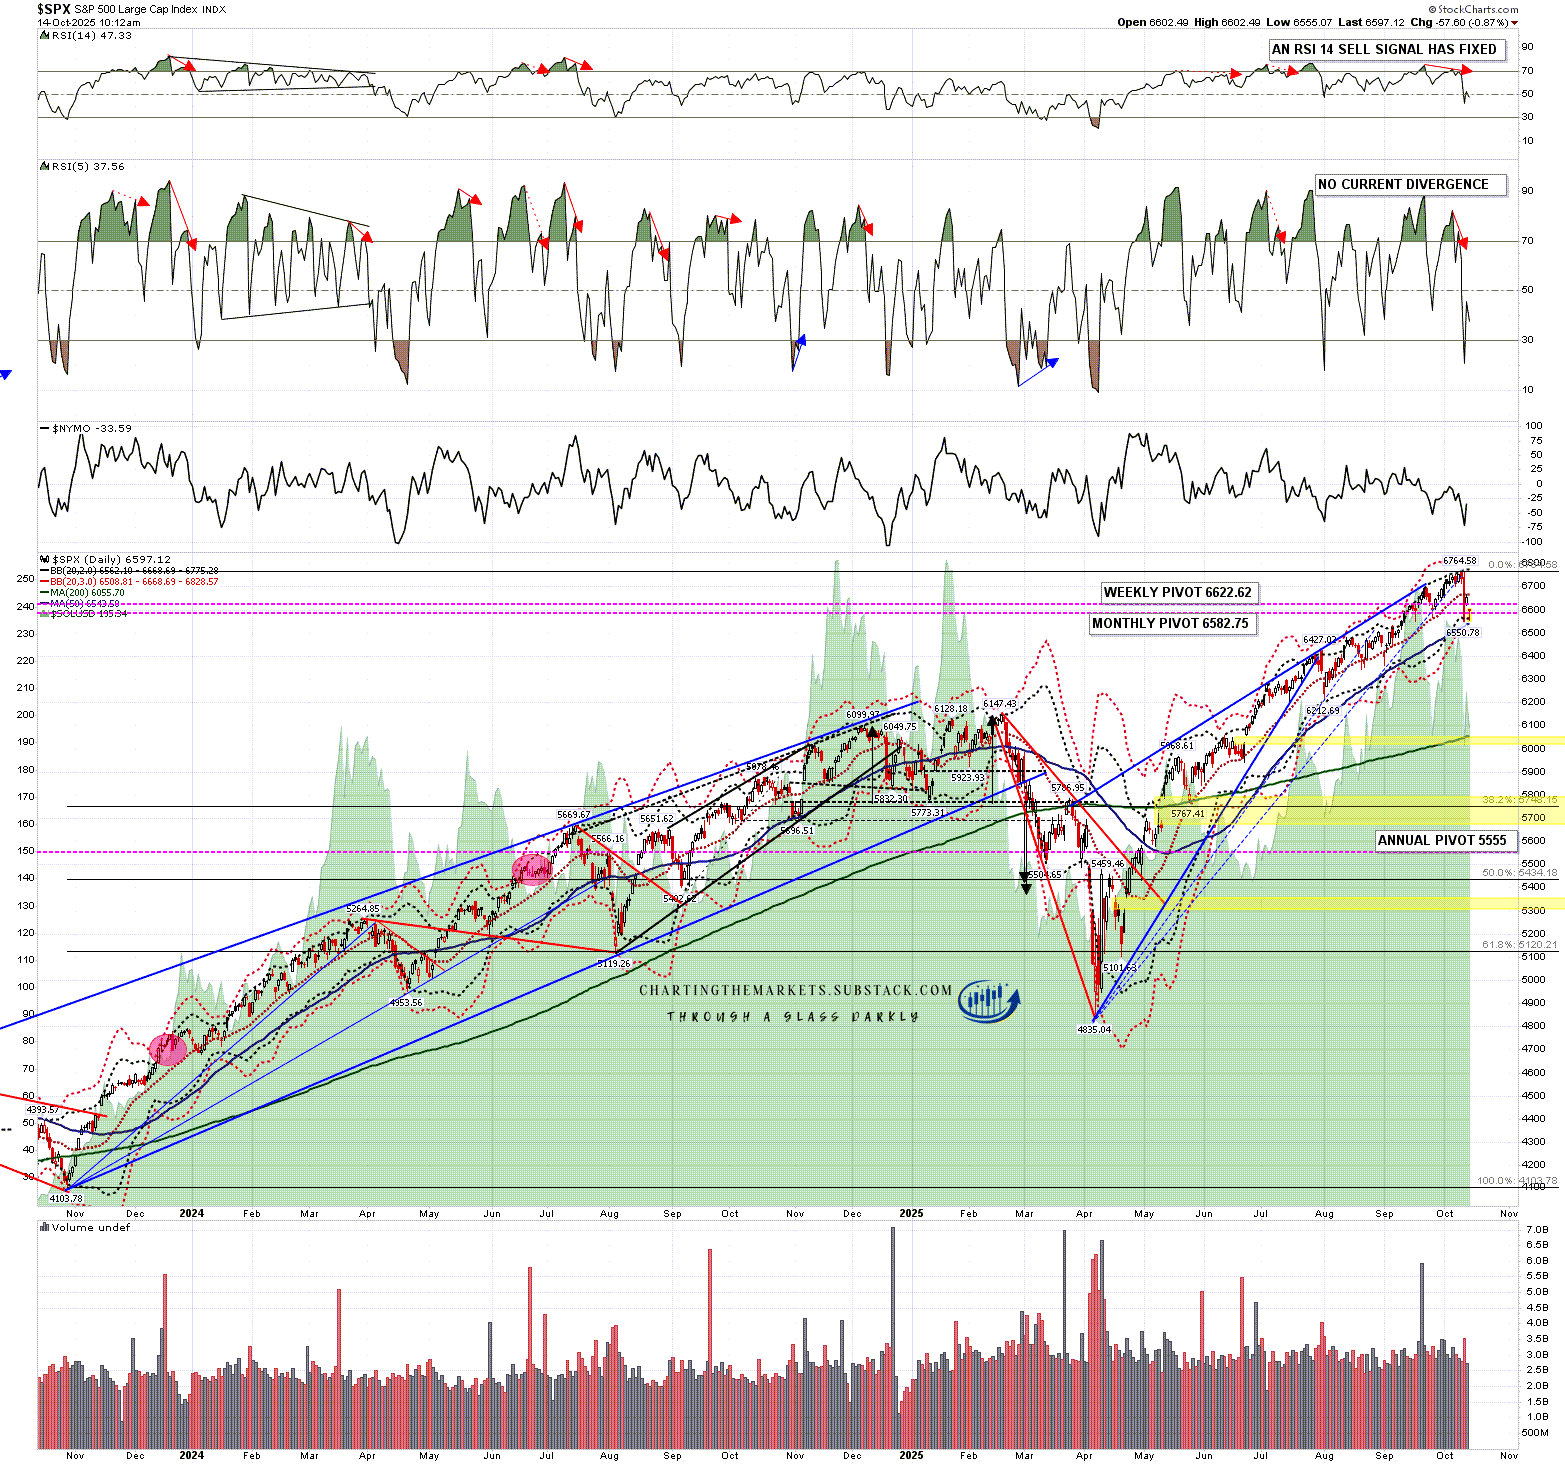
The H&S setup is looking nice on SPX, with that mostly formed and close to breaking down at the low this morning. If it breaks down then the target would be in the 6325 area.
The low retest this morning also set up a possible double bottom that on a sustained break over yesterday’s high at 6555.07 would look for a retest of the all time high.
SPX 15min chart:
On QQQ there is another possible H&S forming that didn’t quite break down at the low this morning. If that should break down then the target would be in the 564 area.
Again a possible alternate double bottom may be forming, but the quality would be improved with a full retest of Friday’s low.
QQQ 15min chart:
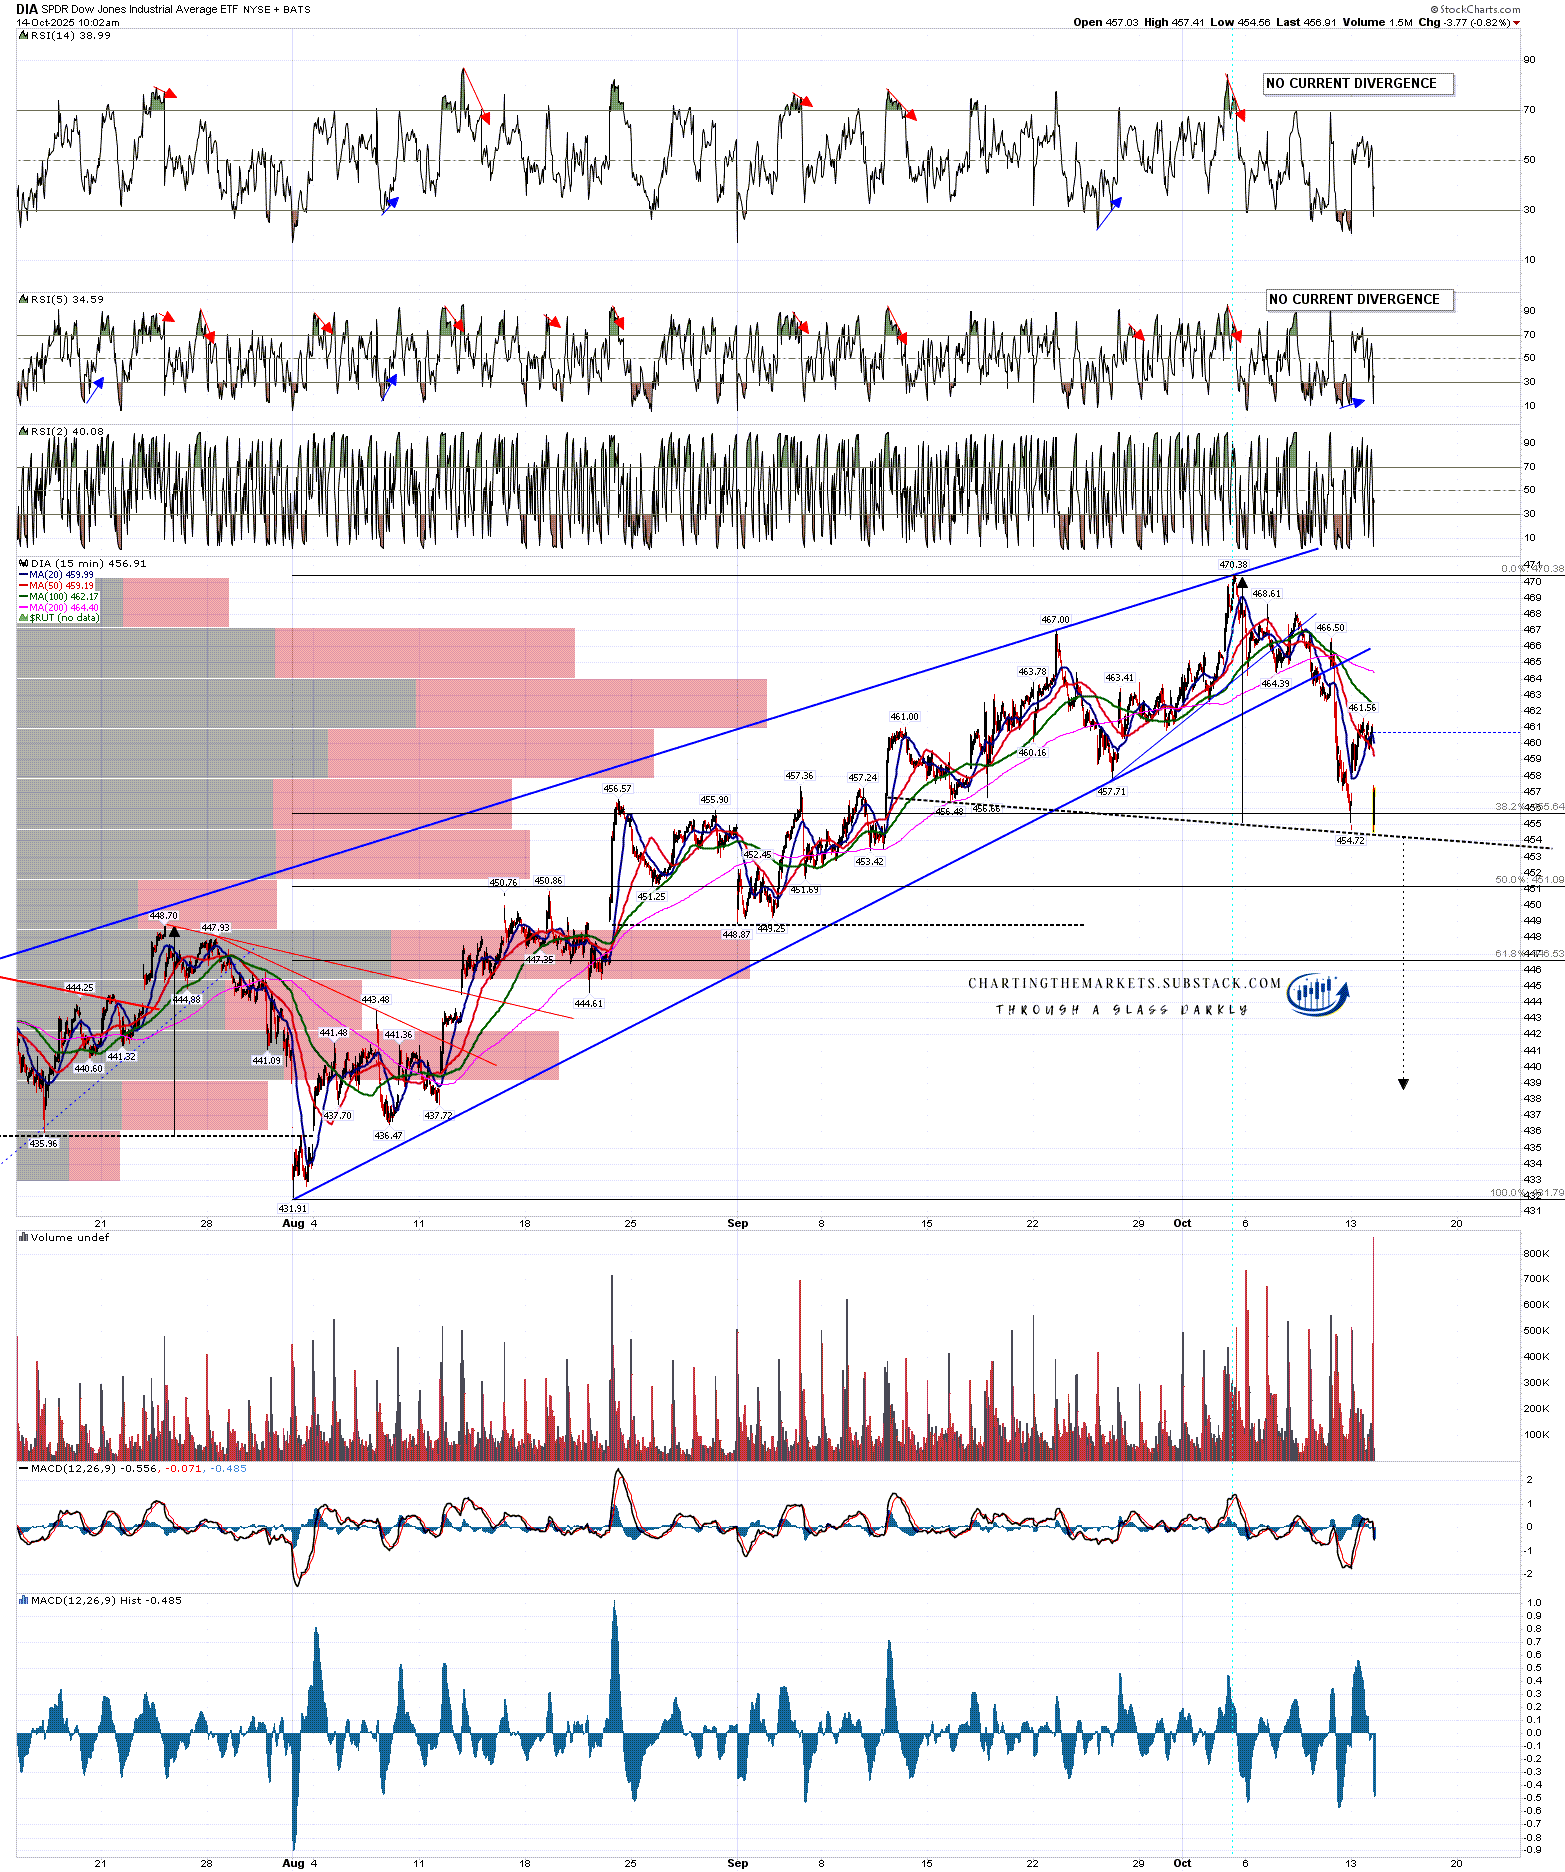
On DIA there is a third possible and decent quality H&S forming. On a break down the H&S target would be in the 438.50 area.
On a break up over yesterday’s high the double bottom target would be in the 468.40 area.
DIA 15min chart:
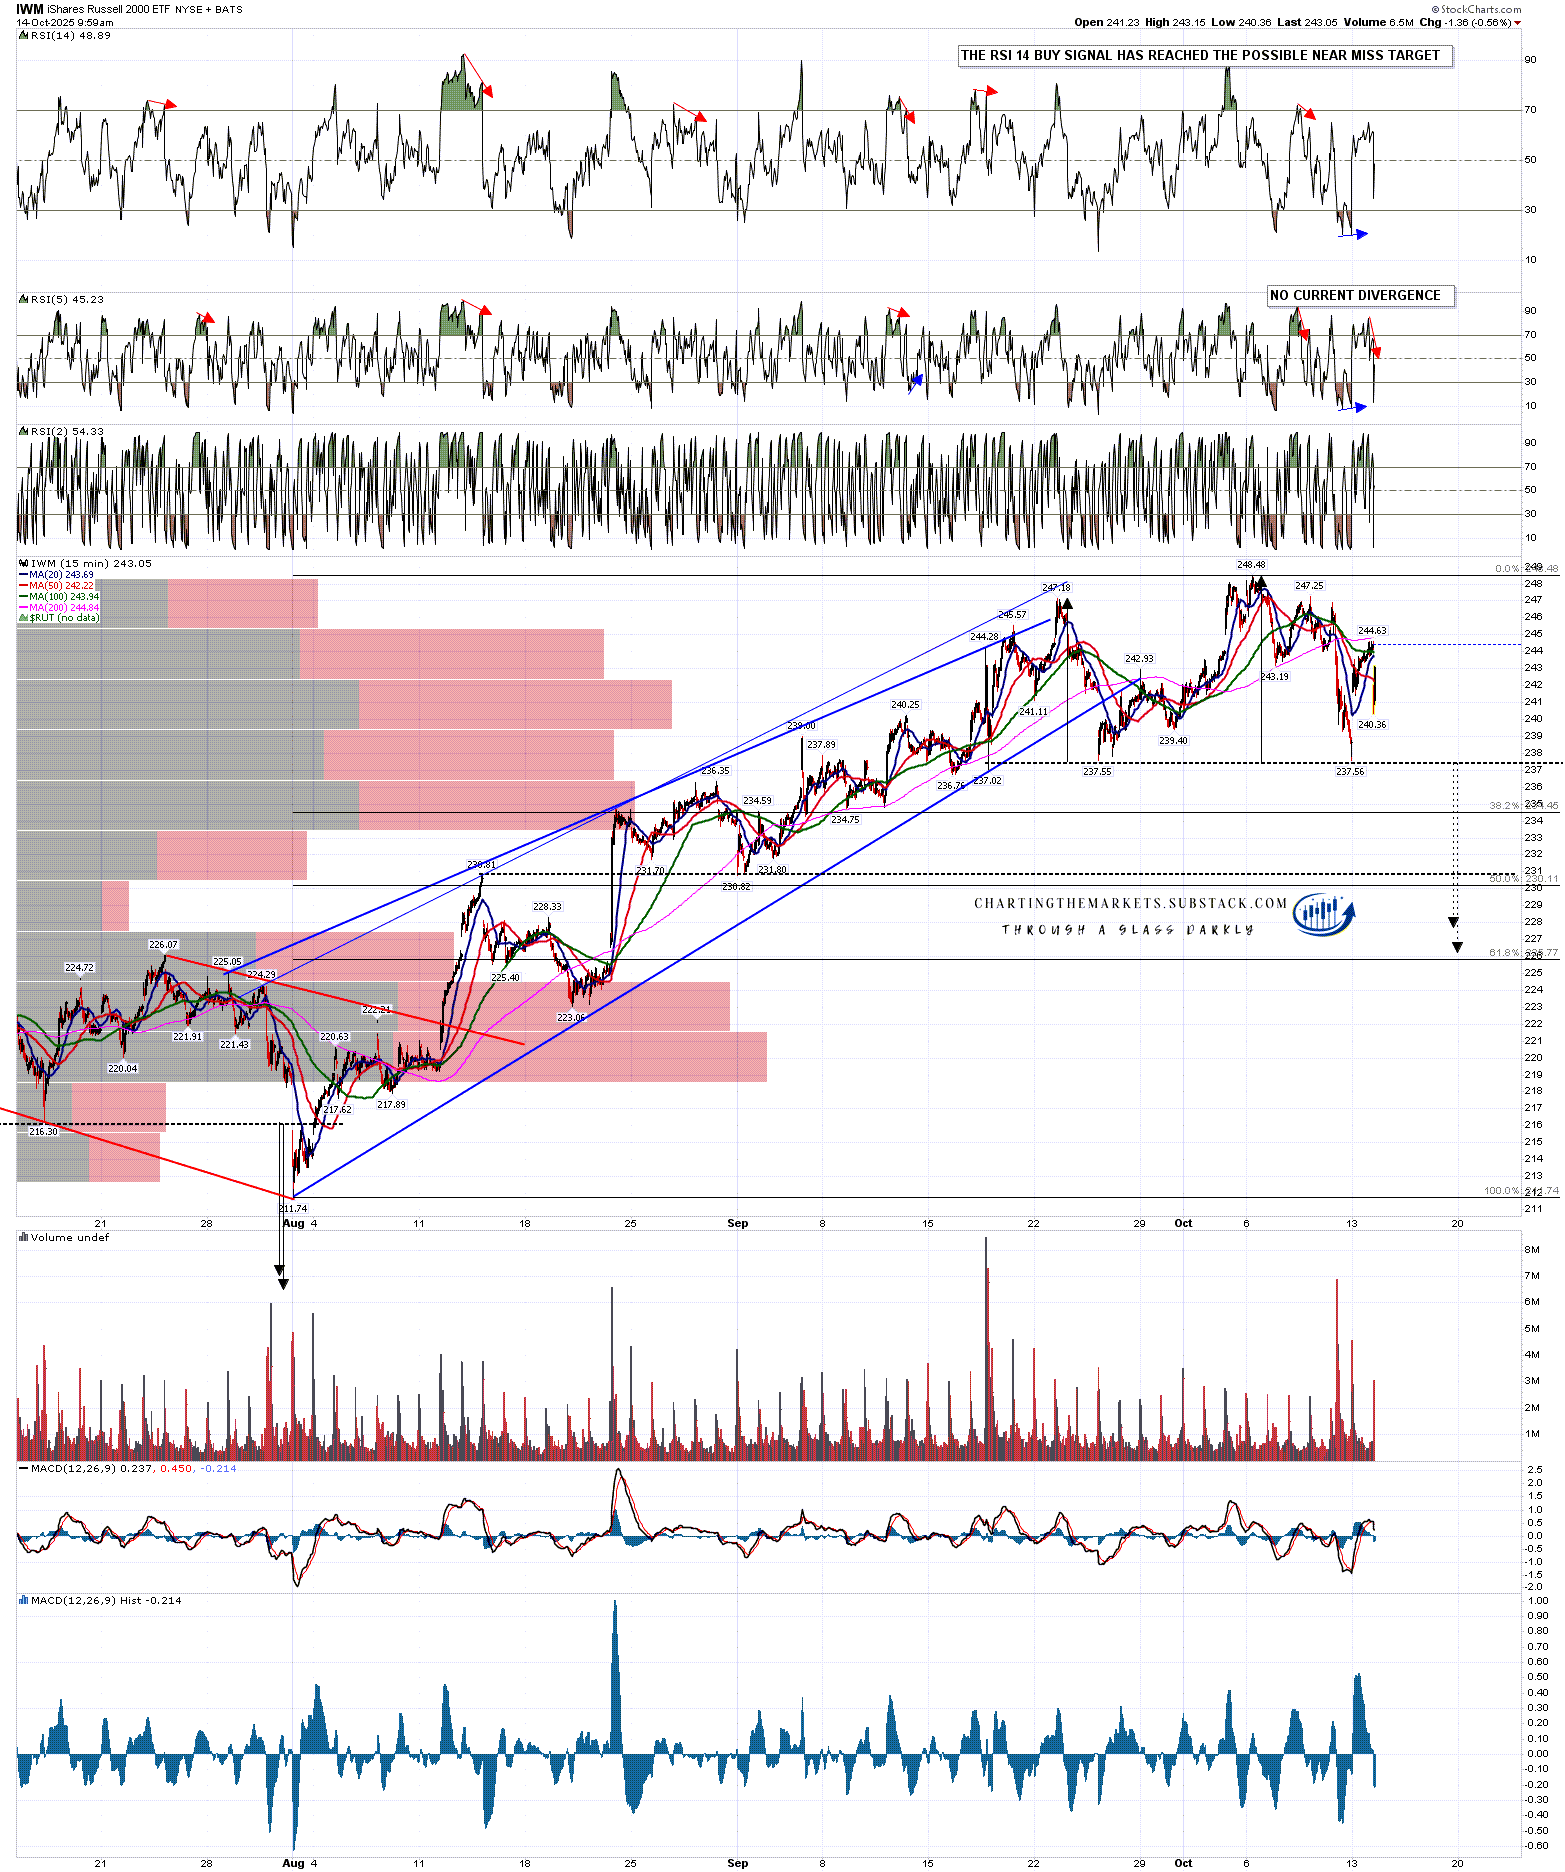
On IWM there was already a high quality double top setup, though it could be evolving into an IHS. On a break down from here the IHS or full double top target would be in the 226.7 area.
No current bullish double bottom setup but if IWM retests Friday’s low then we’d have a decent looking double bottom setup with a target at a retest of the all time high.
IWM 15min chart:
Now it may be that none of these get as far as breaking down, but if they do then there is an obvious point of failure there where they could fail and reject back up to the highs. On sustained breaks down though, I’d be looking for these targets.
If we do see this larger retracement I’d still be looking for high retests afterwards, but those retests might then be making second highs on much larger double tops.
In terms of the historical stats this week they lean neutral to bullish today and tomorrow, 71% bullish on Thursday and neutral to bullish on Friday. Overall a neutral week with a modestly bullish lean.
If you like my analysis and would like to see more, please take a free subscription at my chartingthemarkets substack, where I publish these posts first. I also do a premarket video every day on equity indices, bonds, currencies, energies, precious commodities and other commodities at 8.45am EST, but only for paying subscribers. Other places to find me are my twitter, and my Youtube channel.
No comments:
Post a Comment