
In my post on Monday 6th October I was looking at the negative divergences on SPX and QQQ, with daily RSI 14 and RSI 5 sell signals brewing on both of those. All of those fixed on Friday 10th October, with both RSI 5 sell signals also reaching target on that Friday.
In my next post on Tuesday 14th October I was noting that there were now daily RSI 14 sell signals fixed on SPX, QQQ, DIA and (weaker signal) IWM. I was saying then that was suggesting a larger retracement soon to reach those targets.
I was also looking at possible topping patterns forming on SPX, QQQ, DIA and IWM then and saying that those would likely break down or reject back up to the highs in what might then be the second highs on a series of double tops.
In my post on Friday 17th October I was noting the still decent looking topping patterns on US indices and talking about the market risks from the ongoing government shutdown and the possible escalation of the trade war with China. The Kalahi odds I showed then were at a total government shutdown length at 39.8 days. At the time of writing a week later they are now at 44.3 days.
I was also looking at the important test taking place at the 45dma on SPX, holding so far, and the historical stats for this week, which have delivered perfectly so far, with a bearish leaning Wednesday into a bullish leaning Thursday and Friday.
In my last post on Monday 20th October I was looking at the very high quality rising wedges formed from the April lows on SPX, QQQ and IWM and the decent quality rising wedge on DIA, and noting that these are all supporting a possible intermediate high forming here and a possible more impressive retracement from this area in the near future.
So here we are, SPX, QQQ and DIA all recovered over their daily middle bands all recovered over their daily middle bands and have retested their all time highs and this is the nicest looking topping setup that I have seen on US equity indices since the ones I was looking at the February highs in my post on Wednesday 19th February.
Those February topping patterns all more than made target of course. Is that going to happen here? Who can say? The only way ever to know for sure is to wait and see what happens, but the setup is certainly very nice, and to add to the uncertainties about the government shutdown and negotiations with China, we have now in the last few days had the first real signs of weakness in the AI Tech frenzy, and possible speculative bubble, which has underpinned most of the rise in US equities since the April low. That may mean that a much bigger high is forming here, and that a smaller high here would be just part of that larger high forming.
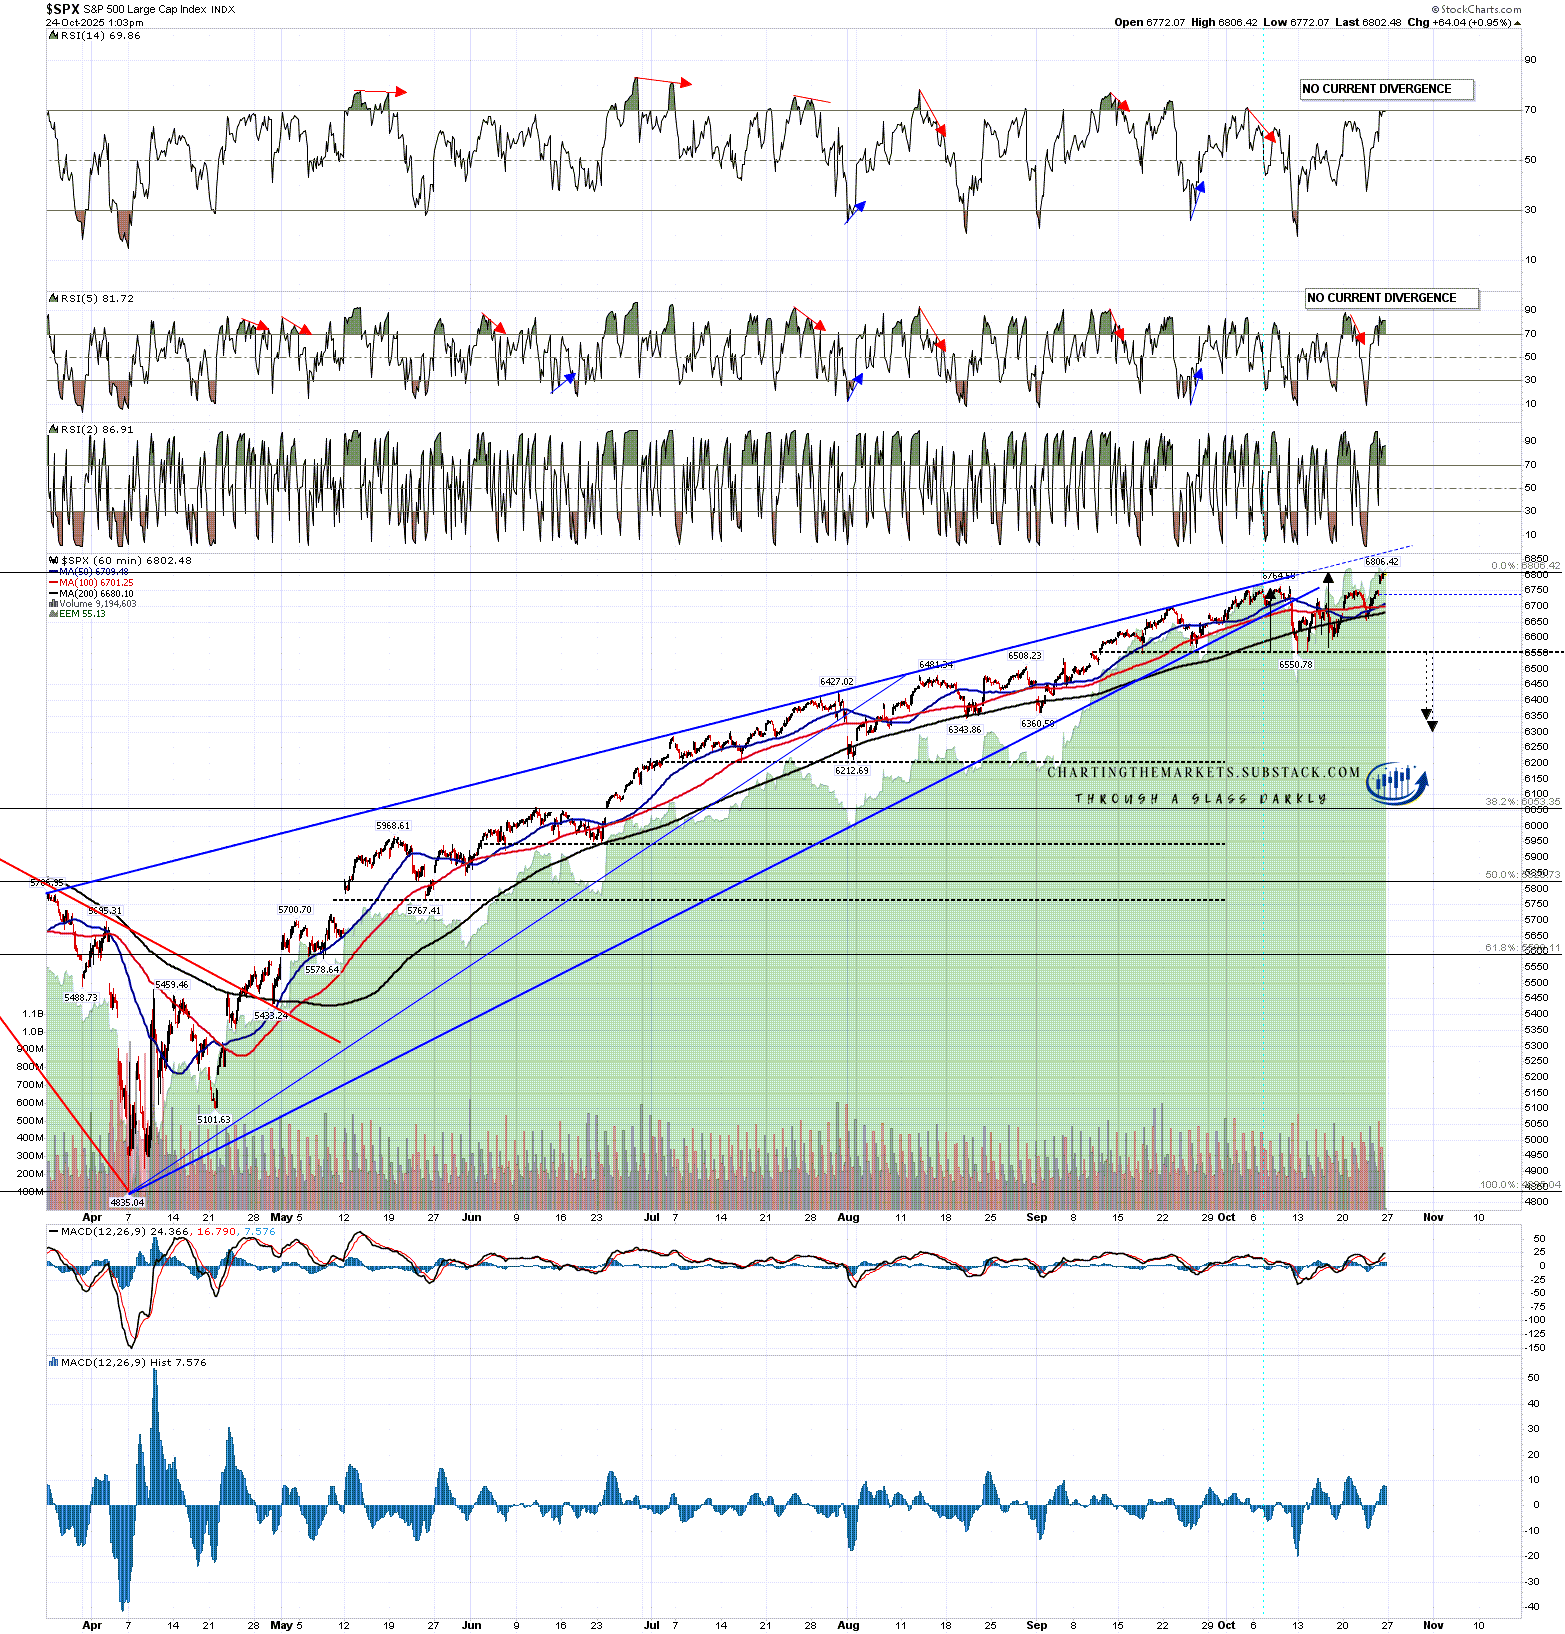
Looking at SPX a new all time high has been made today and a good quality double top is now forming. If that breaks down then the target area would be in the 6300-40 range. There is a good support level and possible H&S neckline in the 6200 area.
On the upside, SPX could go higher if an H&S is forming rather than a double top, but I’d note that if the resistance trendline above is hit, currently in the 6850 area, then the rising wedge would have expanded and I would redraw the rising wedge support trendline through the most recent low. I’d still be looking for strong resistance at that trendline above and a top might still be forming.
SPX hourly chart:
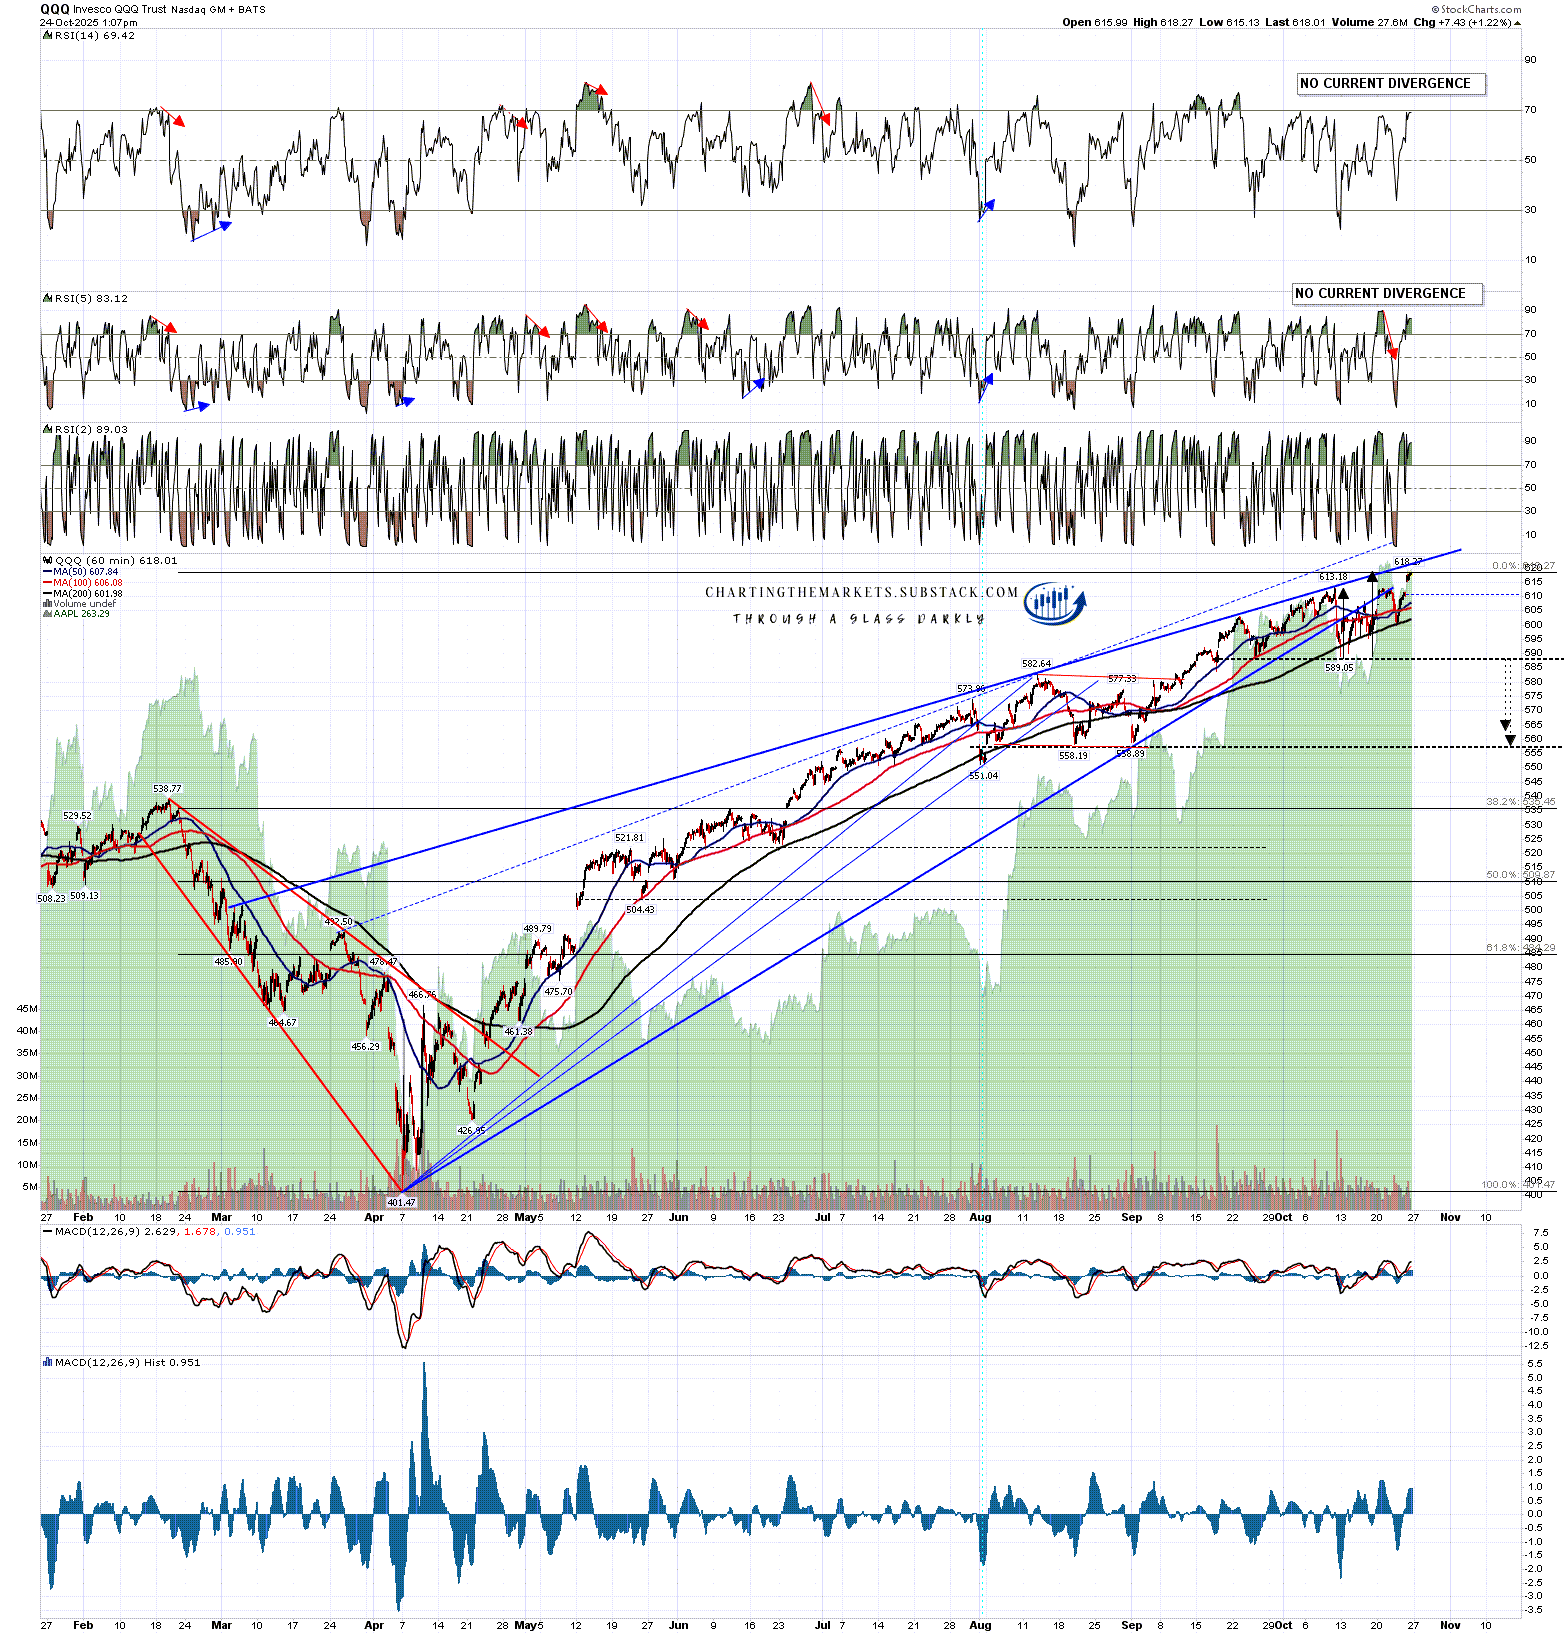
Looking at QQQ a new all time high has been made today and a good quality double top is now forming. If that breaks down then the target area would be in the 558-63 range. There is a good support level and possible H&S neckline in the 558 area, which is a strong match with the lower target.
On the upside, QQQ could go higher if an H&S is forming rather than a double top, but I’d note that if the resistance trendline above is hit, currently in the 621 area, then the rising wedge would have expanded and I would redraw the rising wedge support trendline through the most recent low. I’d still be looking for strong resistance at that trendline above or at an even better quality alternate rising wedge resistance trendline that is currently in the 626-8 area.
QQQ 60min chart:
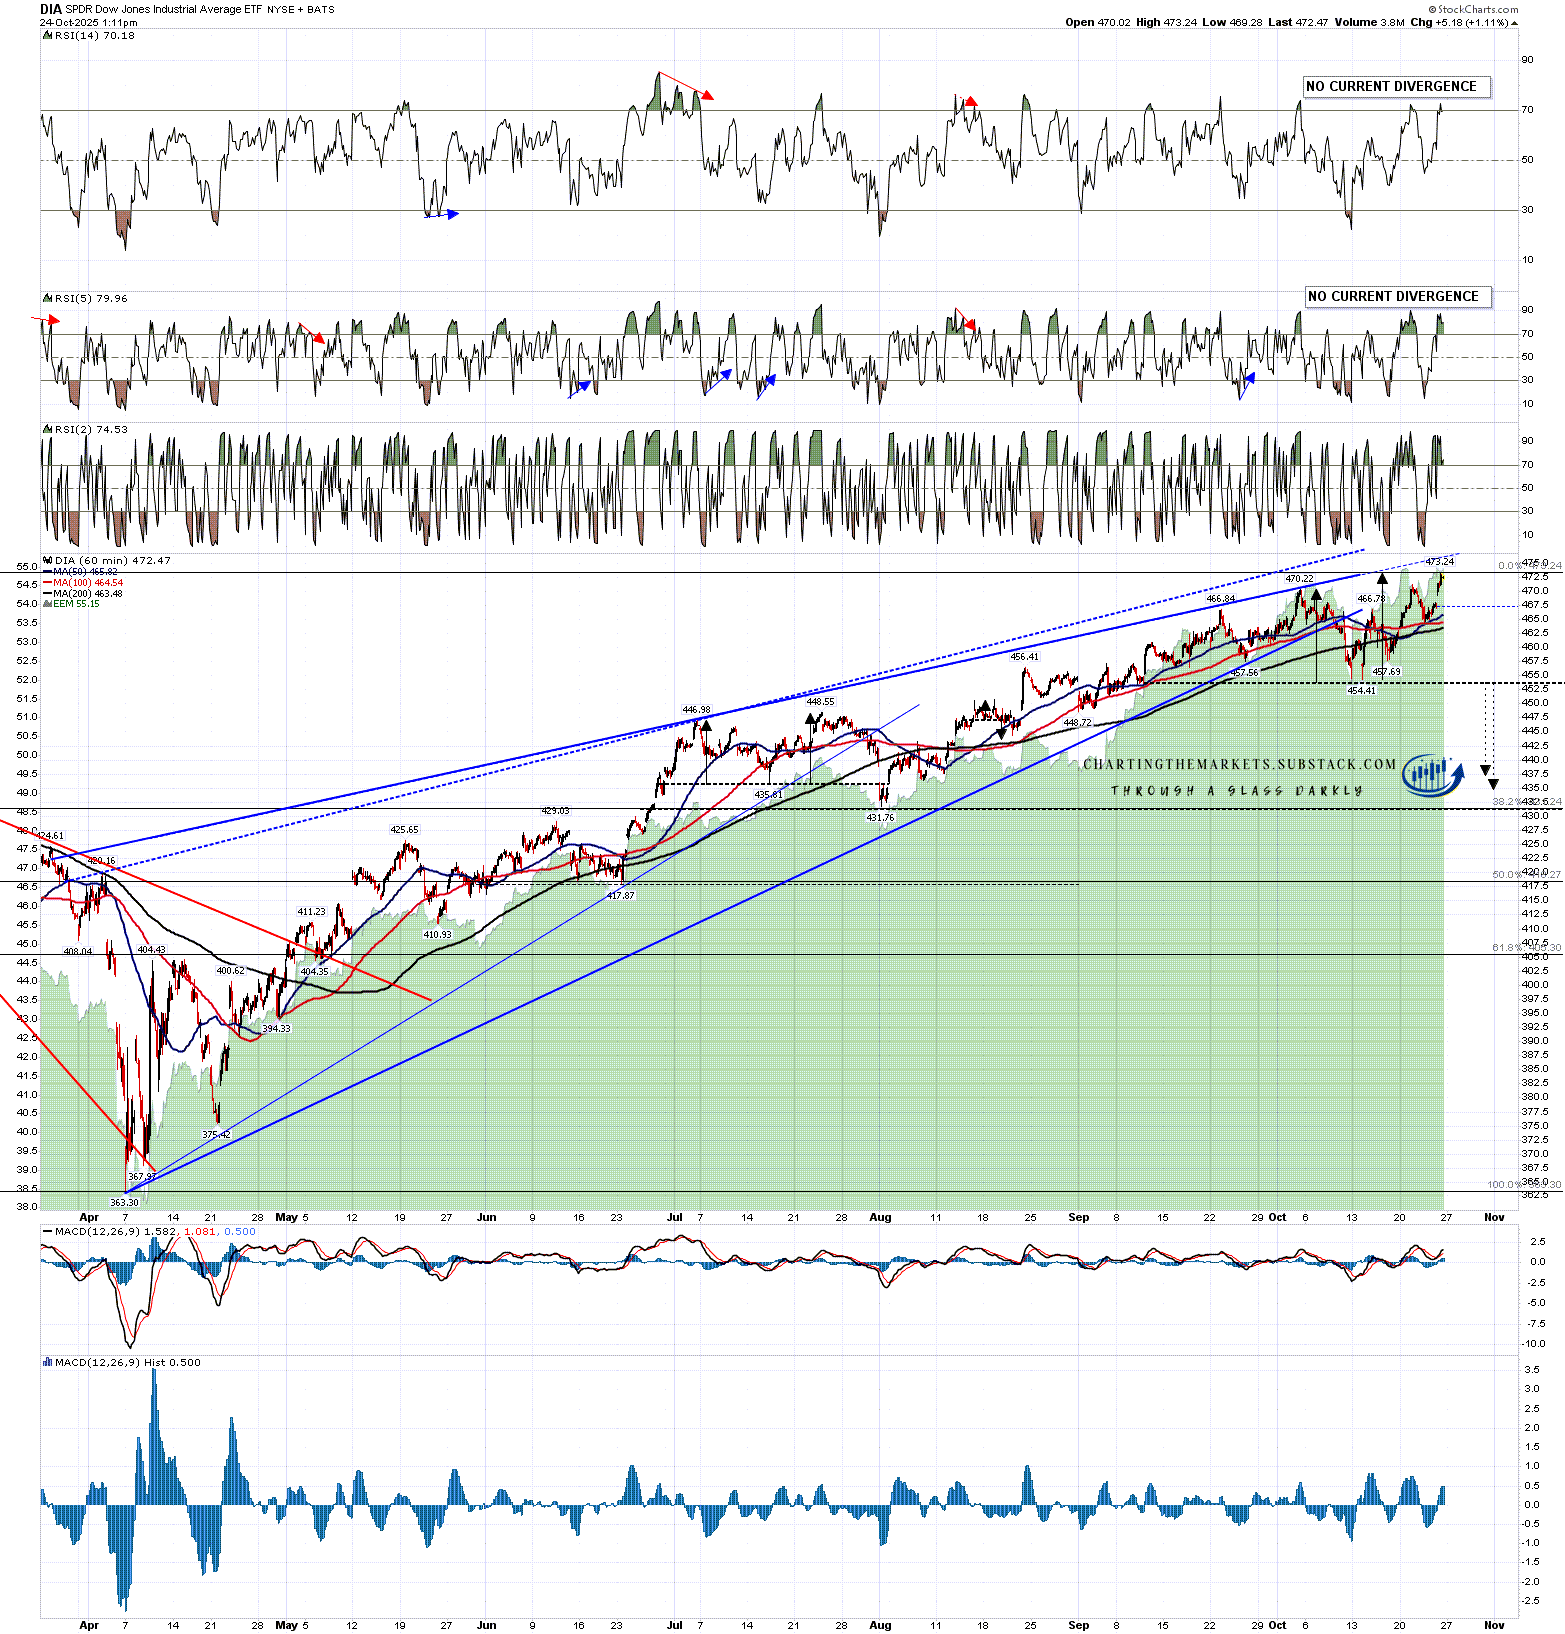
Looking at DIA a new all time high was made a few days ago and another was made today. A good quality double top is now forming. If that breaks down then the target area would be in the 435-437.5 range. There is a good support level and possible H&S neckline in the 432 area.
On the upside, DIA could go higher if an H&S is forming rather than a double top, but I’d note that if the resistance trendline above is hit, currently in the 477 area, then the rising wedge would have expanded and I would redraw the rising wedge support trendline through the most recent low. I’d still be looking for strong resistance at that trendline above or at an even better quality alternate rising wedge resistance trendline that is currently in the 479-80 area.
DIA 60min chart:
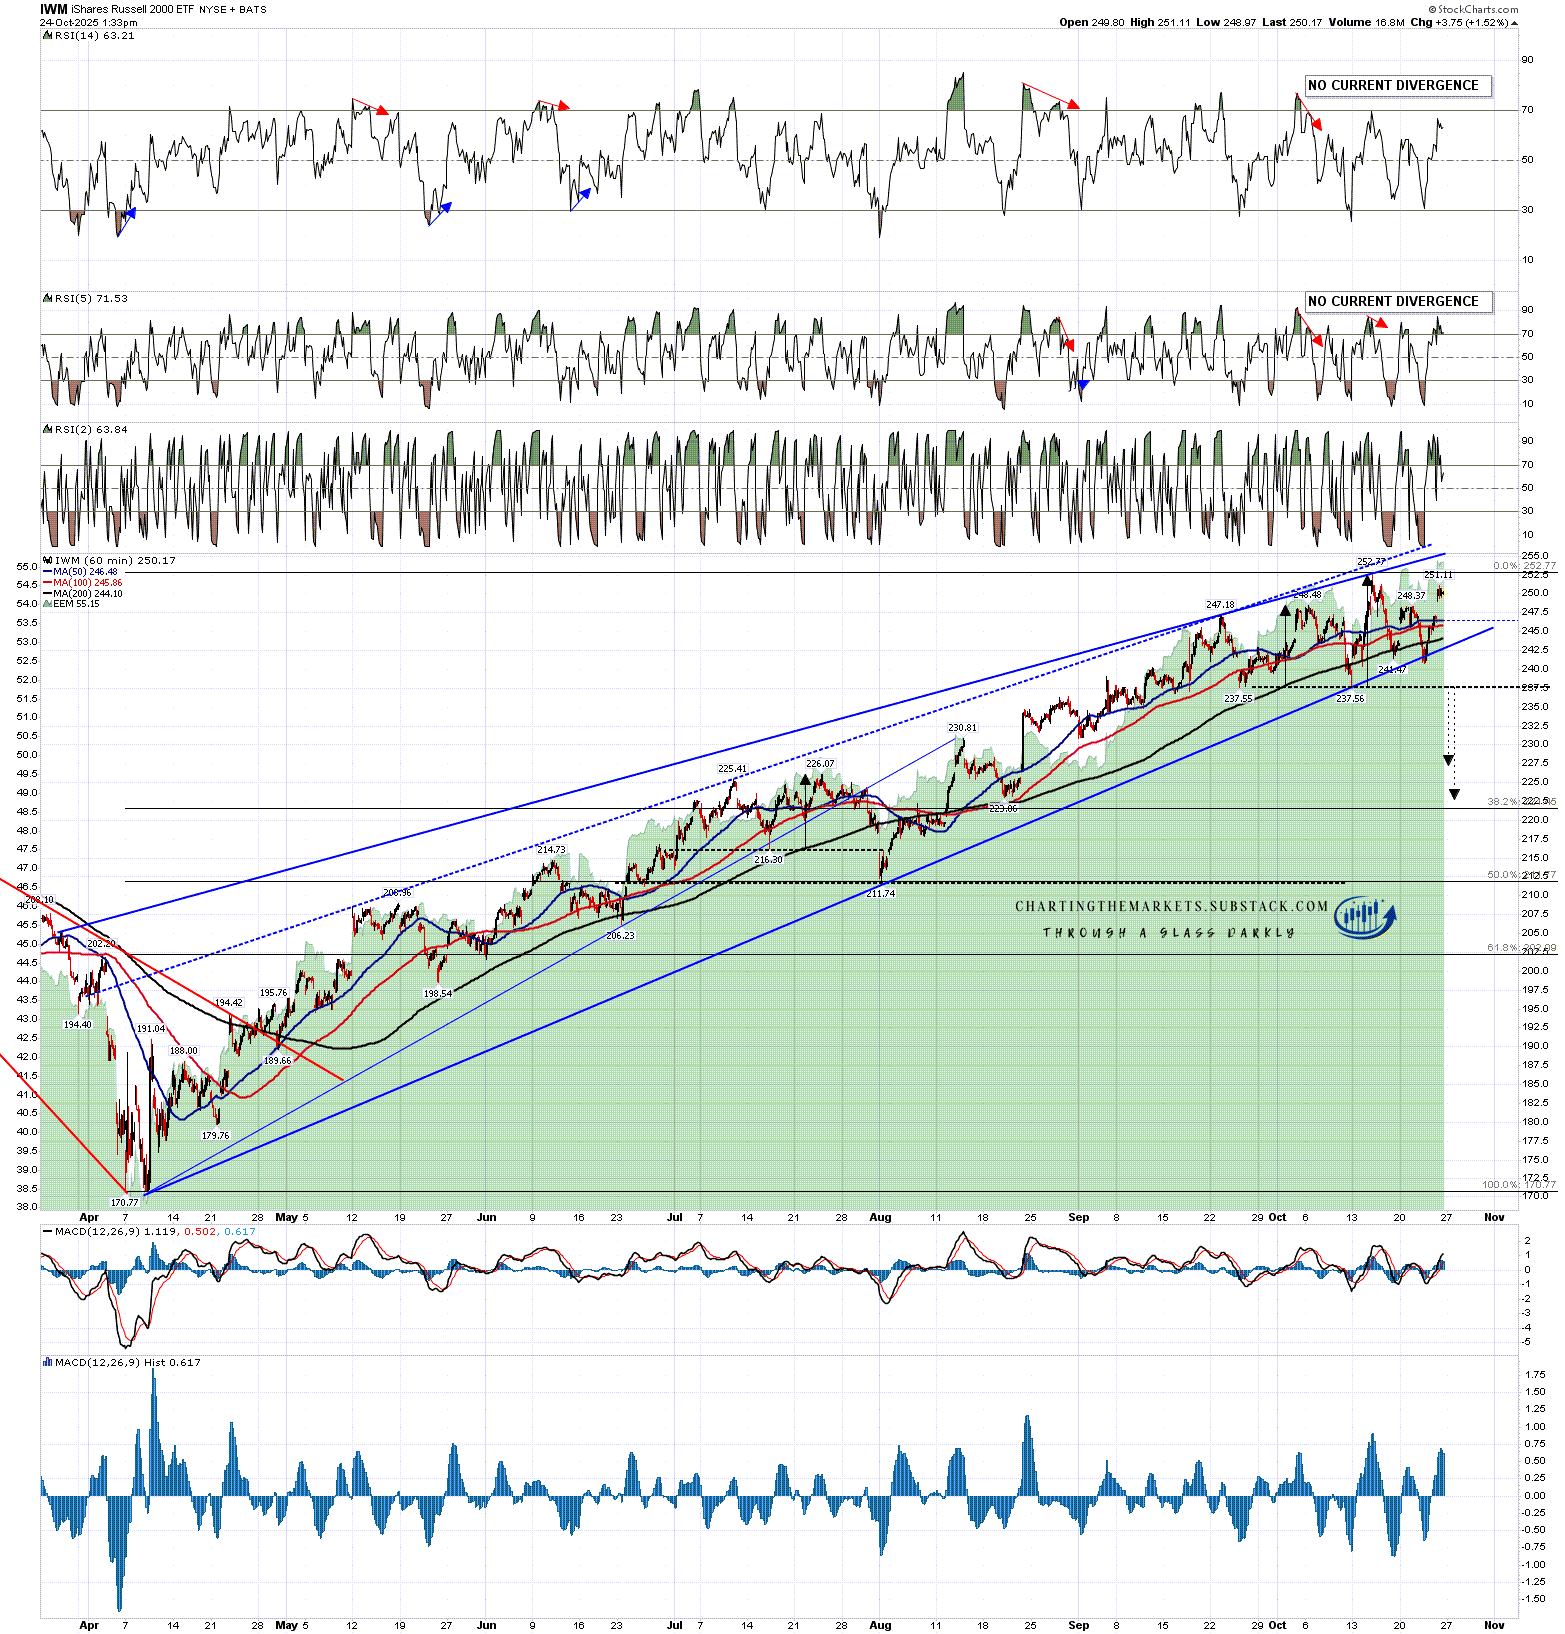
Looking at IWM a new all time high was made last week and another may be made soon. A decent quality double top is now forming. If that breaks down then the target area would be in the 222.5-227.5 range.
On the upside, IWM could go higher if an H&S is forming rather than a double top, but I’d note that if the resistance trendline above is hit, currently in the 255.5 area, then the rising wedge would have expanded and I would redraw the rising wedge support trendline through the most recent low. I’d still be looking for strong resistance at that trendline above or at an even better quality alternate rising wedge resistance trendline that is currently in the 257 area.
IWM 60min chart:
Overall this is a nice looking topping setup, the market backdrop looks promising, and I think this has a good chance of delivering.
The historical stats for next week are also encouraging as they are bearish on Monday, neutral on Tuesday, bearish on Wednesday, bullish on Thursday and neutral on Friday. That gives a significant bearish lean at the start of next week though I would note that the rest of the week and the first week of November then lean strongly bullish.
In the next few days I’ll be looking at the pattern setup for a possible bigger picture high forming here in another post.
If you like my analysis and would like to see more, please take a free subscription at my chartingthemarkets substack, where I publish these posts first. I also do a premarket video every day on equity indices, bonds, currencies, energies, precious commodities and other commodities at 8.45am EST, but only for paying subscribers. Other places to find me are my twitter, and my Youtube channel.
No comments:
Post a Comment