
US stock markets fell hard on Friday after President Trump reacted to new export restrictions on rare earth metals from China with a threat to add a further 100% tariff on imports from China in addition to the 57% tariff currently in force. Trump walked back that threat over the weekend and at the time of writing futures have rallied about 50% of the decline from Friday’s lows before pulling back somewhat.
So what is the rare earths issue about? Well for those who don’t already know, rare earths are vital for a lot of manufacturing of complex machinery such as cars, jet engines, nuclear reactors & LEDs, are also important in oil refining, and are vital for a lot of high tech manufacturing such as computer components, smartphones, high performance batteries etc. There is a good page about rare earths on wikipedia here which is worth a read.
Rare earths are actually not uncommon as components of the earth’s crust, but are spread fairly evenly through the crust, making higher concentrations rare and harder to extract. Many of the viable sources of rare earths are in China and, of the supply outside China, much has been concentrated into the control or ownership of China over the last twenty years so that China now controls about 90% of all rare earths produced worldwide.
The US uses a lot of rare earths and about 70% of rare earths used in the US are imported from China. Most of that 70% can only be sourced from China. Without this supply much of manufacturing in the US, including most high tech manufacturing would be unable to continue. As US has to obtain these rare earths from China this is a very significant bargaining chip for China in the trade negotiations that are likely to happen soon. China is highlighting this bargaining chip by tightening export controls ahead of those talks.
The US has nothing equivalent as a bargaining chip. Threats of higher tariffs are somewhat blunted as tariffs of 57% are already being levied on all chinese goods imported by the US, and looking through the list of all imports from the US to China in 2024, there’s nothing obvious that China can’t fairly easily buy elsewhere. The importance of the US to China is as an export market, and tariffs have already heavily restricted that market, which is something that China will be very keen to change.
Objectively this is a negotiation where the US could significantly slow the chinese economy with embargo level tariffs, but in that event China would likely shut down much of US manufacturing with a rare earths embargo, while the US would also be raising costs a lot for US consumers in the run up to Xmas. There is every reason to think that this negotiation will be successfully concluded well before then, and my expectation would be that tariffs on chinese goods will likely come down considerably from the current 57%. China will also likely throw the US a bone as part of that deal by buying some grains from US farmers including soybeans, though as with most of the other goods imported from the US by China, there’s no obvious reason to think that they can’t easily buy those elsewhere.
Overall this looks like a storm in a teacup, and the US looks very strongly incentivised to secure a trade deal with China at the earliest opportunity. The flexing by China is likely just a pointed reminder from them that in those trade negotiations they are holding some very powerful cards.
Are there bigger issues on US stock markets? Yes, valuations are eye-wateringly high by historical standards, and AI is looking a lot like the tech bubble in the late 1990s, with huge valuations and spending plans anchored to some currently very thin income streams, but there’s not a lot suggesting that bubble is bursting yet.
The current US government shutdown is also looking like it may last a few weeks, with no current negotiations in progress to end it, and the longer that continues the more likely it is that may destabilise US equity markets, particularly if the administration uses this period to further gut federal employment.
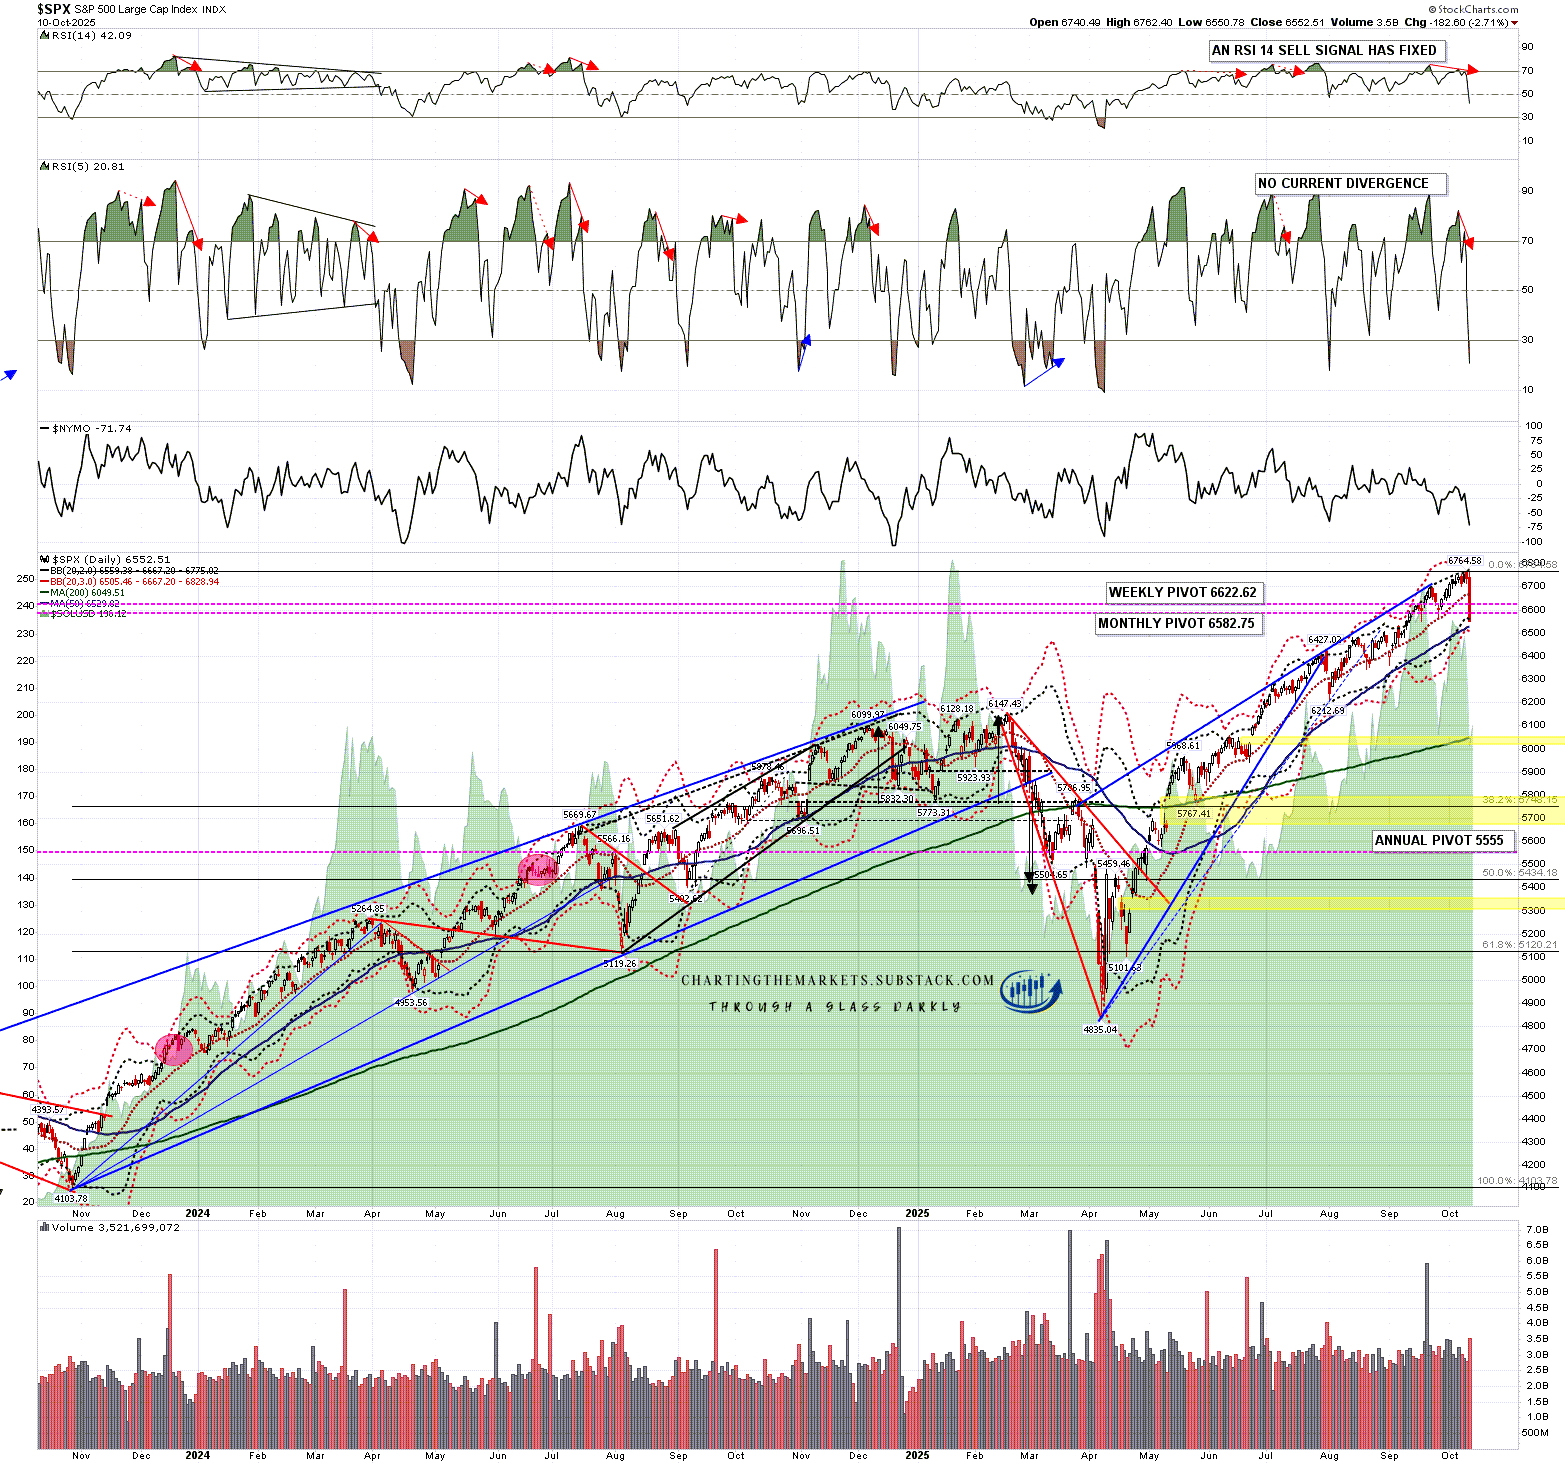
In my last post a week ago on Monday 6th October I was looking at the negative divergences on SPX and QQQ, with daily RSI 14 and RSI 5 sell signals brewing on both of those. All of those fixed on Friday, with both RSI sell signals also reaching target on Friday. There are now daily RSI 14 sell signals fixed on SPX, QQQ, DIA and (weaker signal) IWM. This is suggesting a larger retracement soon to reach those targets.
In my last post I was also saying that until we saw some strong breaks below the daily middle bands on US indices they are remained in a strong uptrend from the April low. On Friday they all broke hard below their daily middle bands so are all now in a possible topping process for larger retracements than the ones we saw on Friday.
On SPX Friday’s low and close were below the daily lower band at 6559.38 and there is a possible H&S forming, though not of high quality. If so the ideal right shoulder high would be in the 6700 area, and the H&S target on a break down from there would be in the 6325 area. Alternatively a retest of the all time high could set up a double top which would be a higher quality topping pattern.
SPX daily chart:
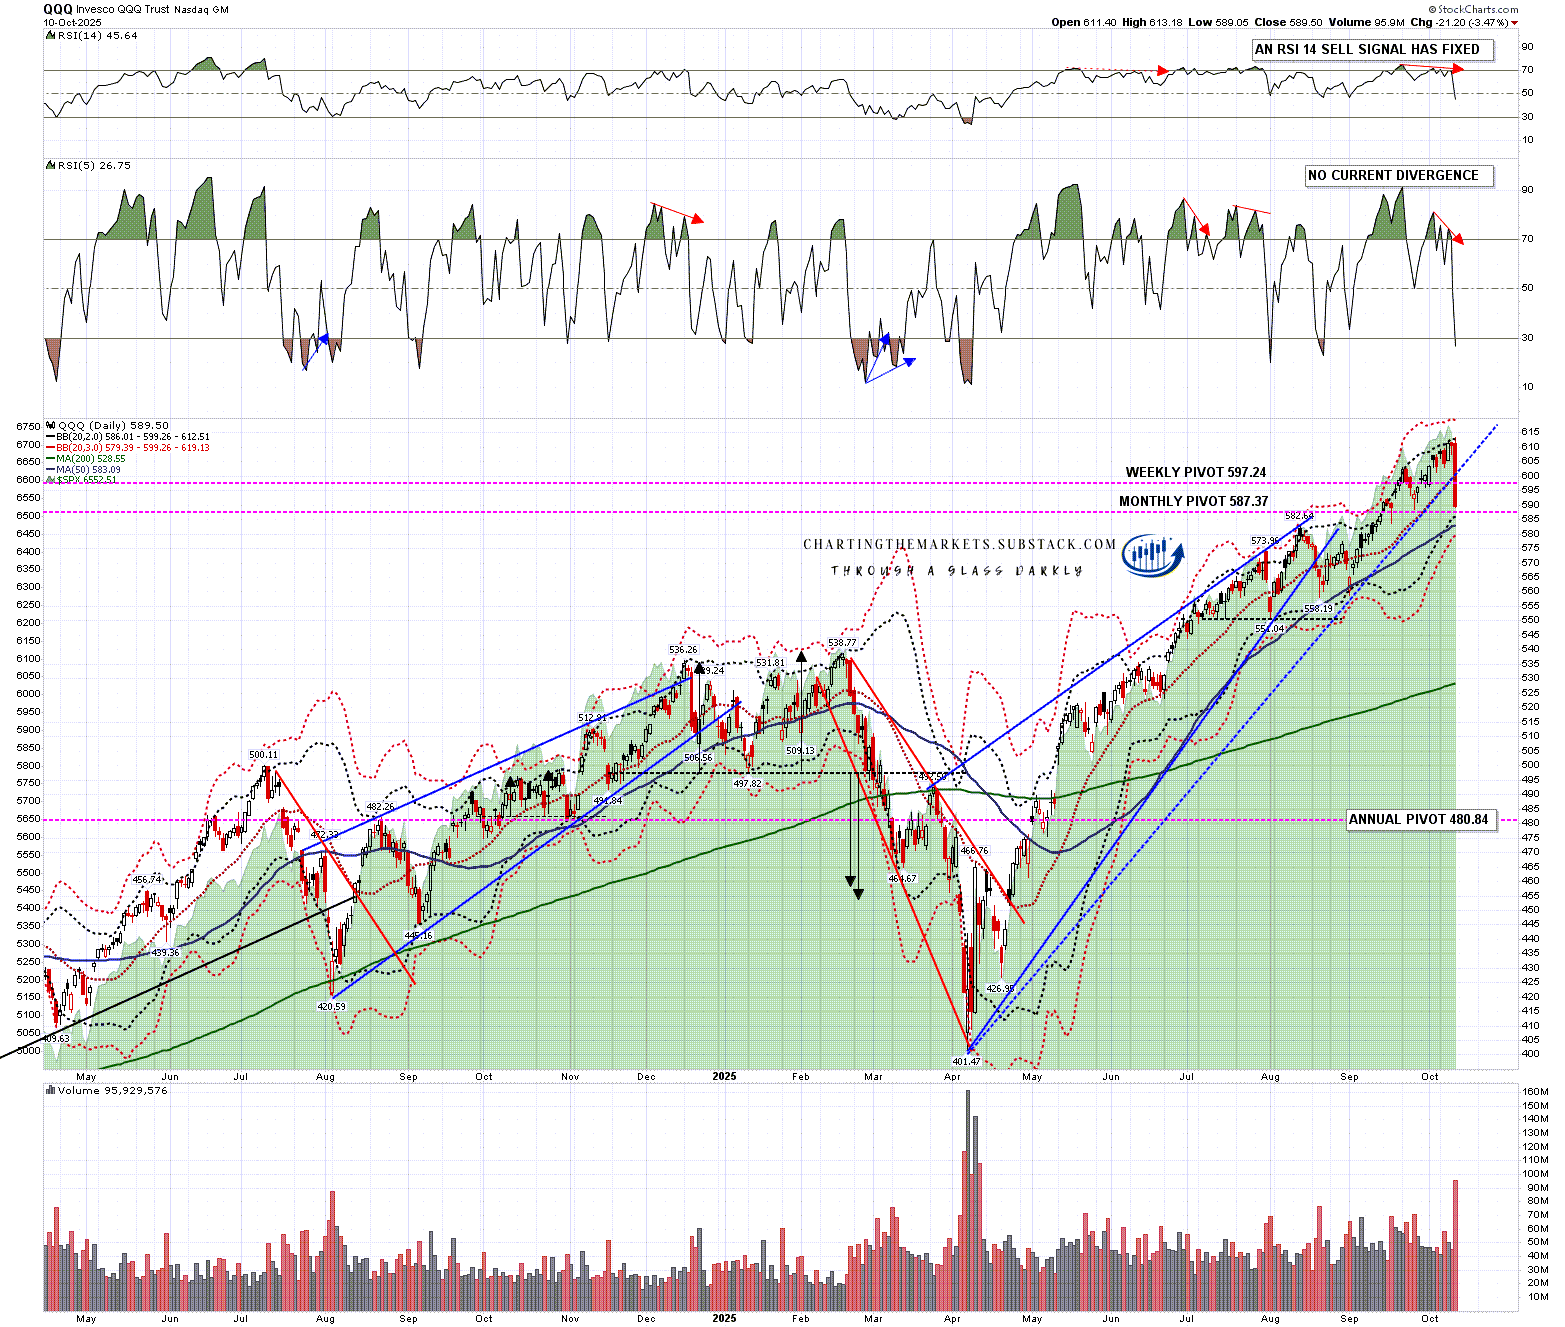
On QQQ Friday’s low approached but didn’t hit the daily lower band at 586.01 and there is a better quality H&S setup that could be forming. If so the ideal right shoulder high would be in the 603 area, and the H&S target on a break down from there would be in the 567 area. Alternatively a retest of the all time high could set up a double top.
QQQ daily chart:
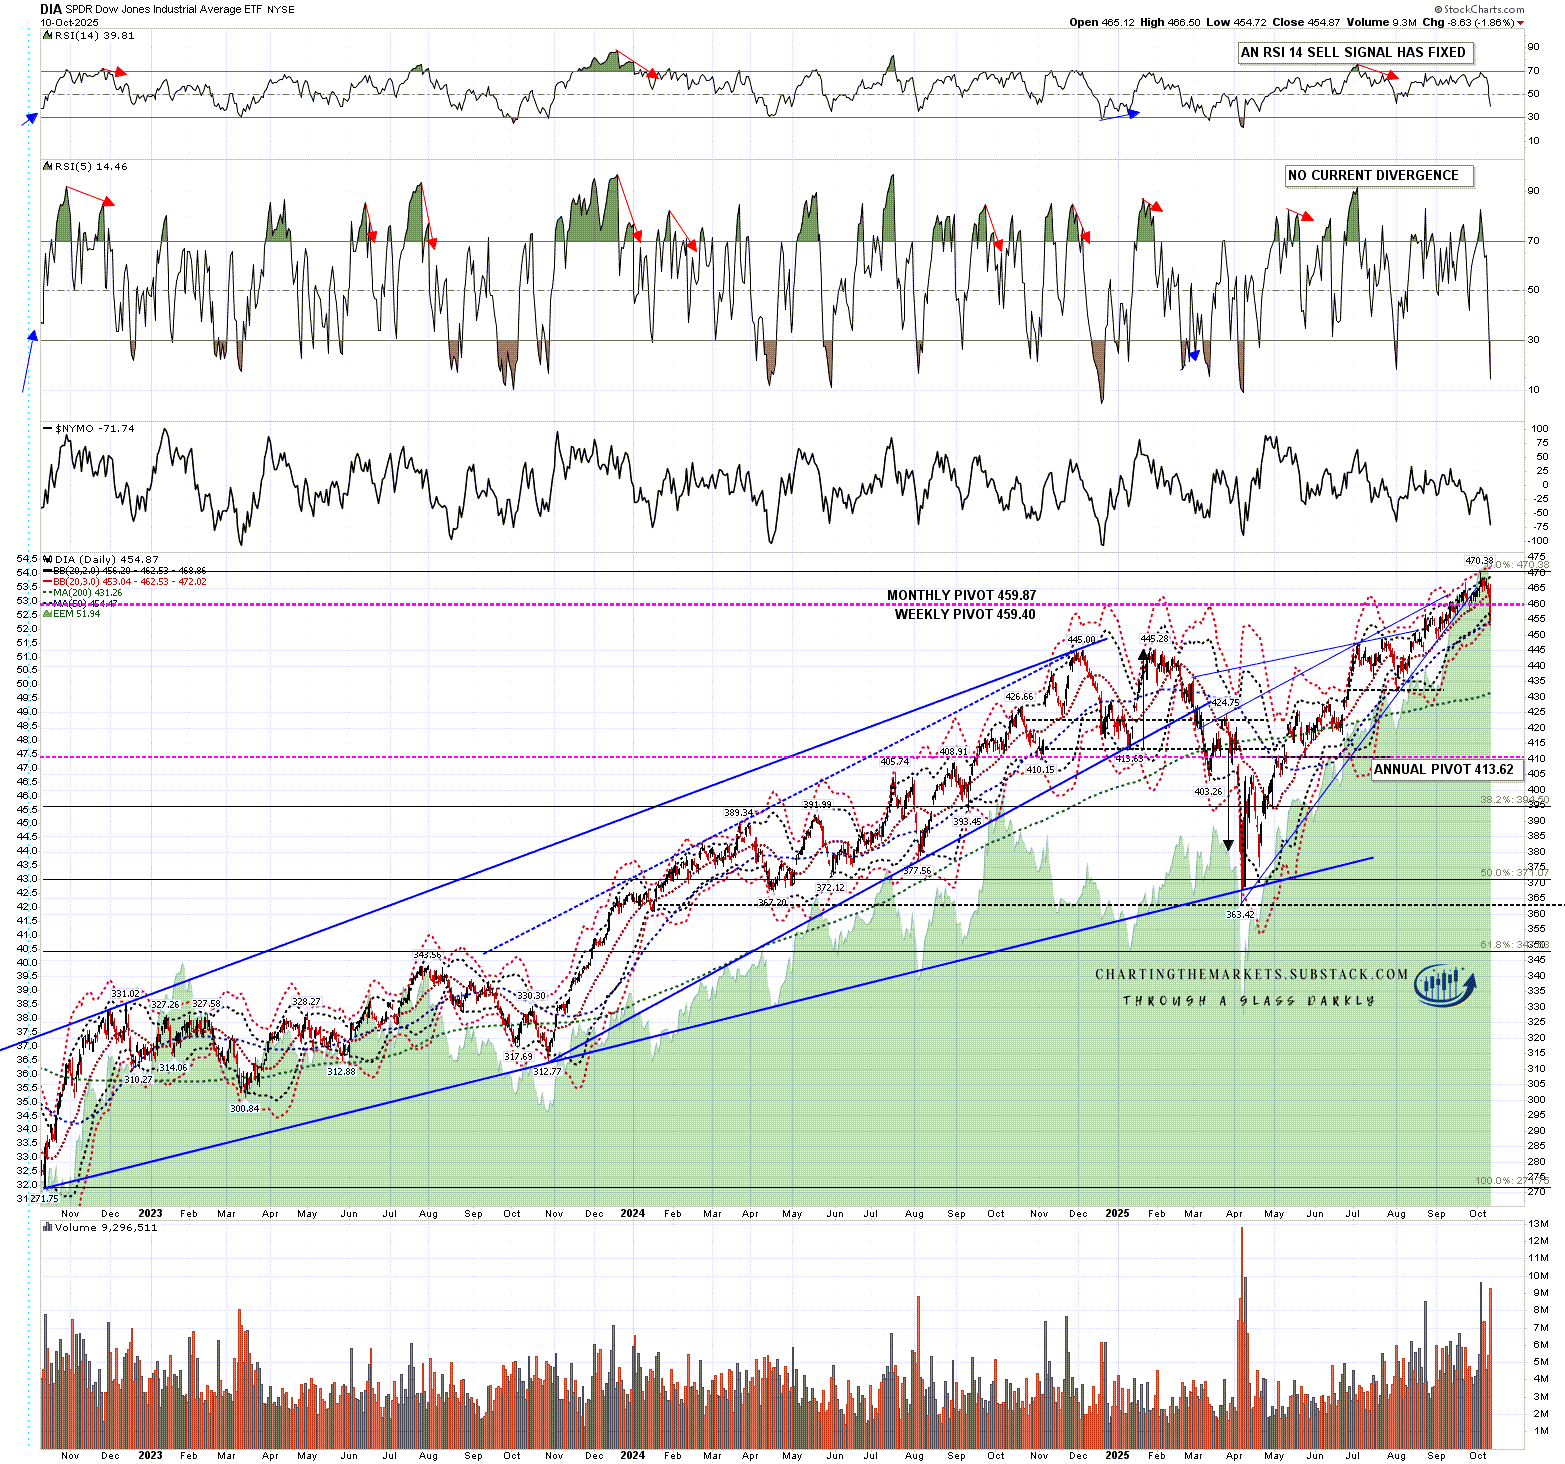
On DIA Friday’s low and close were just above the the daily 3sd lower band at 453.04, and there is a possible H&S forming, though not of high quality. If so the ideal right shoulder high would be in the 467 area, and the H&S target on a break down from there would be in the 440 area. Alternatively a retest of the all time high could set up a double top which would be a higher quality topping pattern.
DIA daily chart:
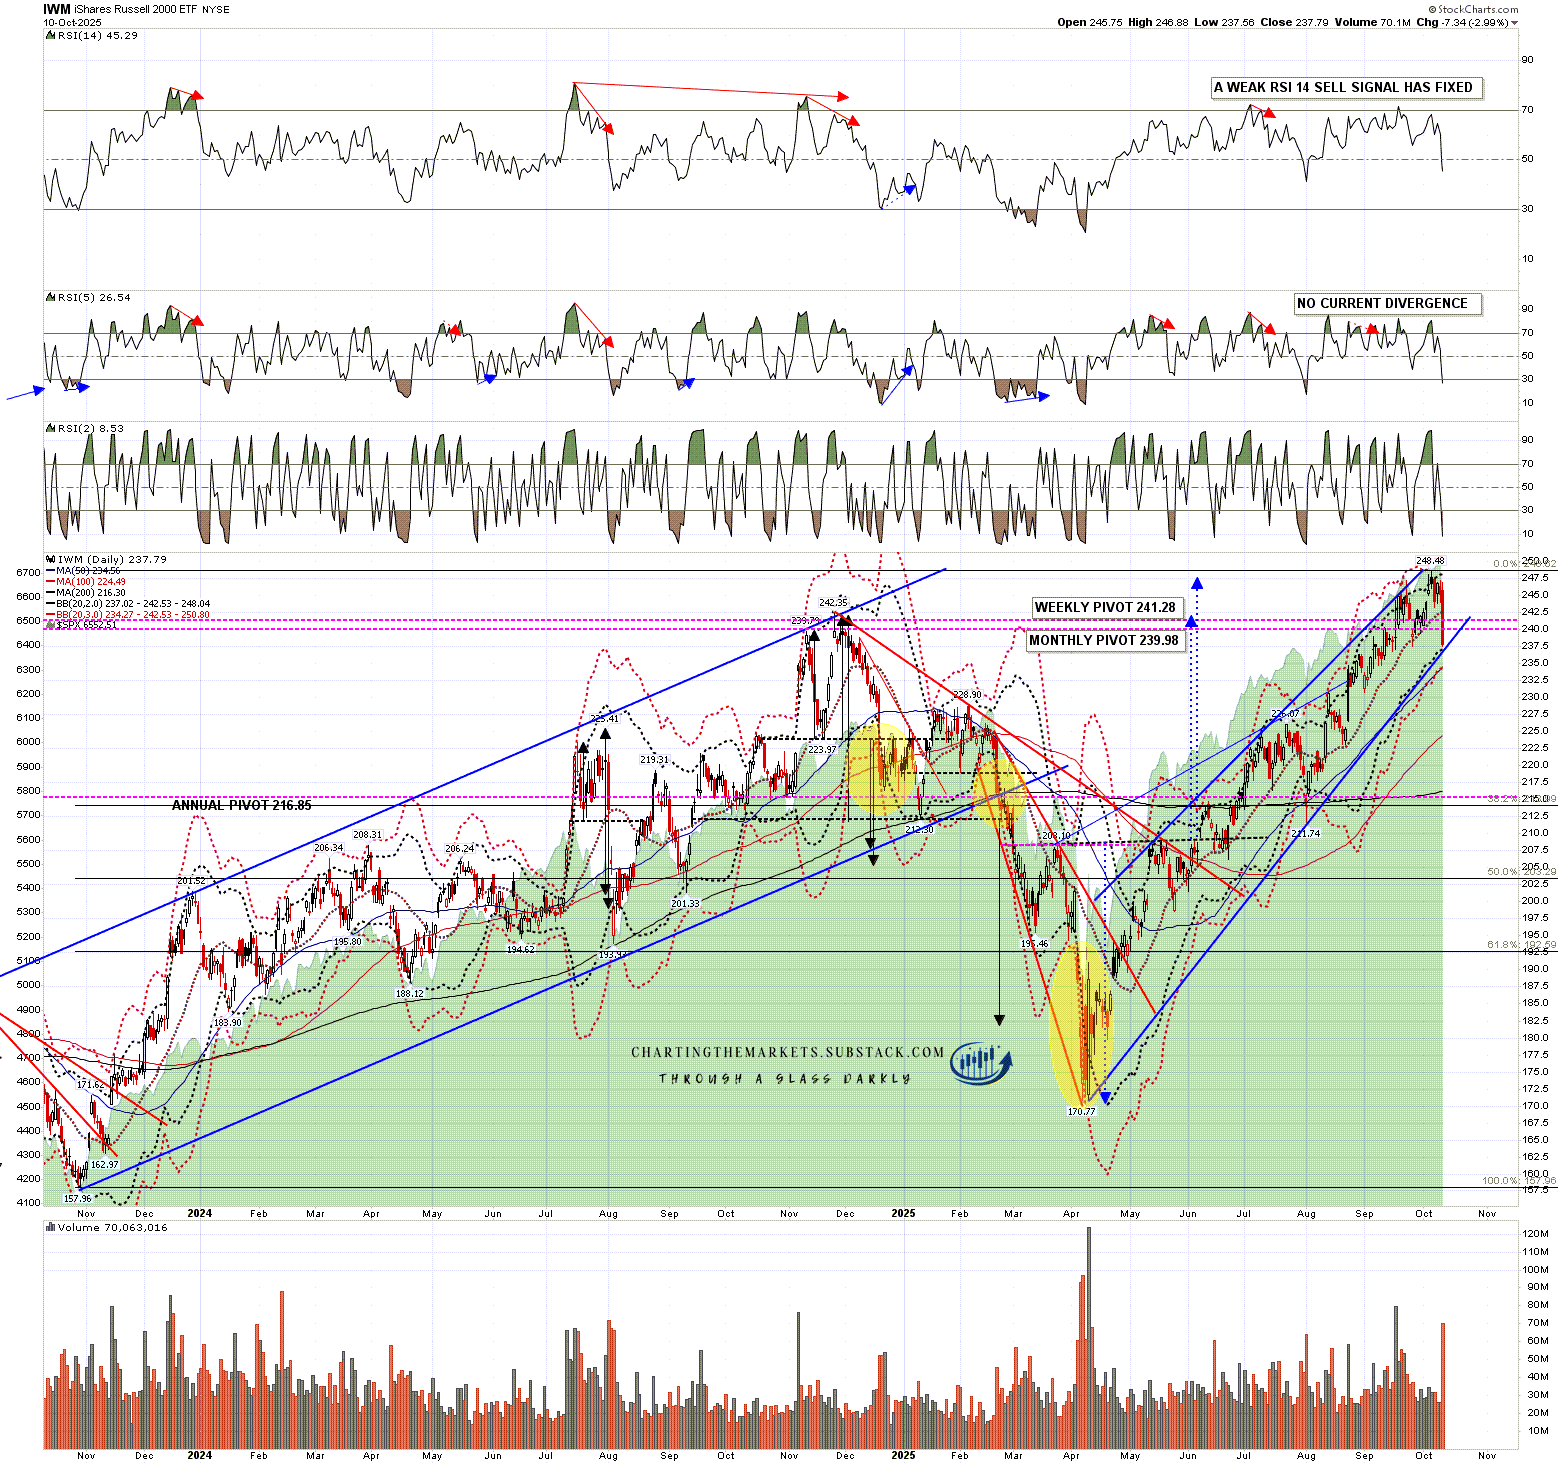
On IWM Friday’s low and close were just above the the daily lower band at 242.53, and there is a decent quality possible H&S forming. If so the ideal right shoulder high would be in the 247.50 area, and the H&S target on a break down from there would be in the 226.50 area. That’s largely irrelevant though as there is already a high quality double top formed that on a sustained break below Friday’s lows would look for a target in the 226.50 to 227.50 range.
IWM daily chart:
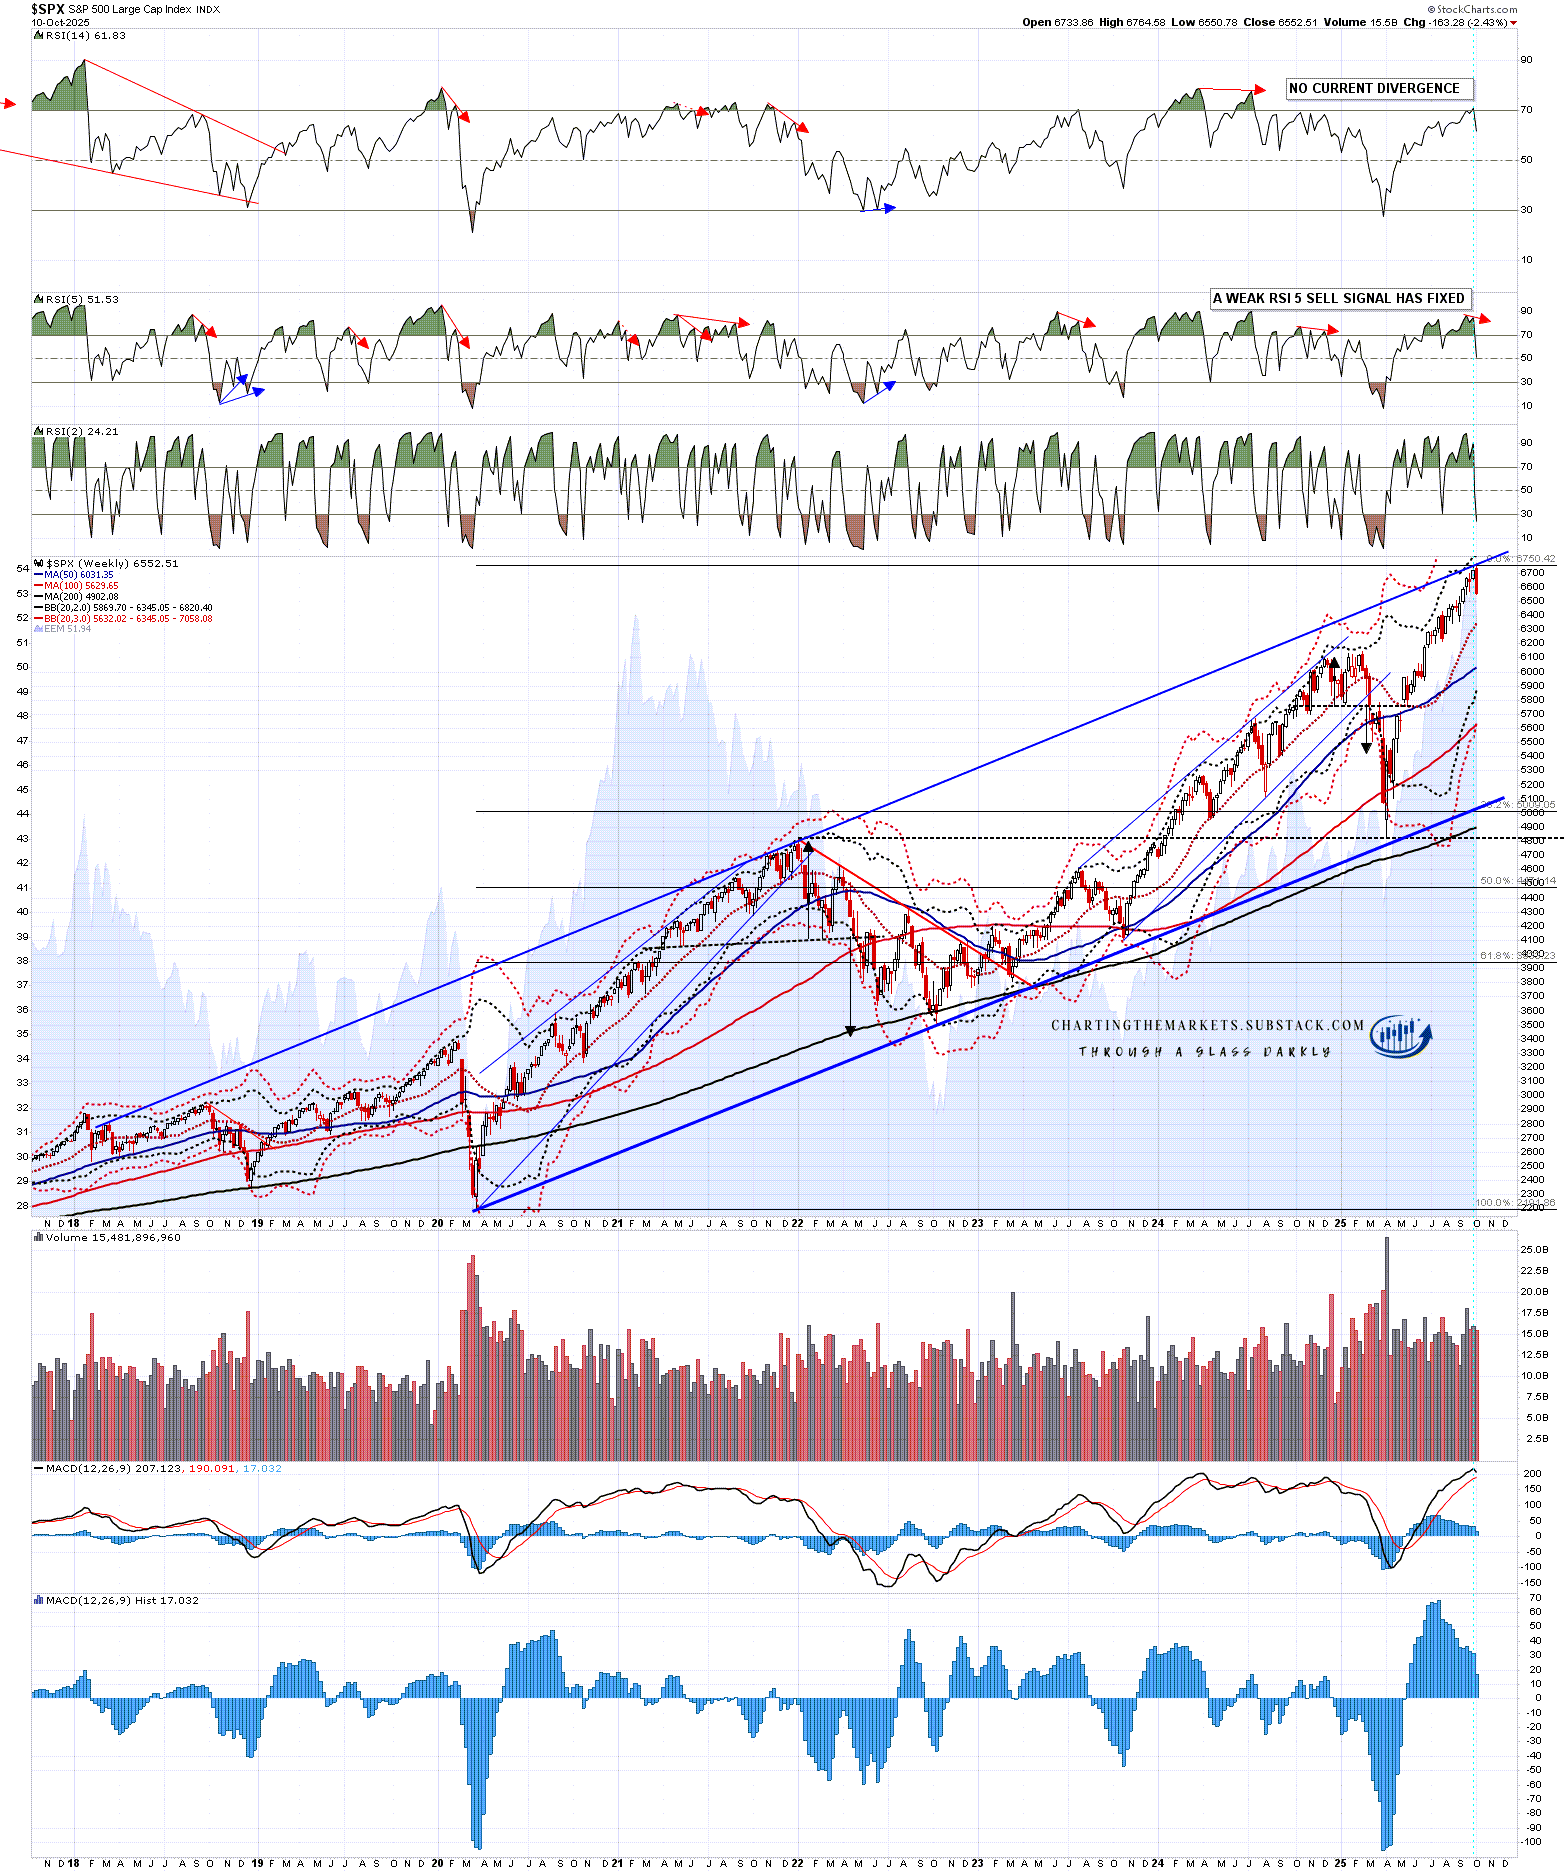
If we do see a larger retracement then the obvious target area would be the next big trend support level at the weekly middle bands, which on SPX closed at 6345.05, just above the target area I was looking at above. All of the weekly middle bands on these four equity indices are a reasonable match with the downside targets I have been looking at above.
SPX weekly chart:
We saw a significant crack in this uptrend on Friday and there is a decent case, with the daily RSI 14 sell signals fixed on all four of these indices, for seeing a larger retracement soon. I’ll be watching that closely.
If we do see that larger retracement then my lean would be to start another leg up from that low into December though there is a case that a much bigger high is getting close. I’ll be looking at that case in another post later this week.
In terms of the historical stats this week they lean neutral to bearish today, neutral to bullish tomorrow and Wednesday, 71% bullish on Thursday and neutral to bullish on Friday. Overall a neutral week with a modestly bullish lean.
If you like my analysis and would like to see more, please take a free subscription at my chartingthemarkets substack, where I publish these posts first. I also do a premarket video every day on equity indices, bonds, currencies, energies, precious commodities and other commodities at 8.45am EST, but only for paying subscribers. Other places to find me are my twitter, and my Youtube channel.
No comments:
Post a Comment