
In my post on Monday 6th October I was looking at the negative divergences on SPX and QQQ, with daily RSI 14 and RSI 5 sell signals brewing on both of those. All of those daily sell signals fixed last Friday, with both RSI sell signals also reaching target on Friday. There are now daily RSI 14 sell signals fixed on all of SPX, QQQ, DIA and (weaker signal) IWM. This is suggesting a larger retracement soon to reach those targets.
I was also saying then that until we saw some strong breaks below the daily middle bands on US indices they remained in a strong uptrend from the April low. On Friday they all broke hard below their daily middle bands. Since then SPX and DIA have backtested the daily middle bands but failed to break above, and QQQ and IWM have broken back above but are currently back below at the time of writing. Unless that changes that larger retracement may already be in progress.
In my post on Monday 13th October I was looking at Friday’s decline and weighing the short term risk to equity markets of the China trade disputes and the government shutdown.
On the China dispute I was saying that China clearly held the much stronger negotiating position due to their control of the vitally important rare earths market, so the US was likely to be keen to make a deal, but so far there’s little sign of that on the US side and tariffs are still scheduled to be raised 100% on China at the end of this month as Trump threatens online that the US may stop buying chinese cooking oil (?). That seems akin to the US bringing a wok to a gunfight but if this escalates further that will likely impact markets.
There is another things to mention here. There is no current trade war with China from the US perspective, but from China’s perspective they have now been in a trade war with the US for much of the year, with US tariffs on chinese goods already at an eye-watering minimum 57%. They want to bring that down, they feel that they have a strong hand in negotiations and objectively they’re right about that.
If the US imposes draconian further tariffs on China then they will likely dig in and wait it out. China doesn’t have to worry about elections, and they have already experiencing much of the pain from higher tariffs for much of this year. From the US perspective the shops may be looking thinly and very expensively stocked for Xmas, the main shopping event of the year, and voters may well get angry about that. If China cuts off rare earth exports to the US in retaliation then once current stocks run out, a lot of US manufacturing may also have to shut down.
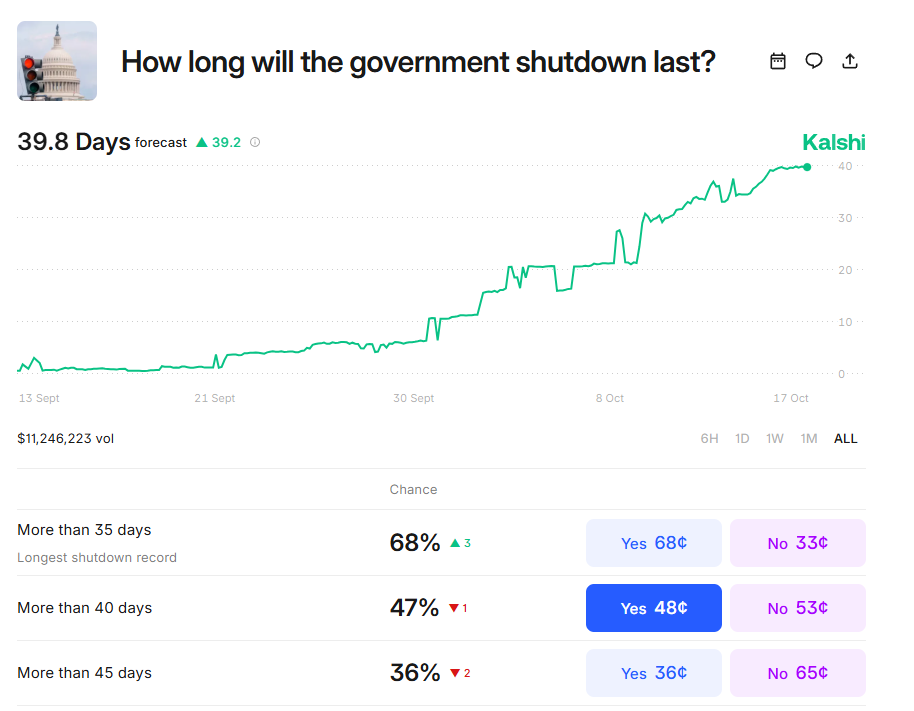
On the government shutdown front that is also not looking great, with the last negotiations on ending this, if those can be described as negotiations, at the start of October. The chart below is from Kalshi today with even odds currently on the shutdown lasting another 39.8 days, past Thanksgiving.
If seen that would not only exceed the current record set by the second government shutdown in Trump’s first term at 35 days, but would also equal the total days of all other government shutdowns ever (only seen in their current form since 1980), excluding that last Trump shutdown, at 56 days. There’s a good page on these at wikipedia here, and this is also the first shutdown ever to happen when the same party controlled the White House and both houses of Congress.
None of this looks bullish short term.
Kalshi Government Shutdown Odds:
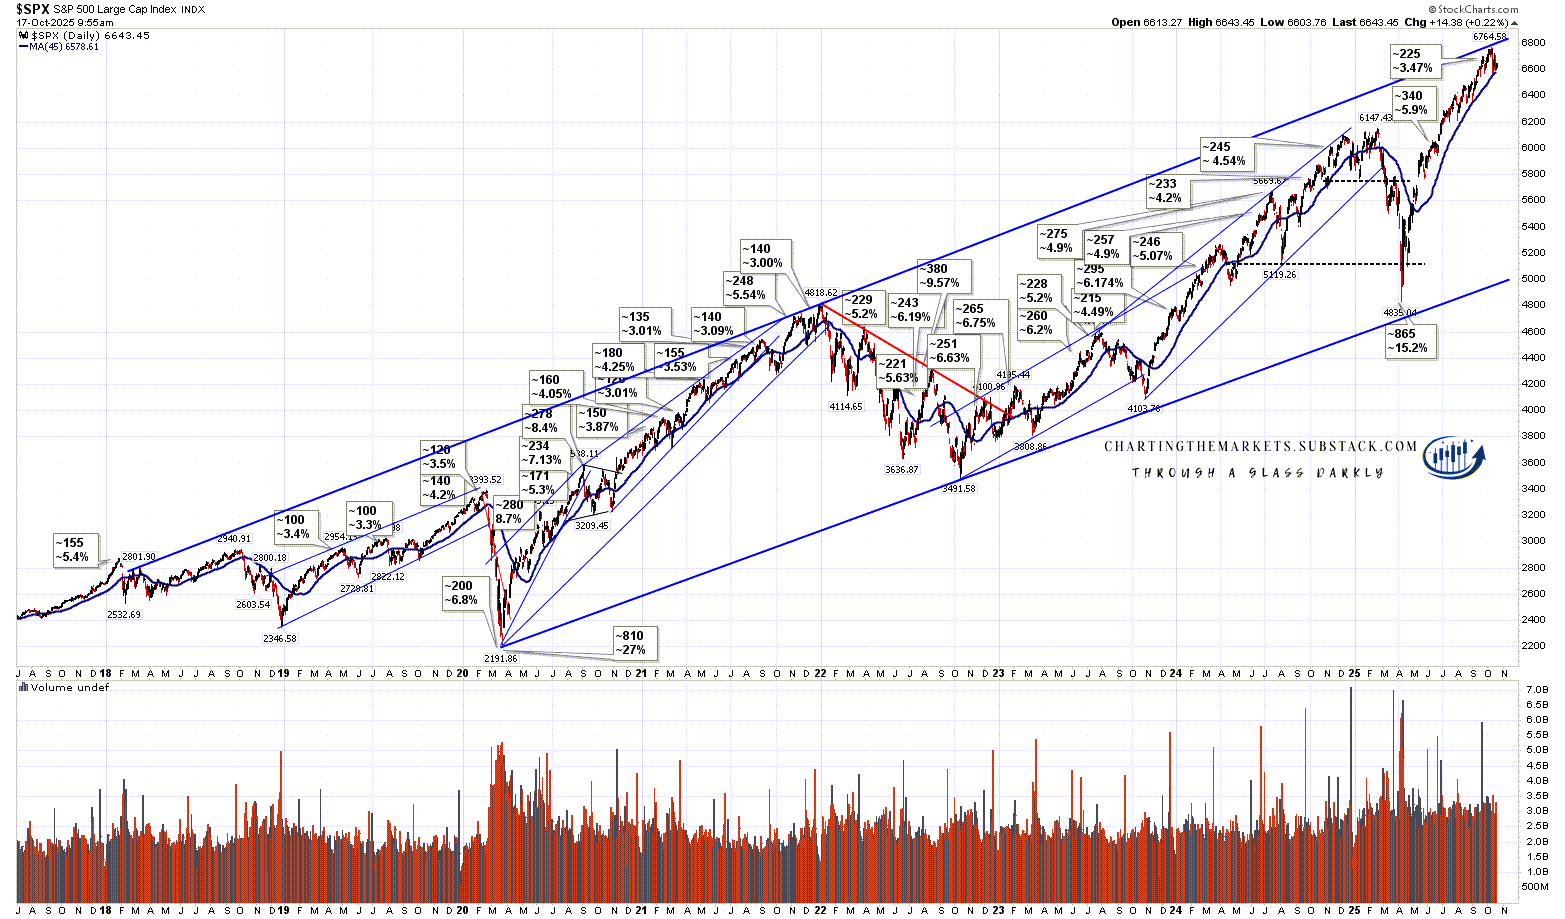
In my last post on Tuesday 14th October I was looking at the possible topping patterns forming on US indices and they are mostly still looking pretty good. I’ll review those but first I’ll show my SPX daily chart vs the 45dma. This is my reversion to the mean chart and the low on Friday was a close to perfect backtest of the 45dma. This is the second backtest since the break back above in late April and this is a very obvious level to reject back into high retests. We may still see this hold as support but a break below would be the first such break since the April low.
If we do see a significant break below the 45dma that may well be a sign that a larger top is near. I would suggest you look at the late 2022 high and the early 2025 high on the chart below as examples where a break below the 45dma was the first step in forming large double tops that then delivered a technical bear market decline of more than 20%.
SPX daily vs 45dma chart:
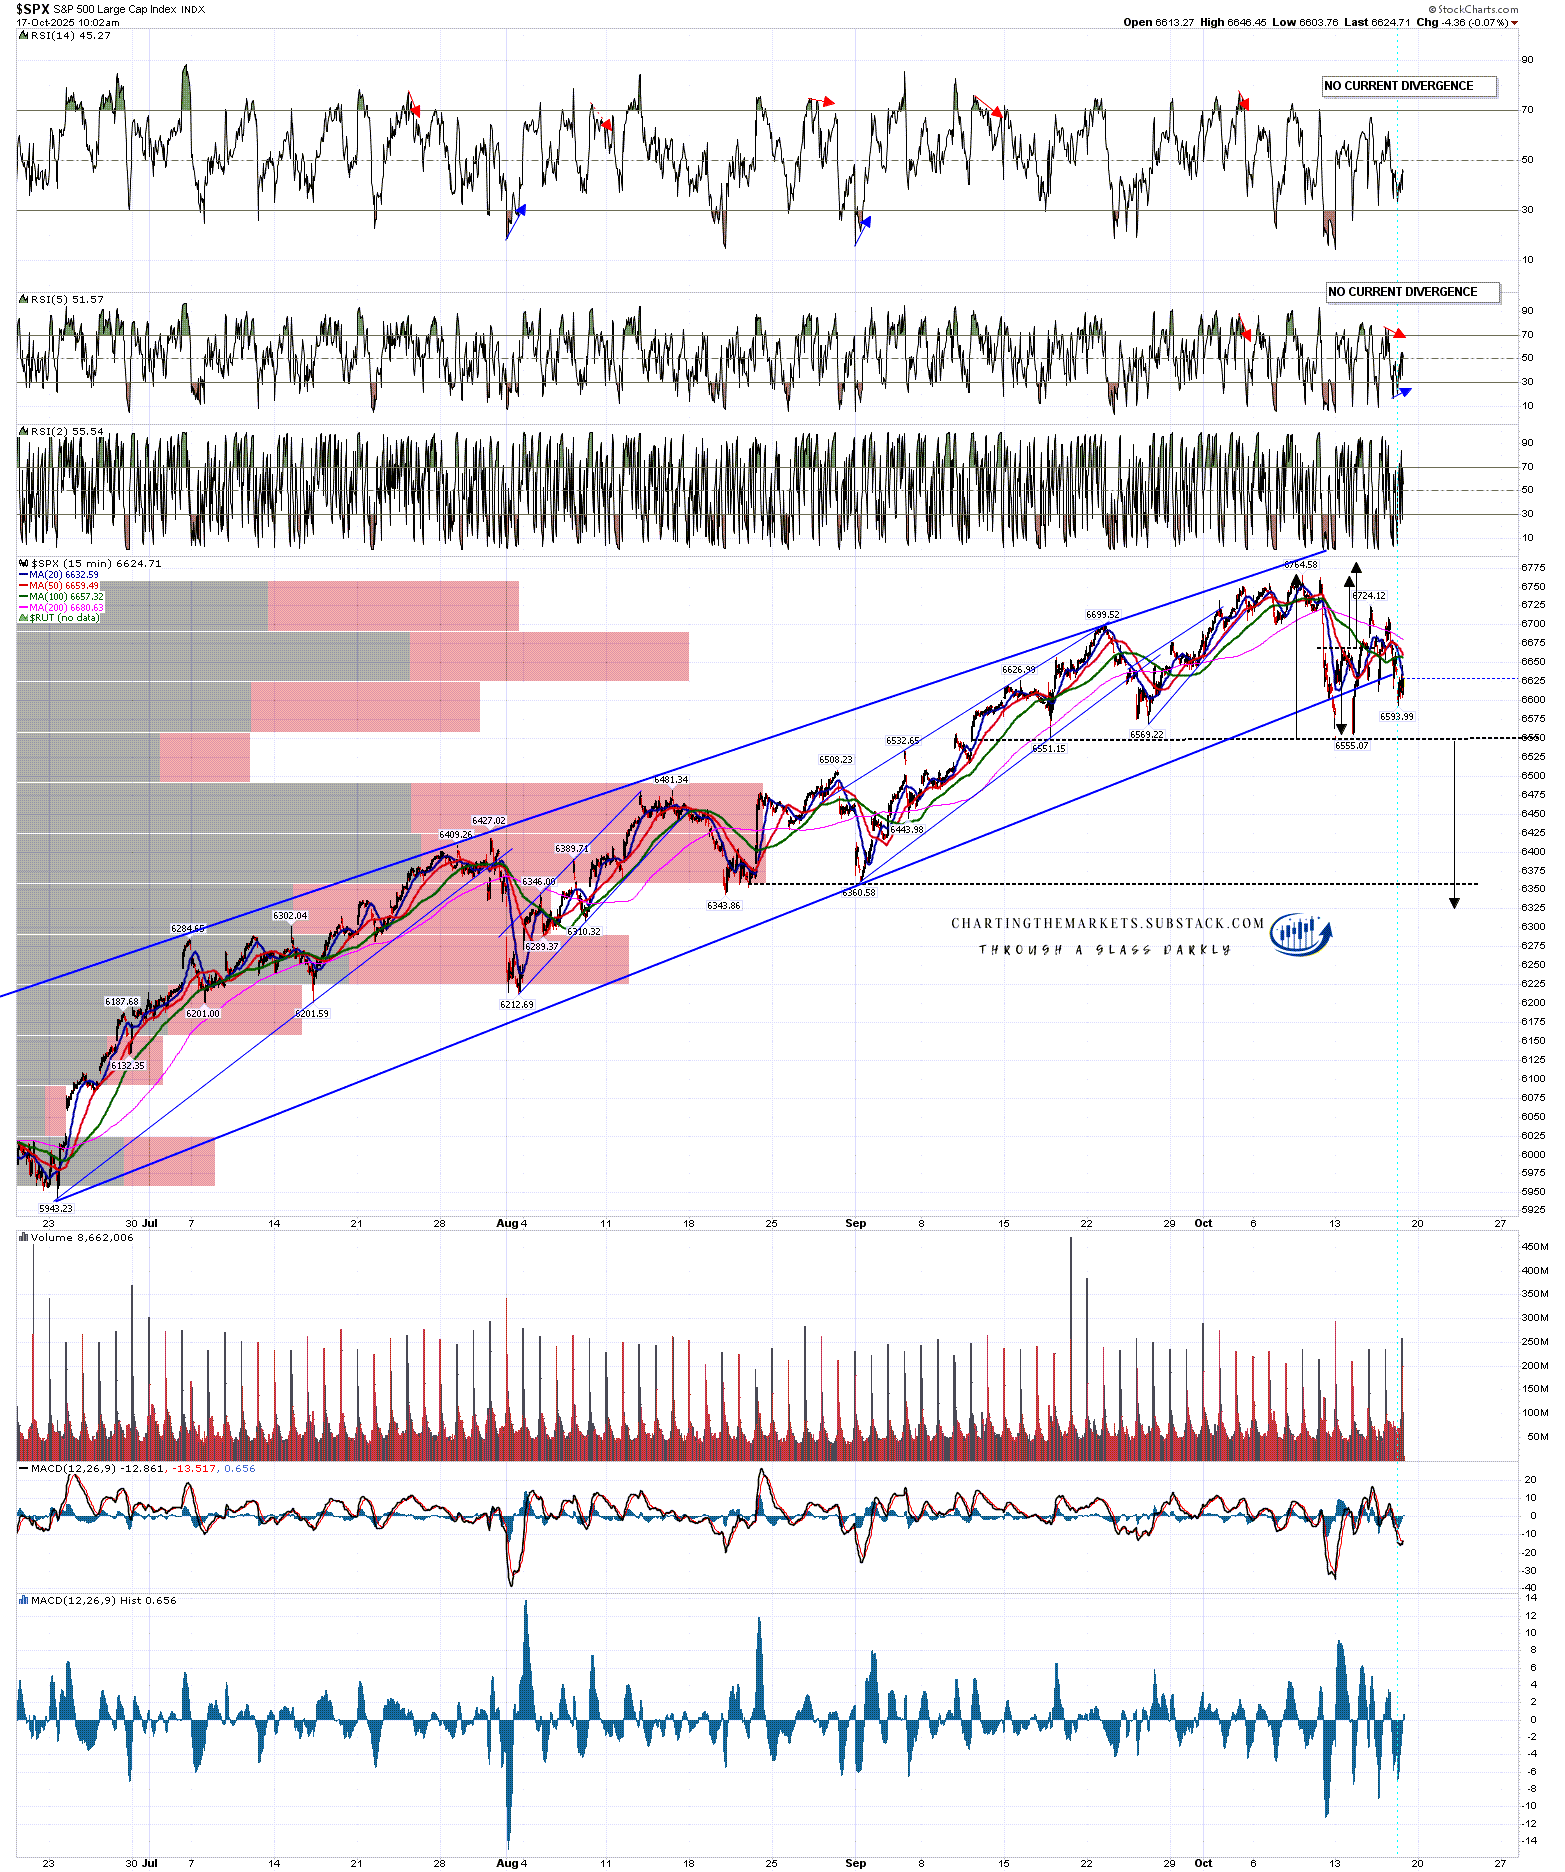
On SPX the H&S I posted on Tuesday as a possibility is still looking good. A sustained break below the neckline would look for a target in the 6325 area.
SPX 15min chart:
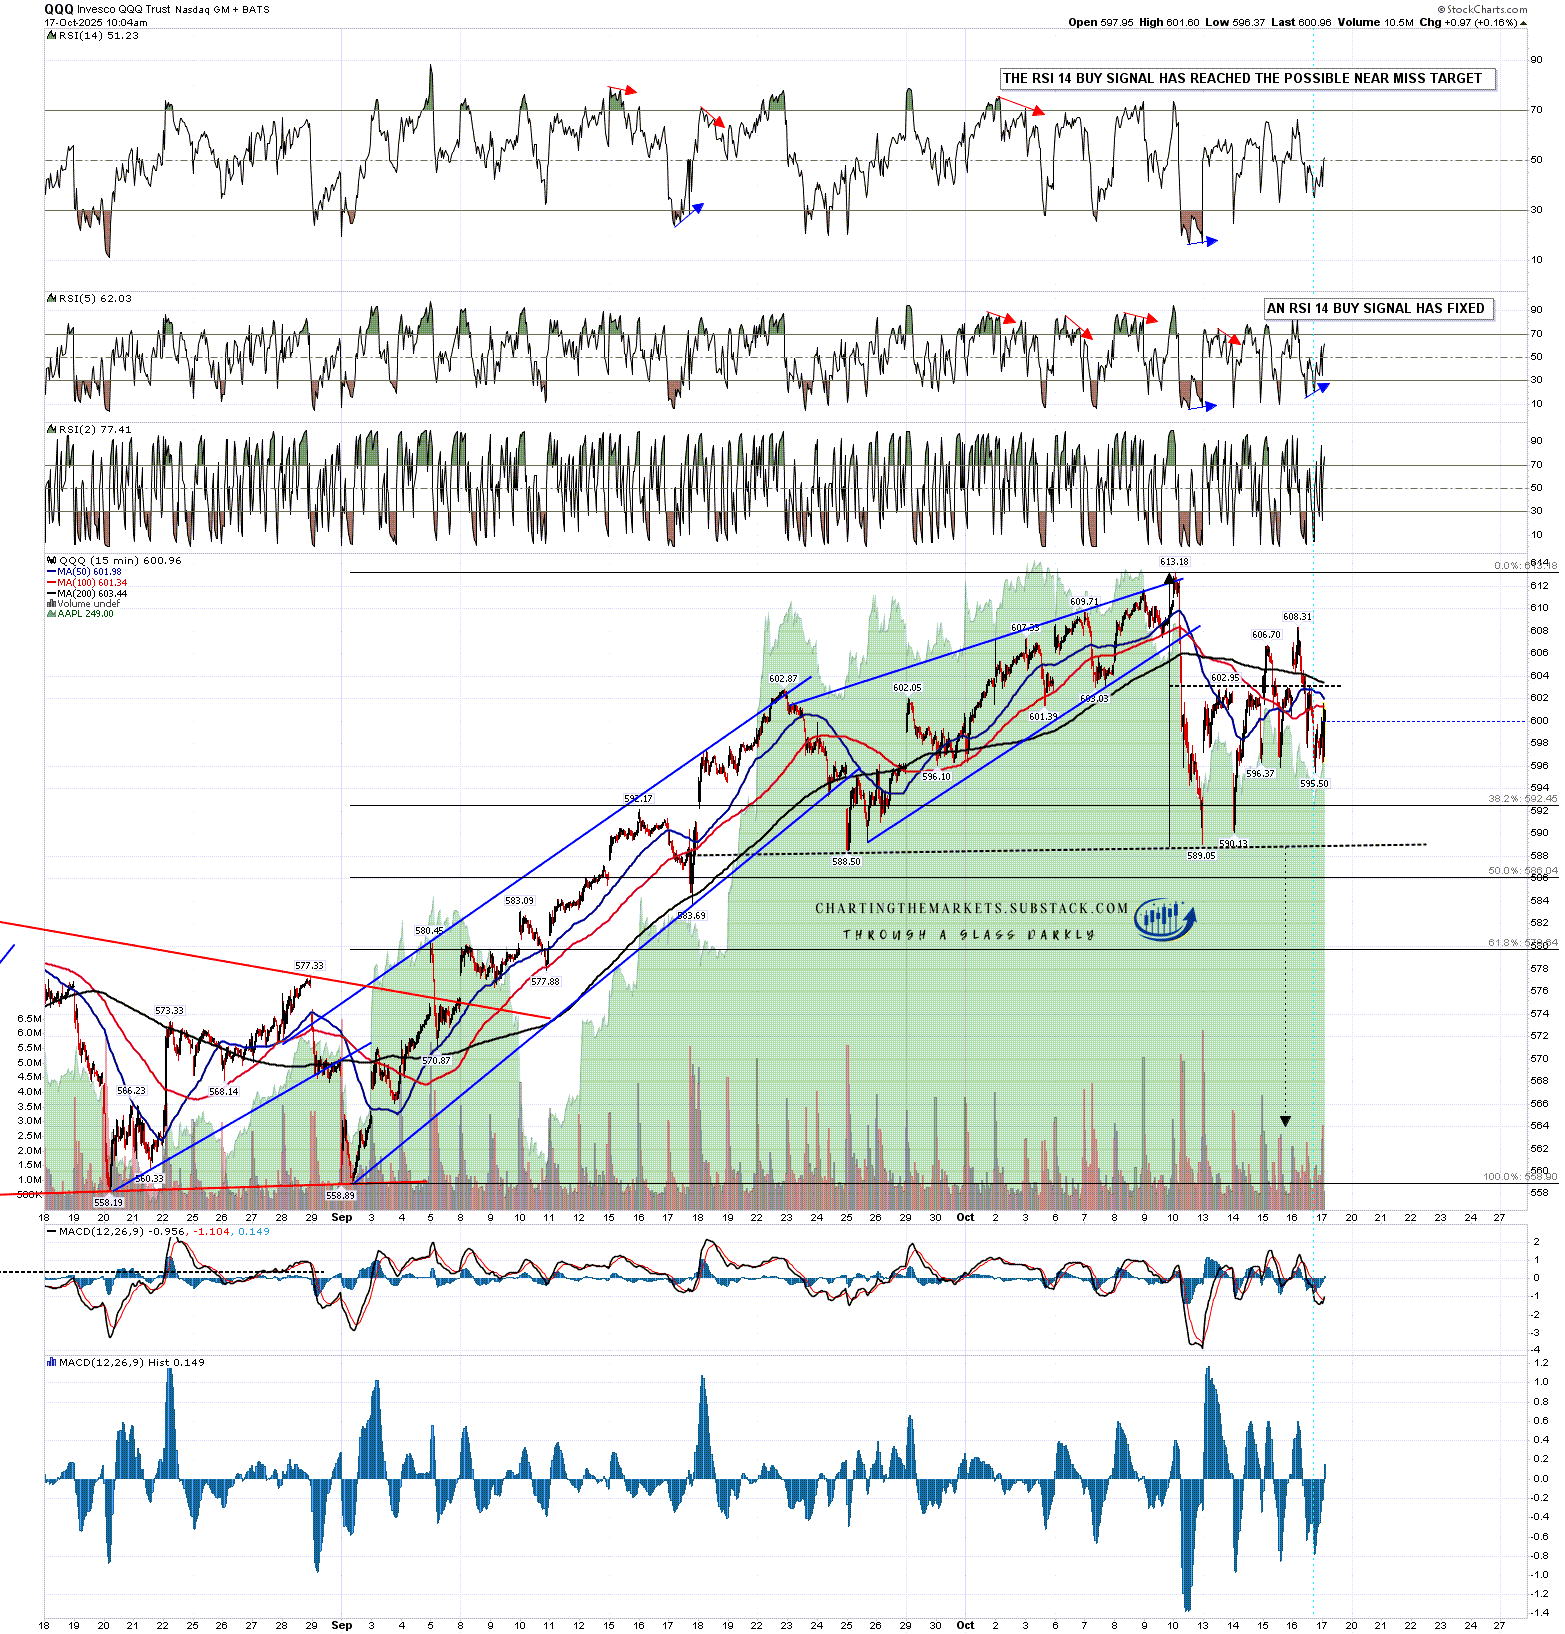
On QQQ the H&S I posted on Tuesday as a possibility is still looking good. A sustained break below the neckline would look for a target in the 564 area.
QQQ 15min chart:
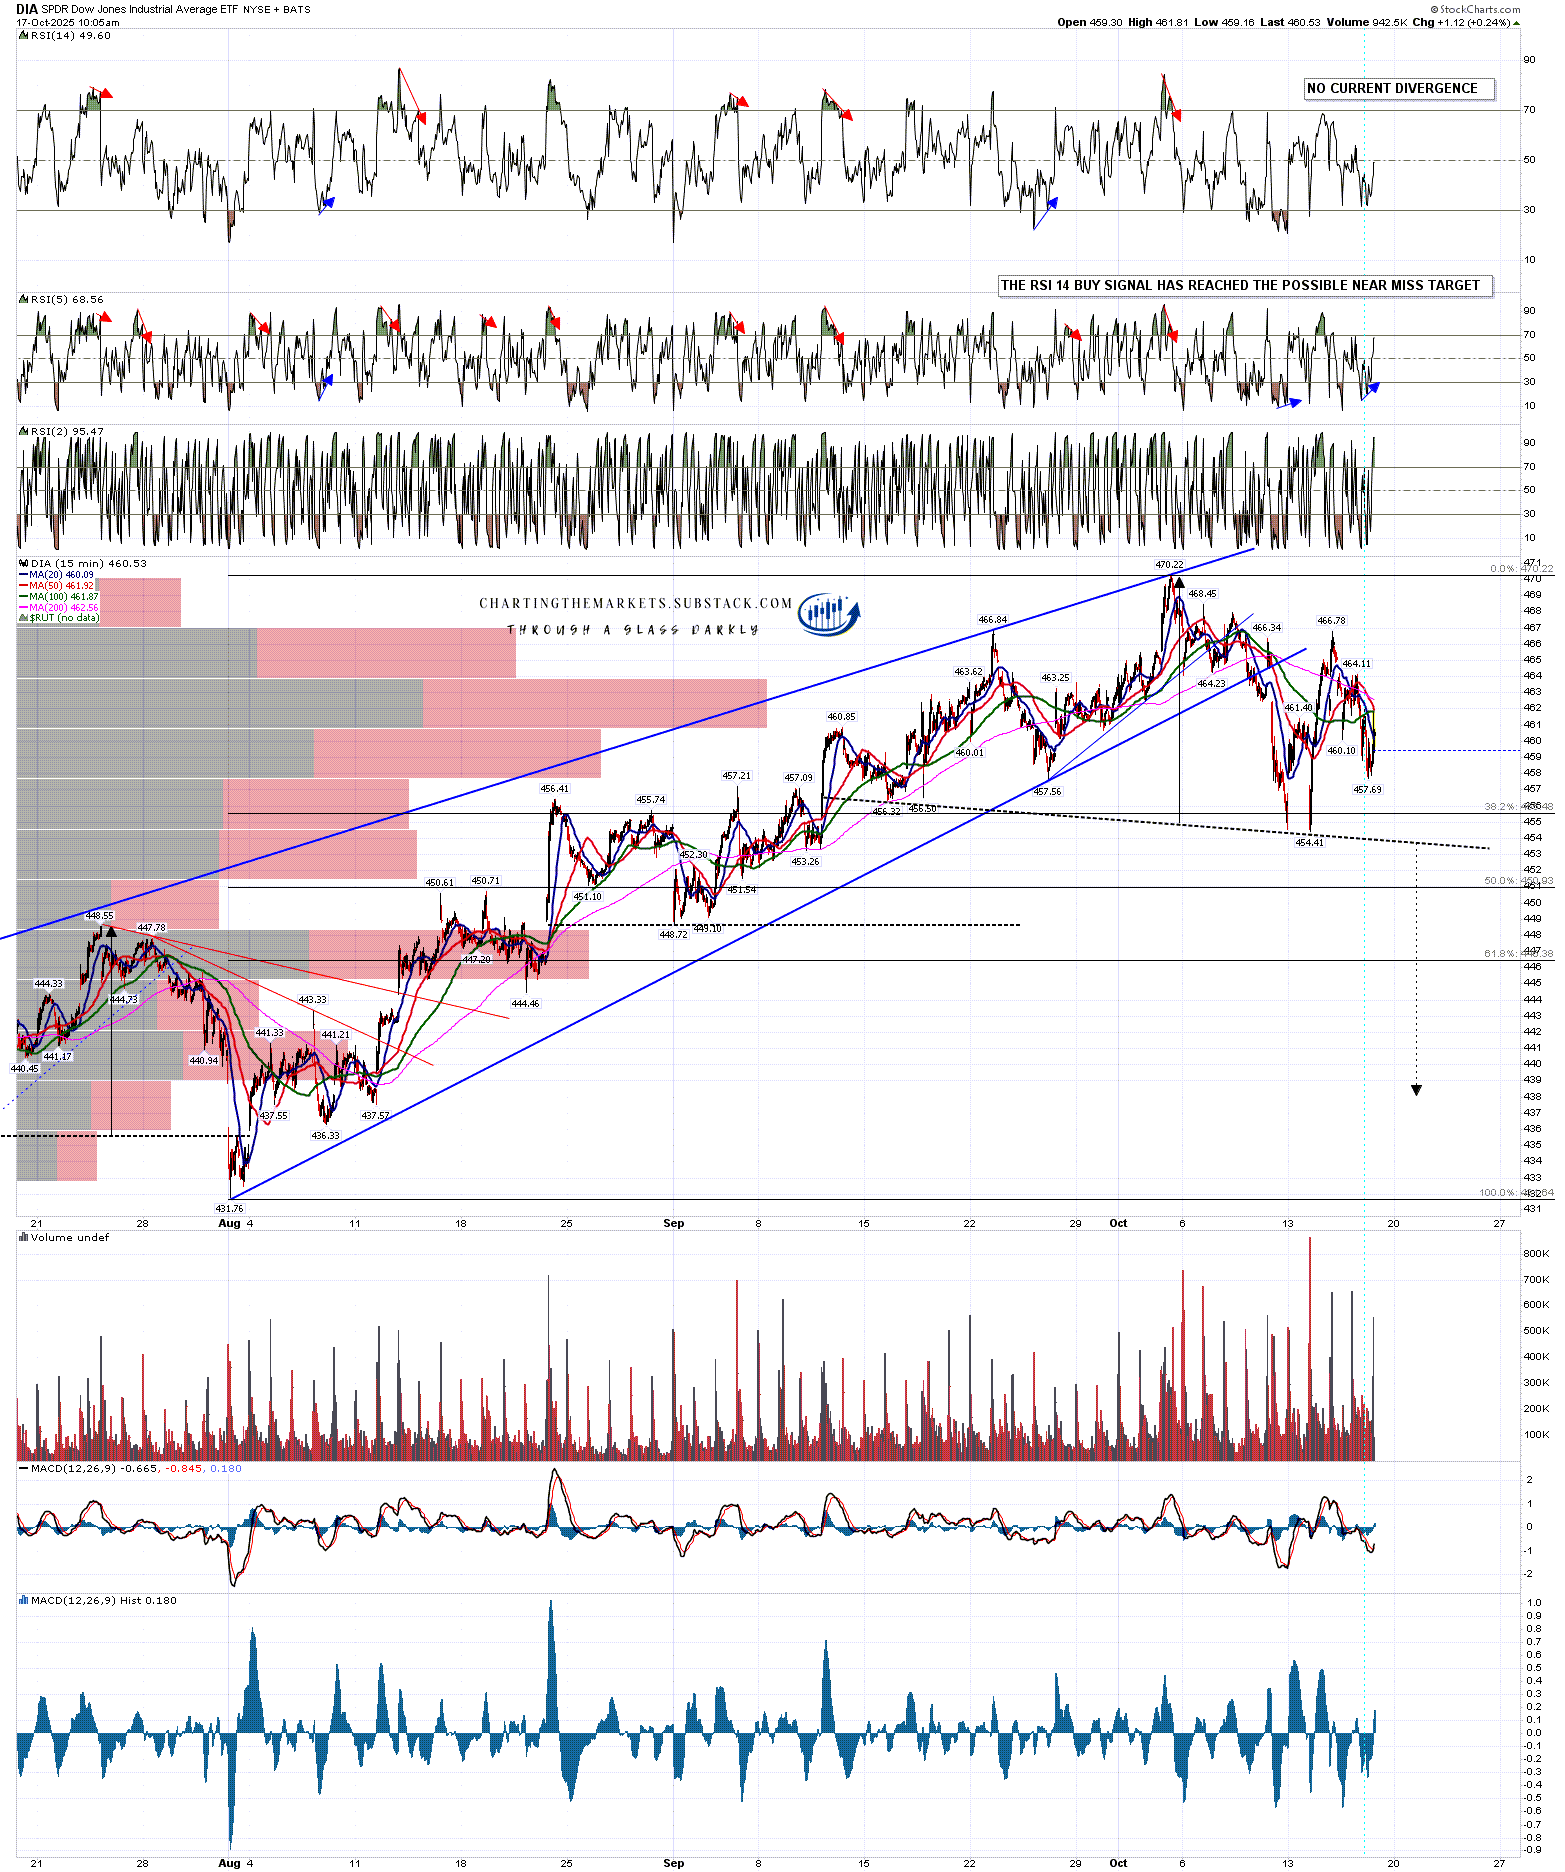
On DIA the H&S I posted on Tuesday as a possibility is still looking good. A sustained break below the neckline would look for a target in the 438 area.
DIA 15min chart:
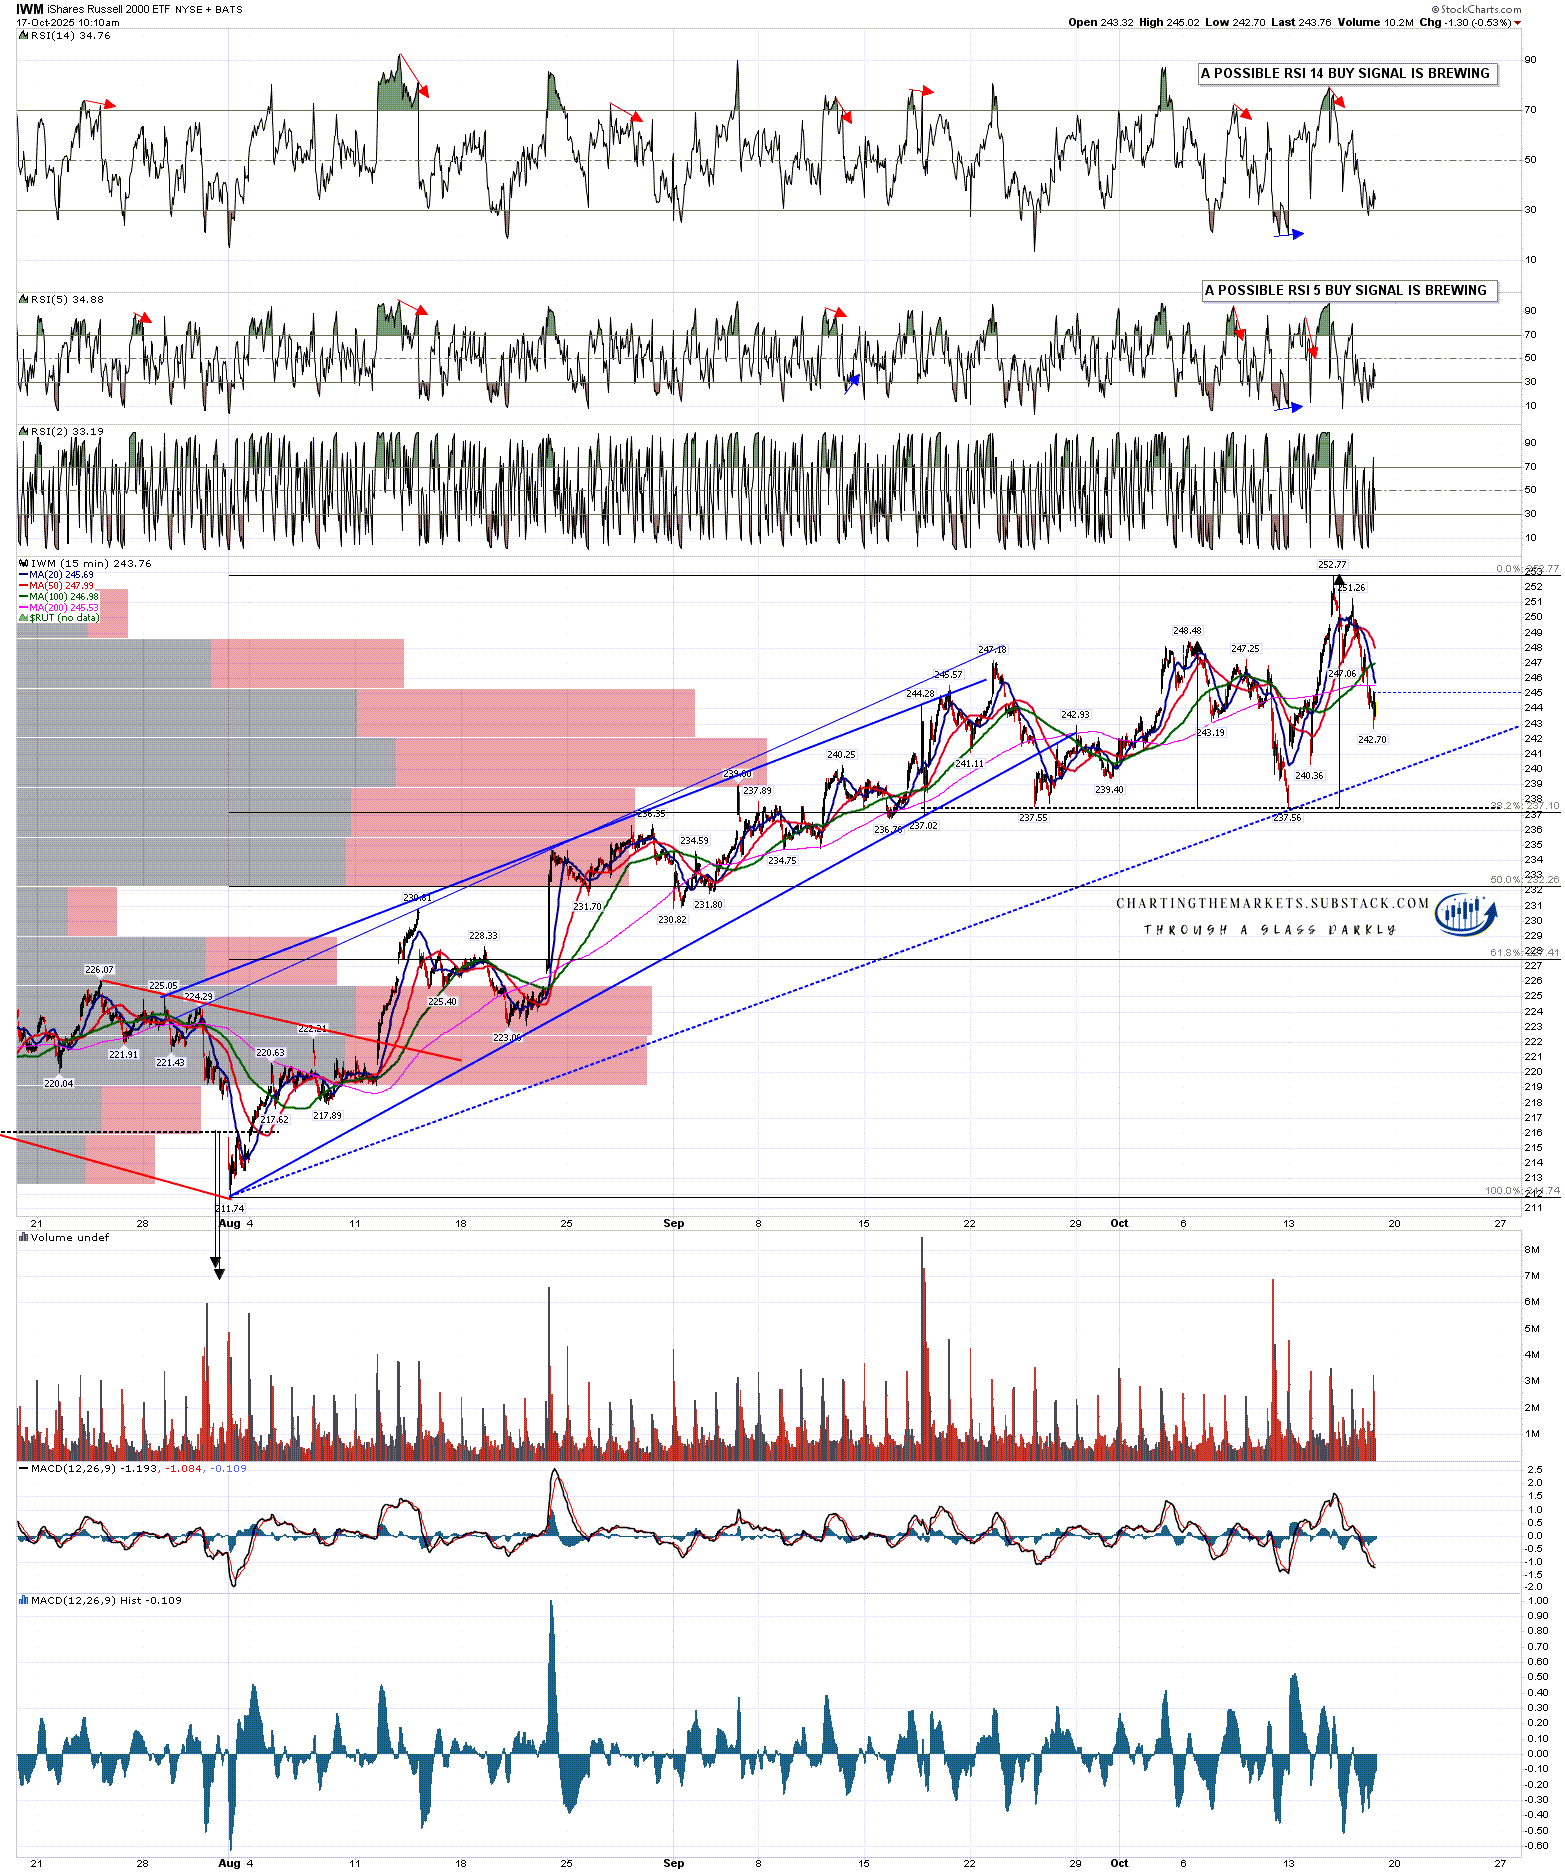
Every so often IWM follows a different path to the others and it did that this week, making a new all time high with confidence with a rare test at the high of the 3sd daily upper band. The double top setup I posted on Tuesday is gone, and while there may be a less good double top setup here it might also be a part-formed H&S. Some downside potential but no clear topping pattern.
IWM 15min chart:
It may be that none of these topping patterns break down, but if they do then there is also an obvious point of failure there where they could fail and reject back up to the highs. On sustained breaks down though, I’d be looking for those targets.
If we do see this larger retracement I’d still be looking for high retests afterwards, but those retests might then be making second highs on much larger double tops. Big highs are often preceded by a sharp retracement in a sequence I call ‘the low before the high’.
In terms of the historical stats today is opex and tends to be neutral. Looking into next week they lean neutral to bullish Monday and Tuesday, 61.9% bearish on Wednesday, 71.4% bullish on Thursday and 66.7% bullish on Friday. Overall a neutral week with a modestly bullish lean.
Everyone have a great weekend :-)
If you like my analysis and would like to see more, please take a free subscription at my chartingthemarkets substack, where I publish these posts first. I also do a premarket video every day on equity indices, bonds, currencies, energies, precious commodities and other commodities at 8.45am EST, but only for paying subscribers. Other places to find me are my twitter, and my Youtube channel.
No comments:
Post a Comment