
In my last post on 24th October I was looking at rising wedges on SPX, QQQ, DIA and IWM from the April lows and weighing the odds of these breaking down into a substantial retracement in the near future.
For SPX, QQQ and DIA I was looking at possible upside targets if they went higher, which they have, but not on IWM where I was just looking for a possible high retest, which we have not quite seen yet.
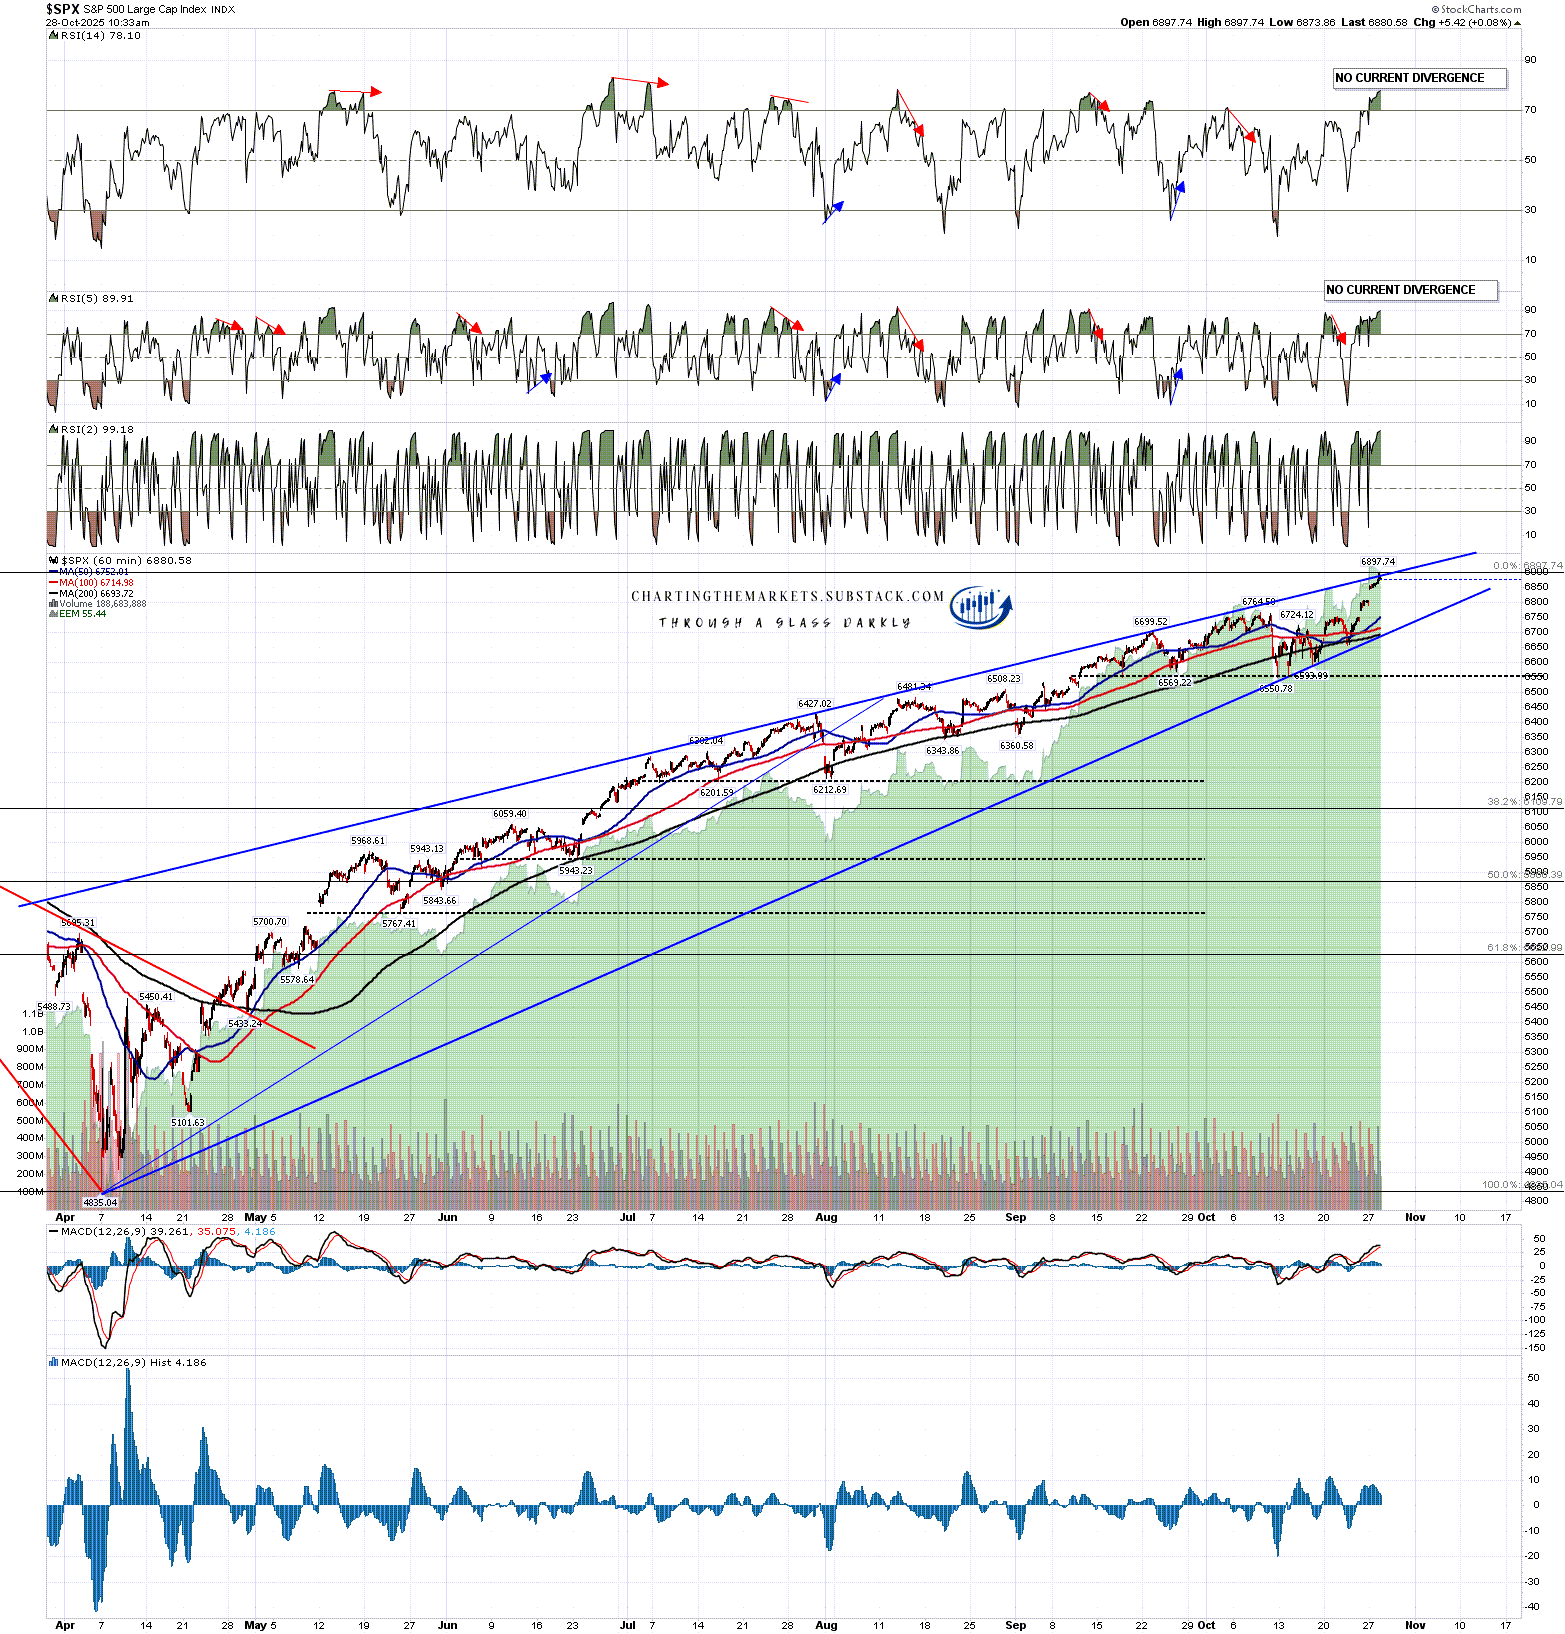
As I mentioned in my last post, this move has eliminated the double top setup but may still be an H&S forming.
SPX 60min chart:
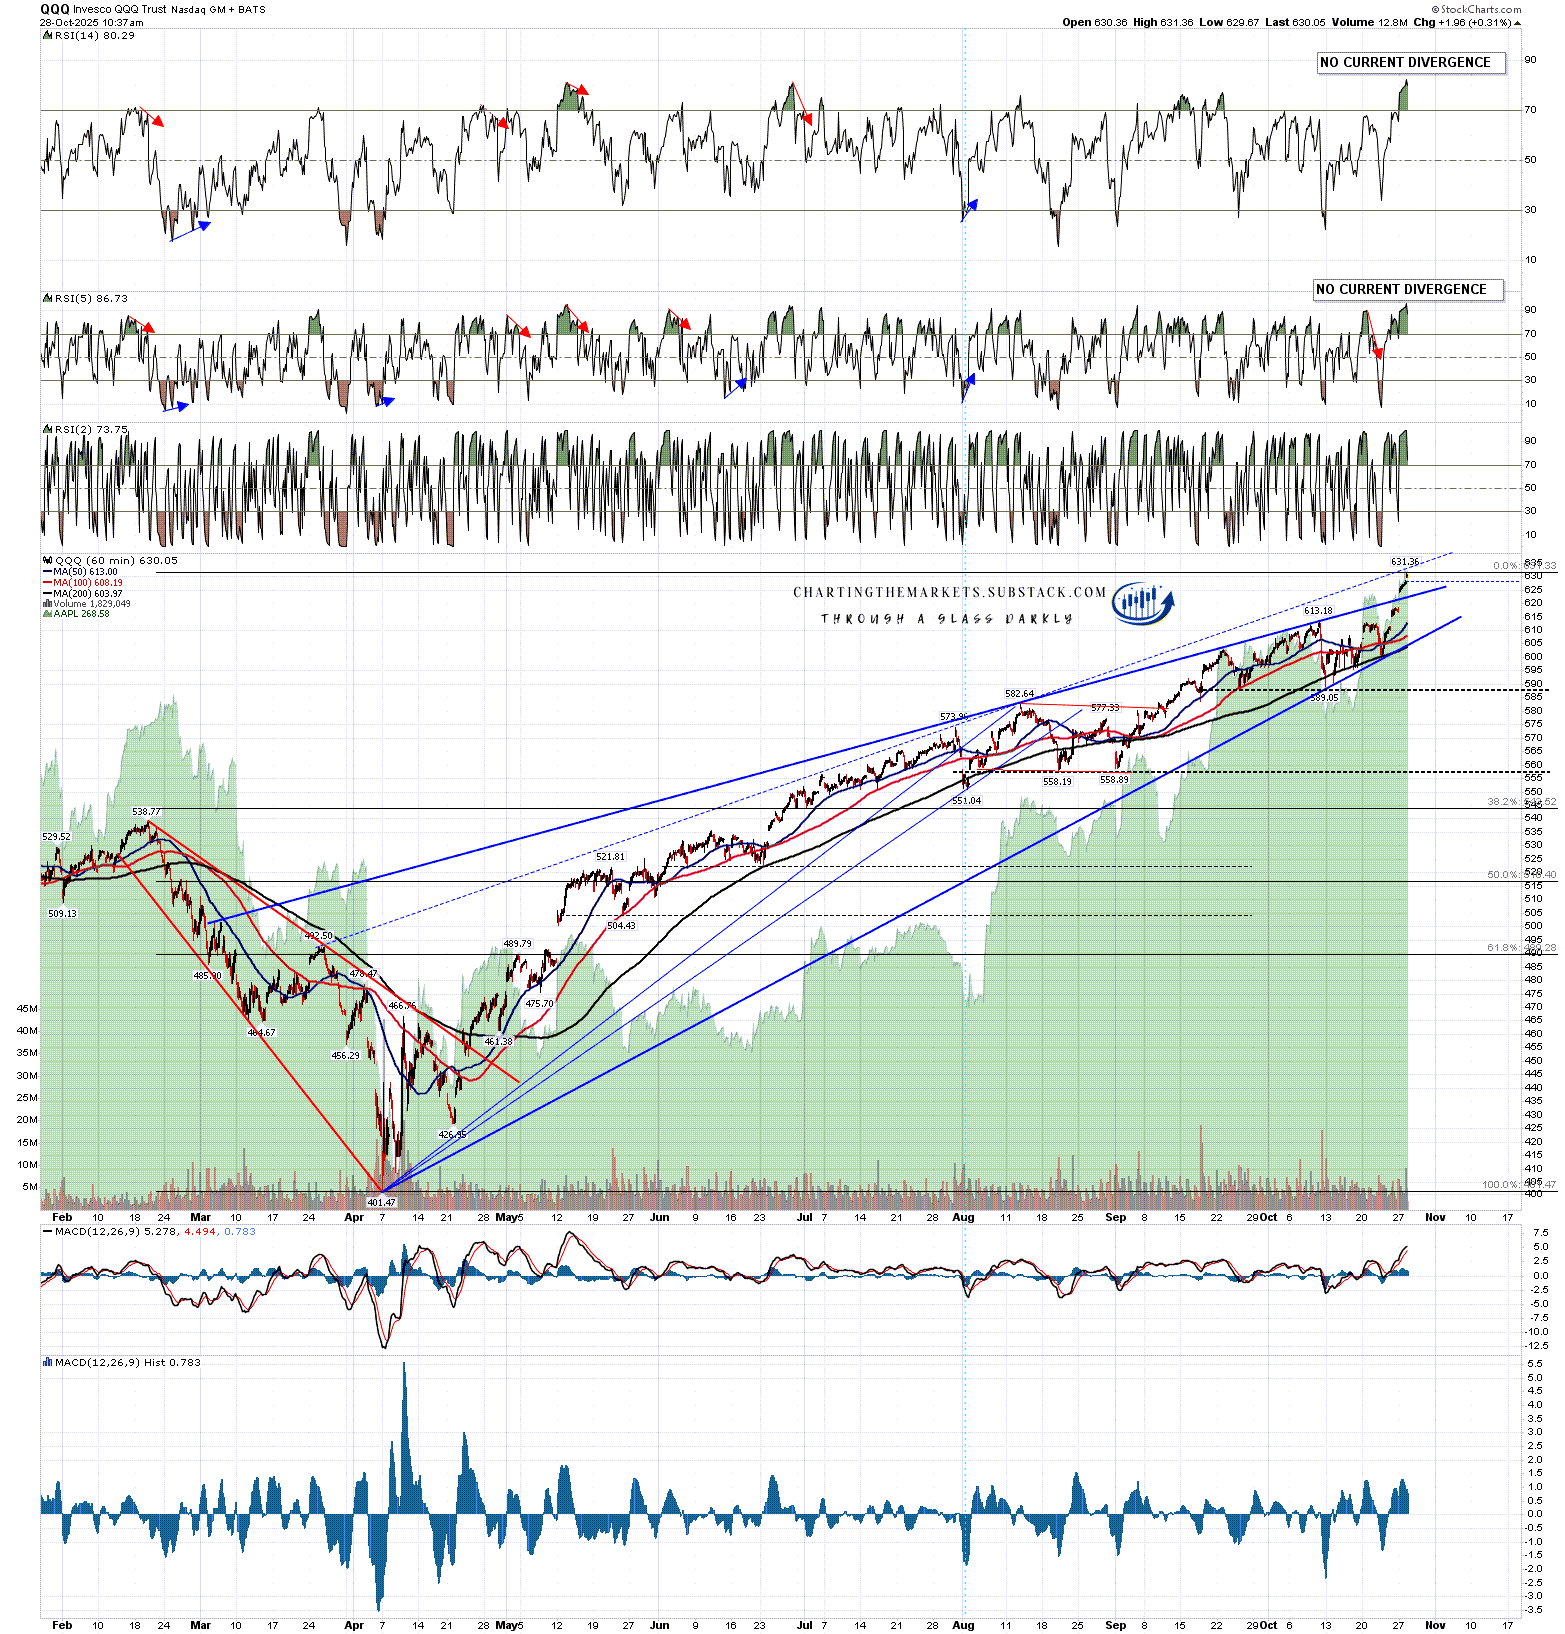
Looking at the rising wedge on QQQ the first rising wedge resistance I showed has been hit and broken, and I have redrawn the wedge support through the last low as this means that the wedge has expanded. The high at the time of writing could be a bearish overthrow.
I posted a possible alternate wedge resistance trendline and that is now in the 834/5 area and may be hit next. If so, that would become the main wedge resistance trendline.
This move has eliminated the double top setup but may still be an H&S forming.
QQQ 60min chart:
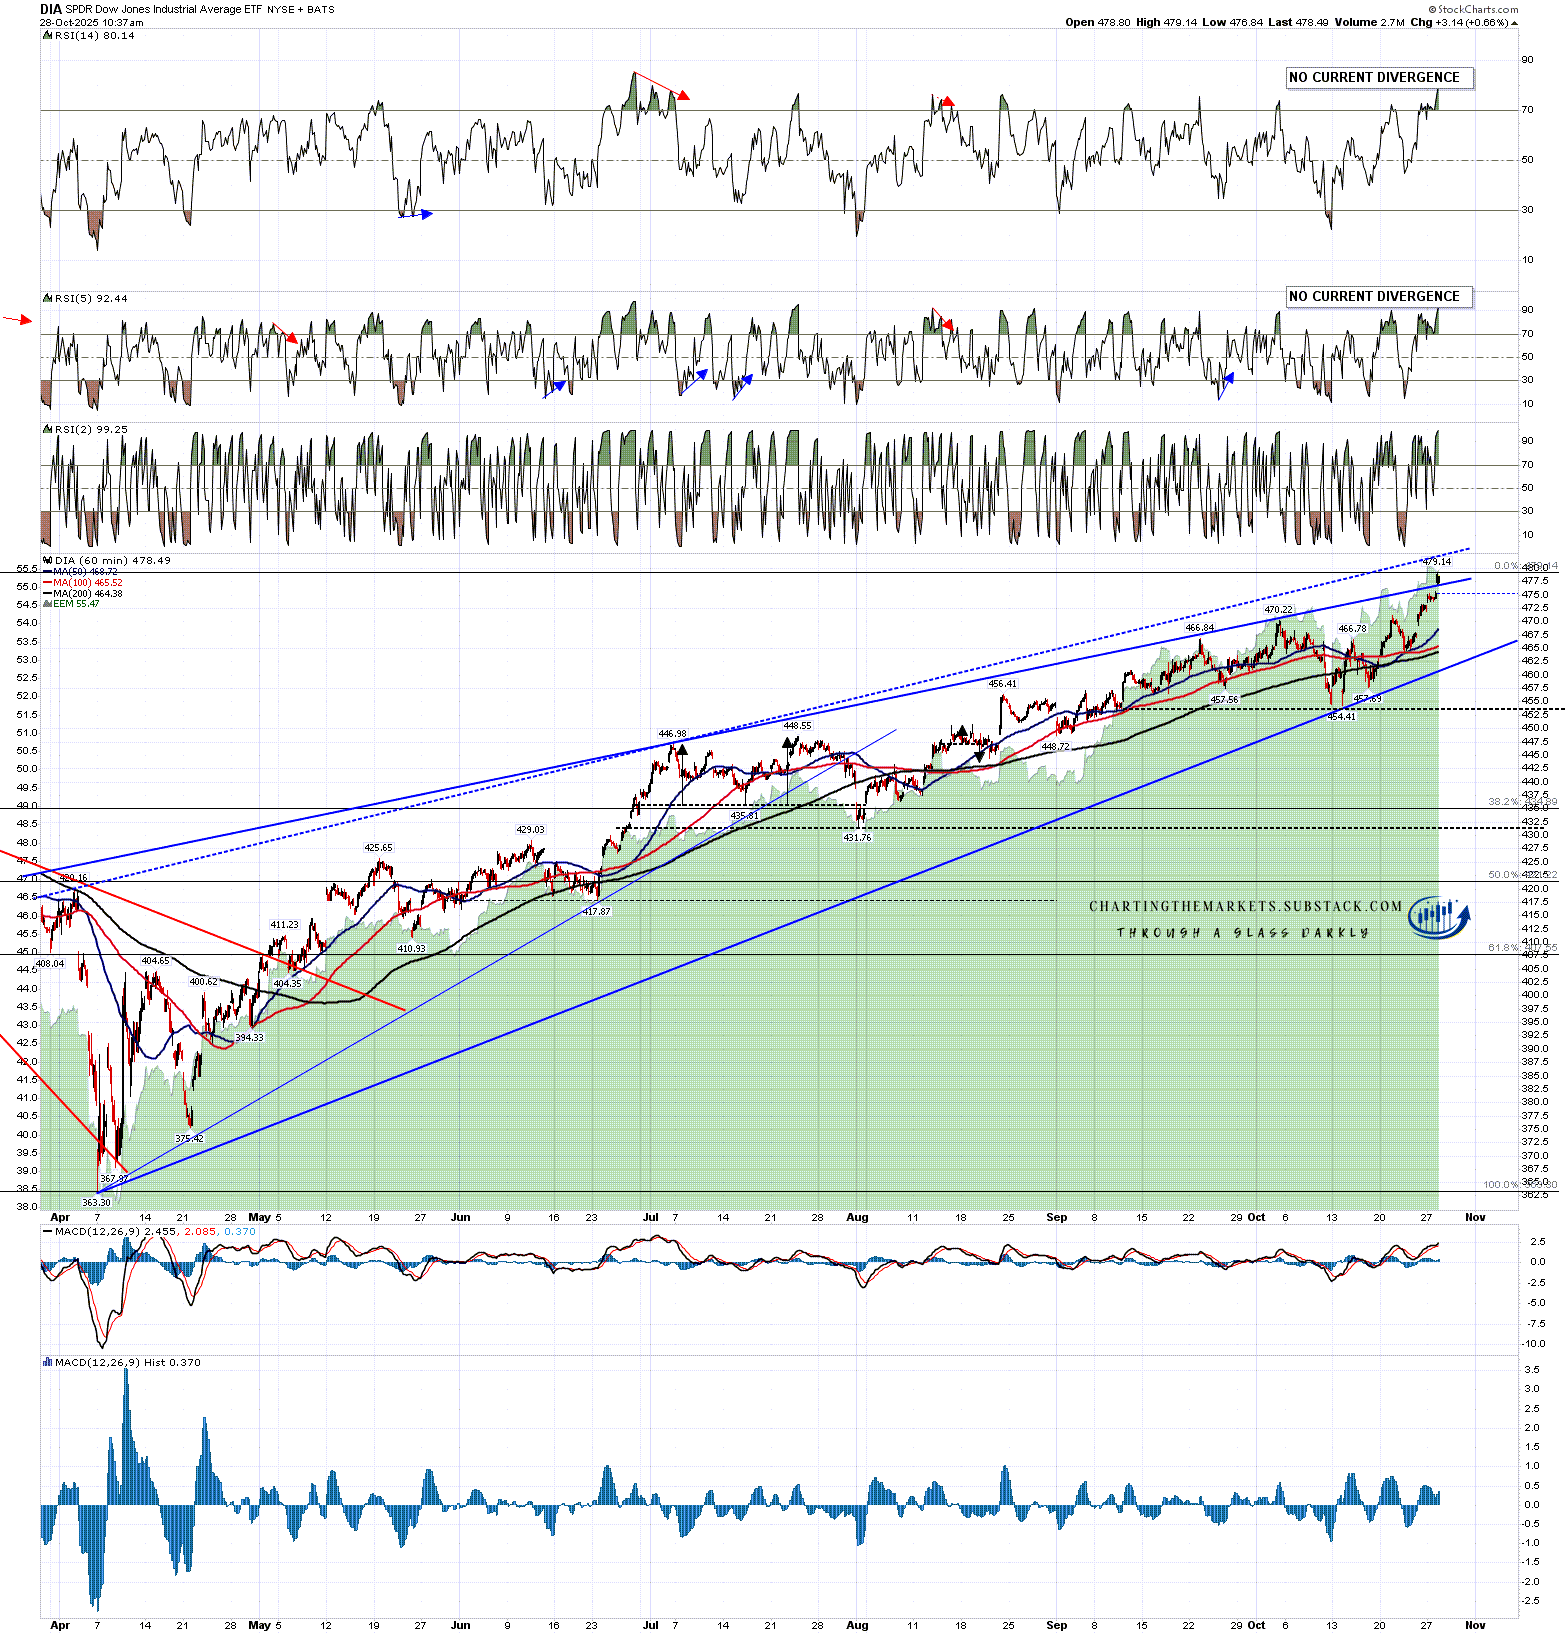
Looking at the rising wedge on DIA the first rising wedge resistance I showed has been hit and broken, and I have redrawn the wedge support through the last low as this means that the wedge has expanded. The high at the time of writing could be a bearish overthrow.
I also posted a possible alternate wedge resistance trendline on DIA and that is now in the 484 area and may be hit next. If so, that would become the main wedge resistance trendline.
This move has eliminated the double top setup but may still be an H&S forming.
DIA 60min chart:
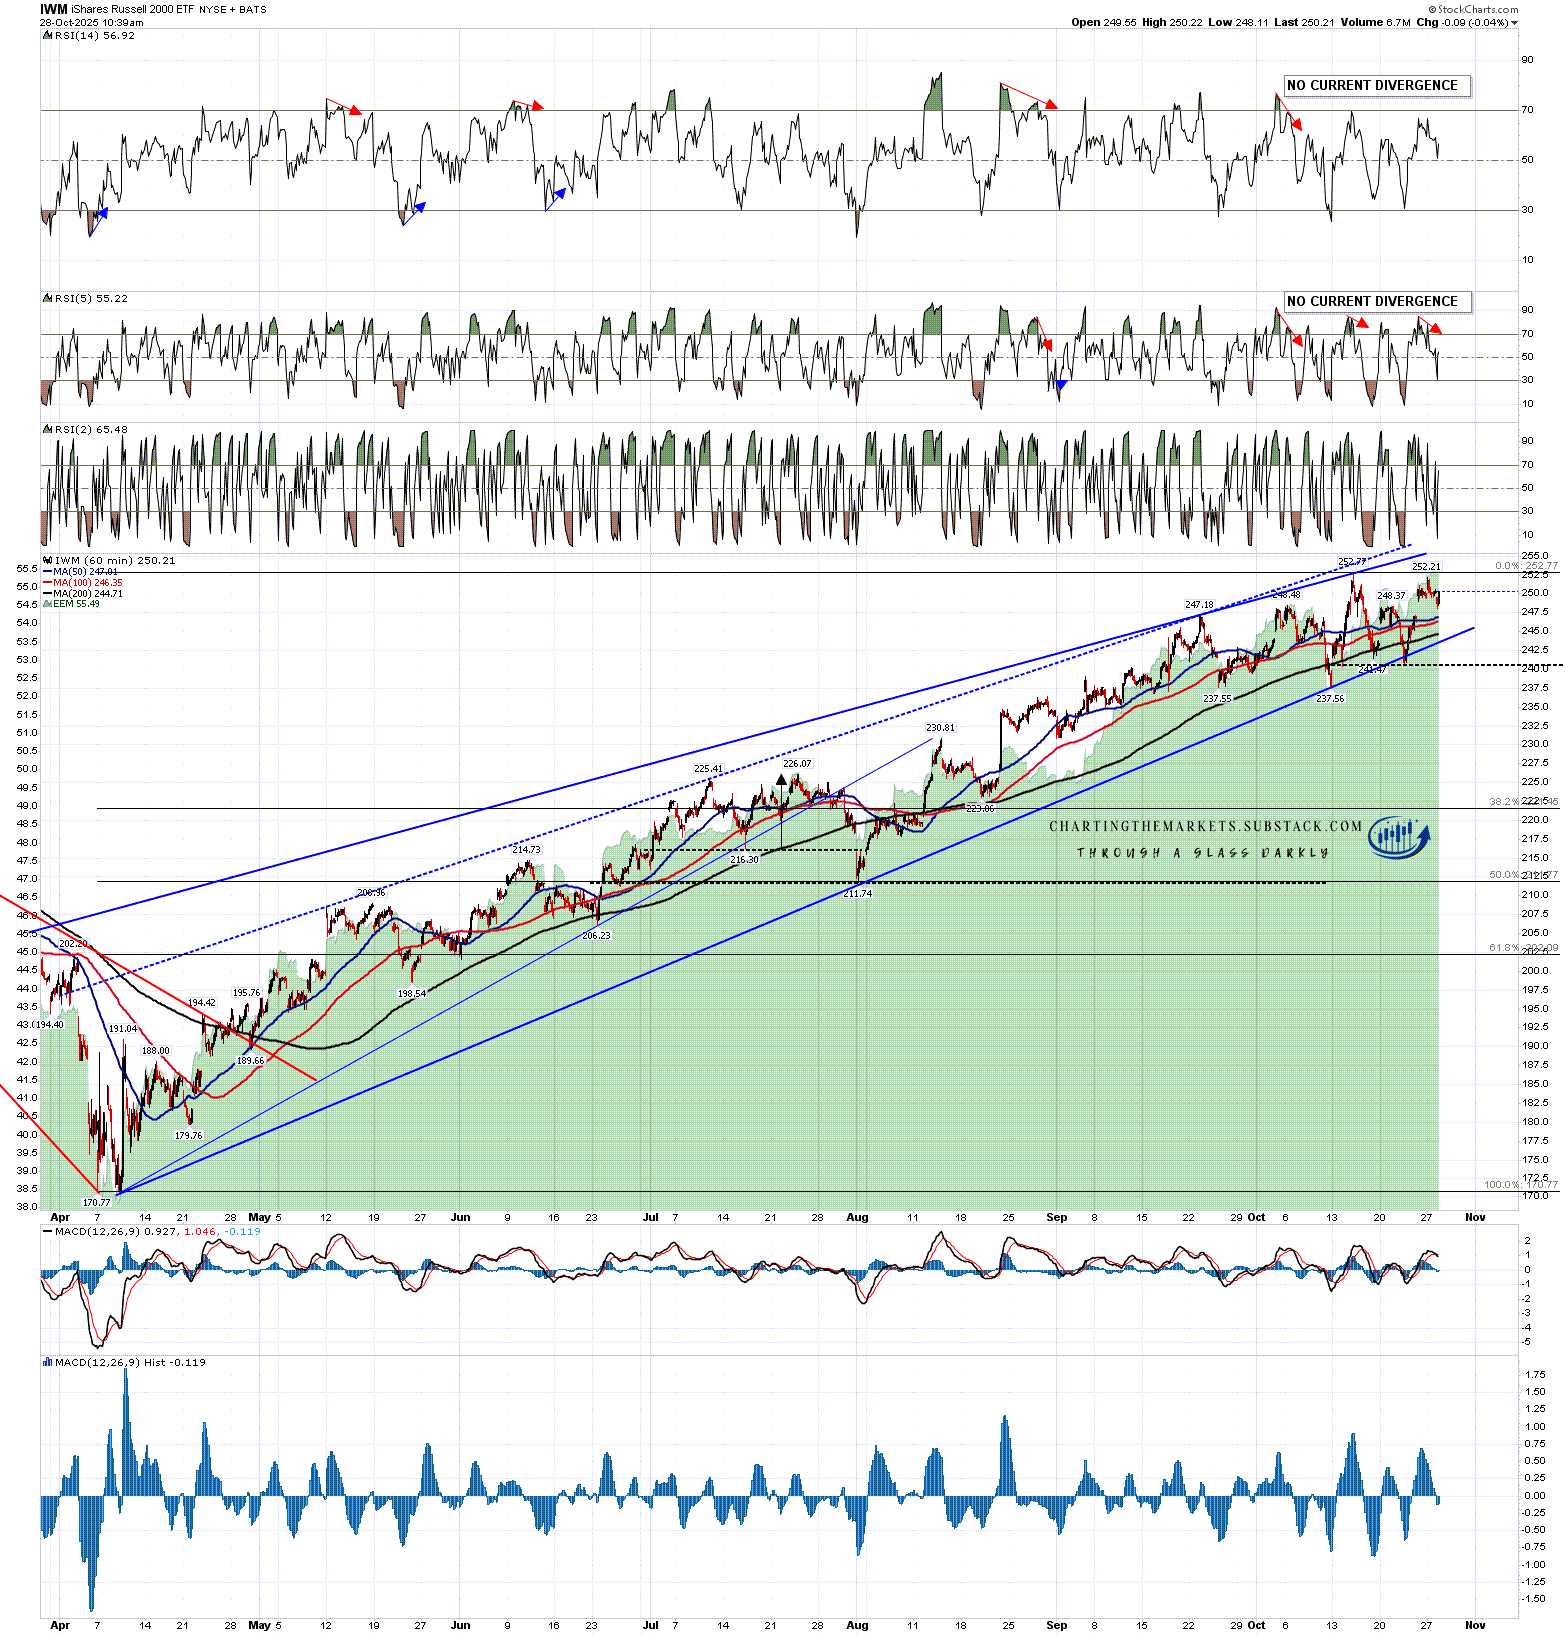
Looking at the rising wedge on IWM I was wondering about a high retest there and we almost saw one yesterday, but not quite. That may still need a retest.
IWM 60min chart:
So how is this looking now? Well the first thing to say is that all of SPX, QQQ and DIA have hit wedge resistance trendlines and may be overthrowing those bearishly. All are looking very short term overbought on the hourly RSIs.
On the SPX, QQQ and DIA daily charts they have also all hit or come very close to their 3sd upper bands this week, so we would usually see a period of consolidation or retracement over the next few days.
SPX daily chart:
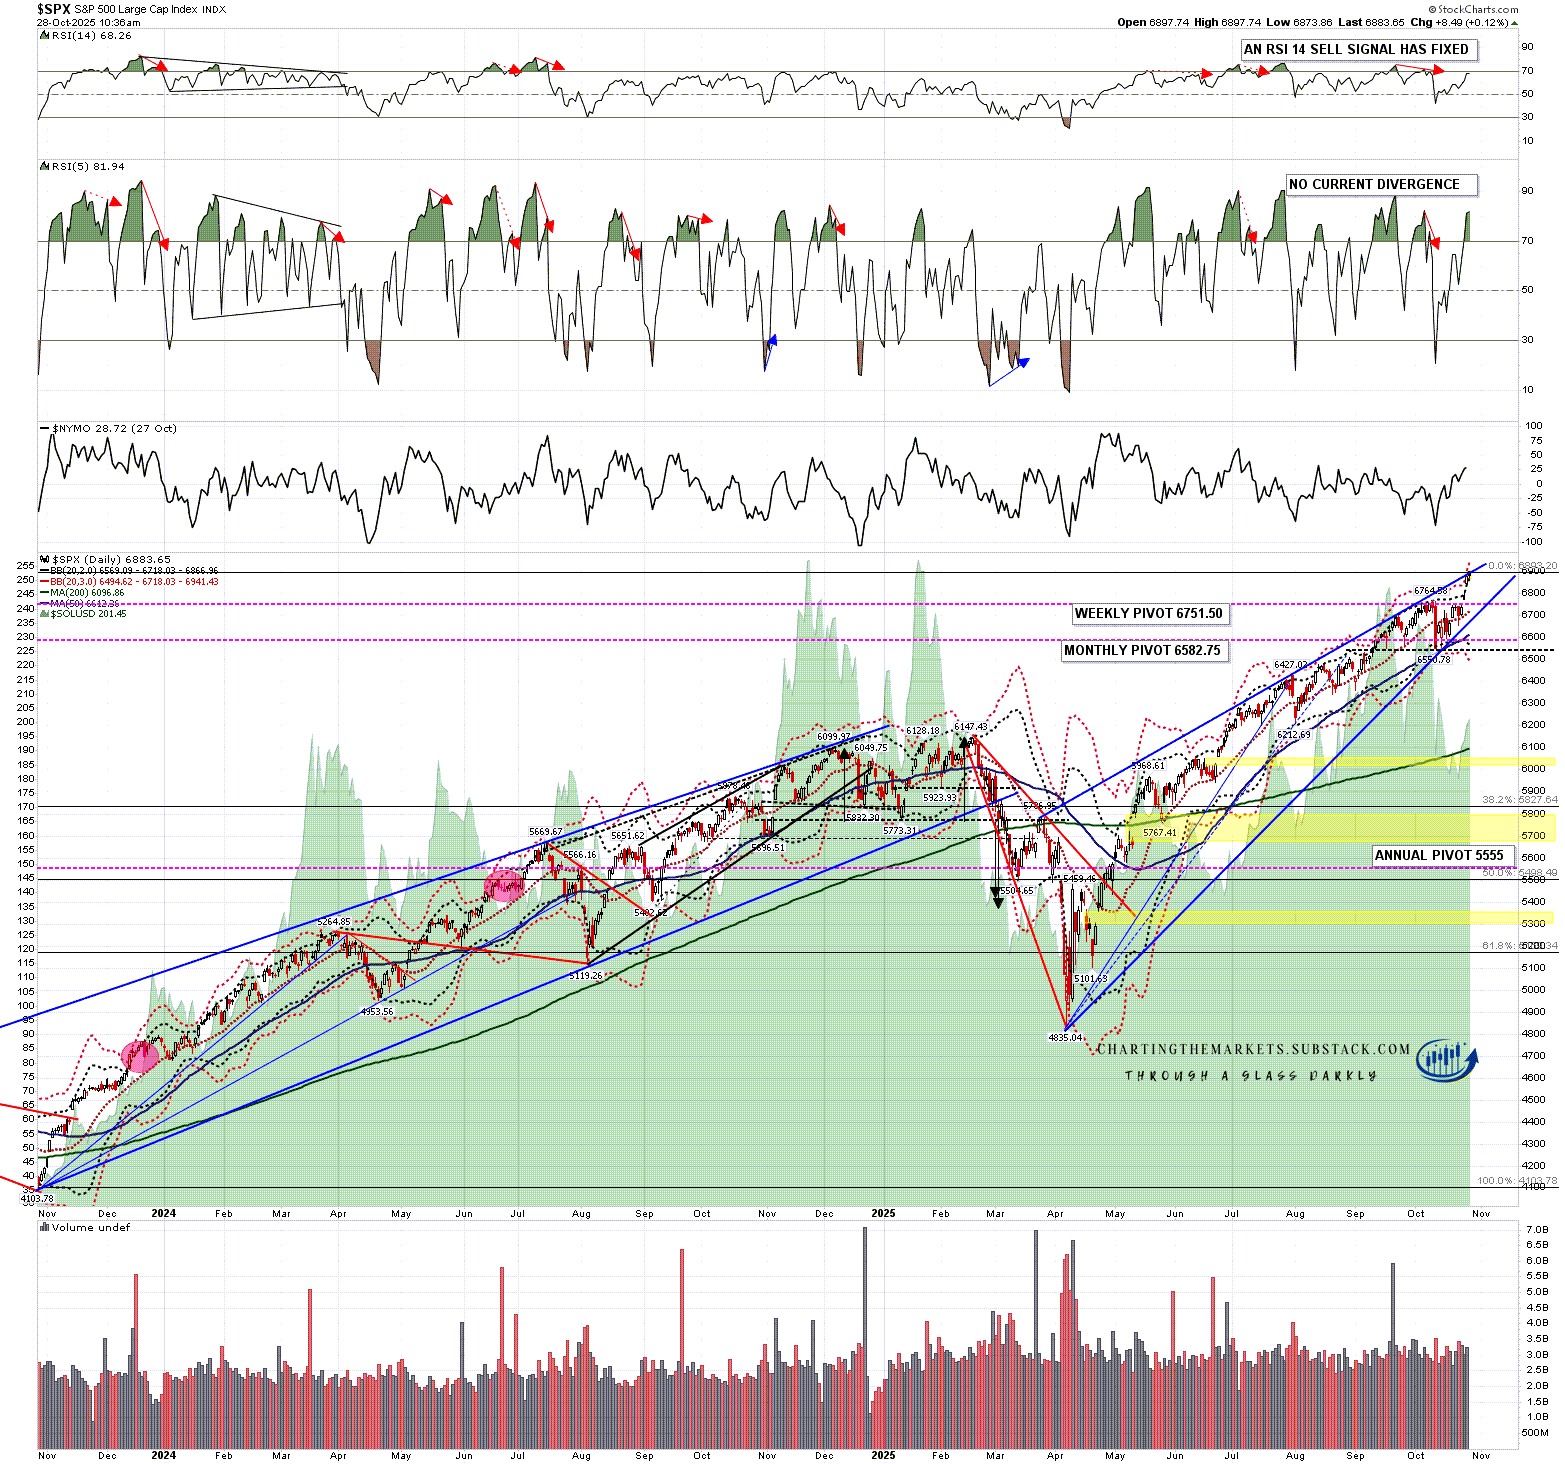
I’m expecting to see at least some retracement or consolidation from this area. There is a case for a bit higher short term on QQQ, DIA and IWM, but after that at least a period of consolidation looks likely. In the short term I’m seeing hourly sell signals fixed or brewing on ES, NQ and YM that are generally a reliable signal of a short term high forming. There is also a historically bearish leaning day tomorrow.
Against a more substantial retracement here we have no current reversal patterns on SPX, QQQ and DIA, though H&S patterns may be forming. There are no current hourly RSI 14 or daily RSI 5 sell signals fixed or brewing on any of these four RTH indices.
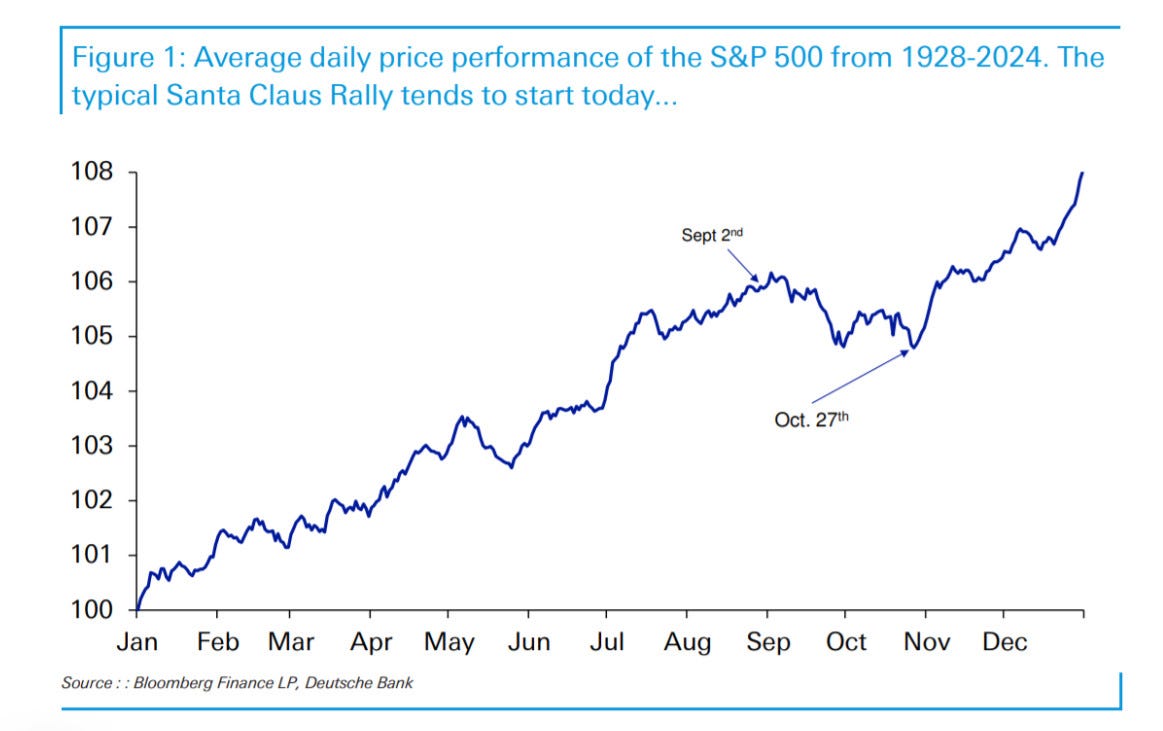
We are now also almost through October, with only three full trading days left. There are good reasons to see a significant decline in November, the ongoing government shutdown, possible failure of trade negotiation with China, or the generally fragile state of the US economy, but November and December are still historically two of the most bullish months of the year, and all year I’ve been looking for a significant high on both equities and Crypto being made in or close to December.
The chart below shows the average daily price performance of the S&P 500 from 1928-2024. The average Santa rally starts on 27th October and over that period the average rise into the end of the year has been over 3%:
If we are seeing a break higher here then we would need to see some sustained breaks over the wedge resistance trendlines from the April lows, but that seems unlikely to start from here, and I am doubtful about that happening at all. These are high quality patterns and they have not delivered any meaningful retracement yet. We might instead see a slower move that just expands these wedges to the upside somewhat instead, though the higher probability resistance trendlines for these are the ones we have been testing here. Higher trendlines beyond would be harder to identify. At minimum we should see some consolidation from the current area.
The historical stats for the rest of this week are bearish on Wednesday, bullish on Thursday and neutral on Friday. For next week, the first trading week of November, Monday through Friday all lean bullish with the exception of Wednesday. There is only one bearish leaning day in November and only two in December, one of which is the last trading day of 2025.
If you like my analysis and would like to see more, please take a free subscription at my chartingthemarkets substack, where I publish these posts first. I also do a premarket video every day on equity indices, bonds, currencies, energies, precious commodities and other commodities at 8.45am EST, but only for paying subscribers. Other places to find me are my twitter, and my Youtube channel.
No comments:
Post a Comment