
In my post on Friday 26th September I was putting the case that the modest retracement that we saw that week might well be over, and in my post on Monday 29th September I was outlining the still possible option that we might nonetheless see another leg down on US indices, though I was assigning that a low probability.
Equity indices resolved higher as expected, and we have seen new all time highs made last week on SPX, QQQ, DIA and IWM. My personal view is still that US equity indices are likely heading higher into the end of the year unless we start seeing strong breaks of the support at the daily middle bands that were backtested and held on SPX, DIA and IWM in the late September lows.
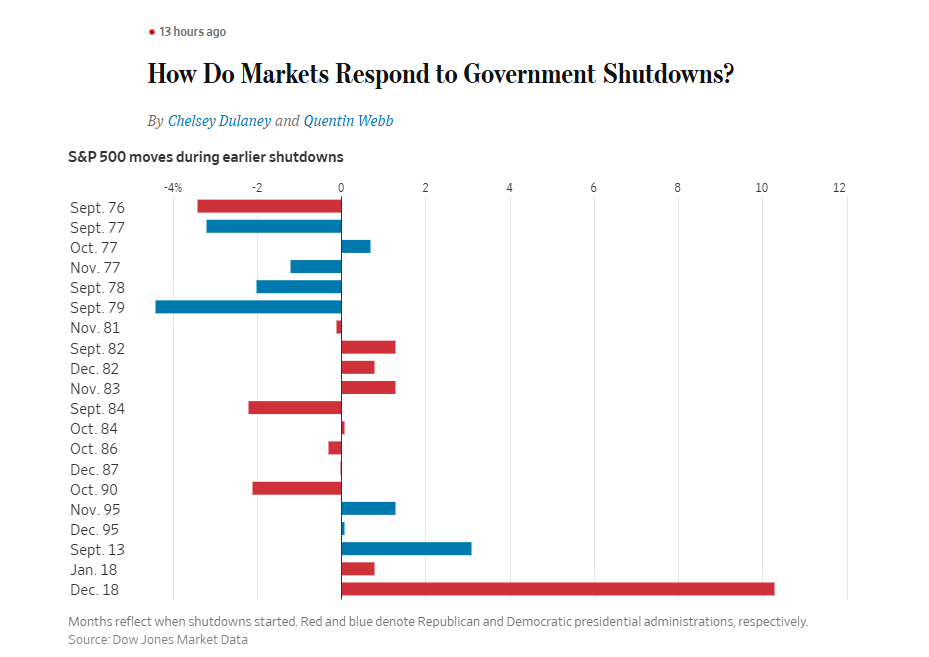
How will that be affected by the current government shutdown? Well that rather depends on how long it lasts, and the longer that lasts the more likely it is that we see equity markets weaken. Looking at the chart below there is a significant negative lean historically for these though I’d note that of the twenty government shutdowns listed on the chart below, the last five starting in Nov' ‘95 all closed green, with a real outlier in the last one in December ‘18 which was the most bullish shutdown since 1976.
Breaking this down a bit further by month though it looks like this:
Septembers - 7 shutdowns of which 5 red & 2 green
Octobers - 4 shutdowns of which 2 red & 2 green
Novembers - 4 shutdowns of which 2 red & 2 green
Decembers - 4 shutdowns of which 1 red & 3 green
Januarys - 1 shutdown of which 1 green
Seasonality seems to be a factor here with the historical stats for shutdowns starting in October and November leaning neutral, and in December and January leaning bullish.
We’ll see how it goes this month as the shutdown progresses:
One thing that has been interesting about this latest round of high retests is that it has added significantly to the negative divergence on the daily charts for these four equity indices, and that is worth keeping in mind.
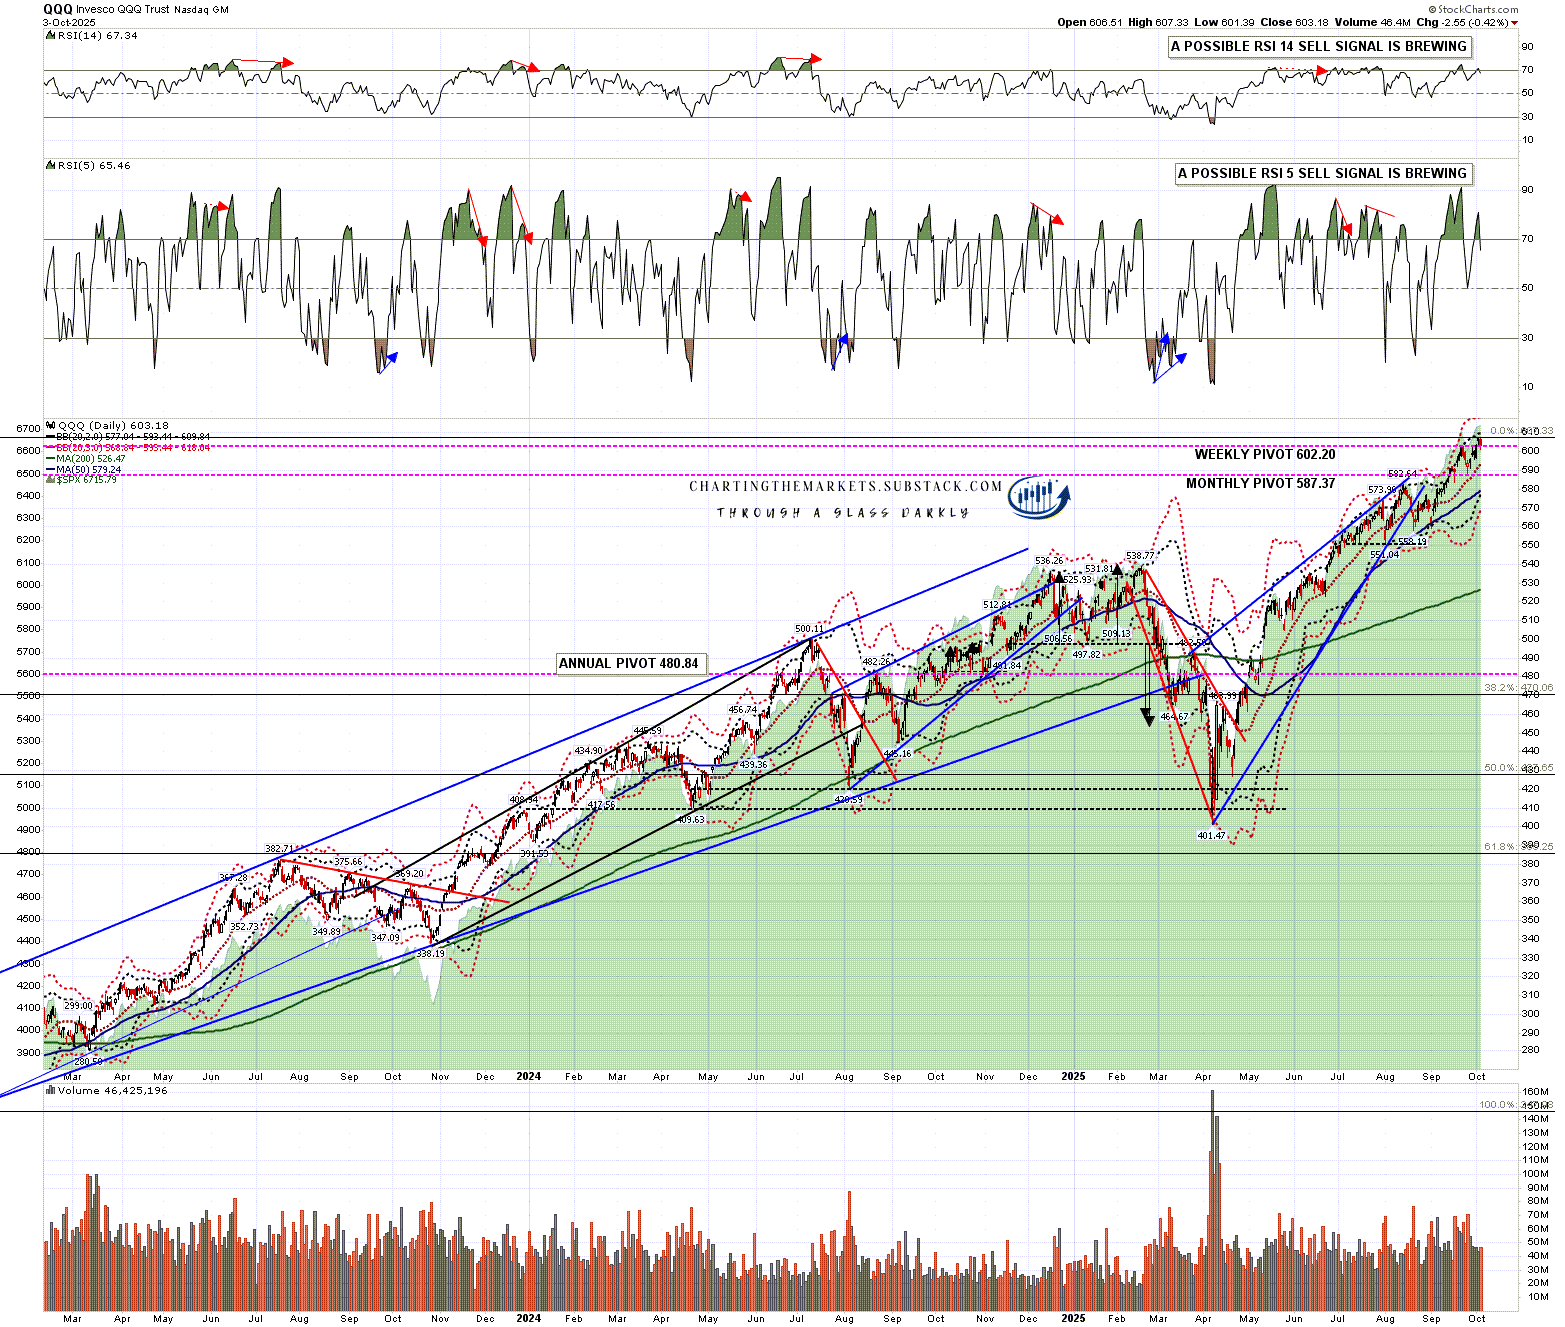
QQQ looks the most bearish, mainly as it fell the least in the last retracement. A daily RSI 14 sell signal is now brewing, with these now brewing or fixed on all four of them, but there is also a more impressive possible daily RSI 5 sell signal brewing. That possible RSI 5 sell signal brewing would be stronger though if it was forming on multiple indices and that isn’t the case here.
The daily middle band closed last week at 593.44 and, until we see a sustained break below that, this remains in a strong uptrend from the April low:
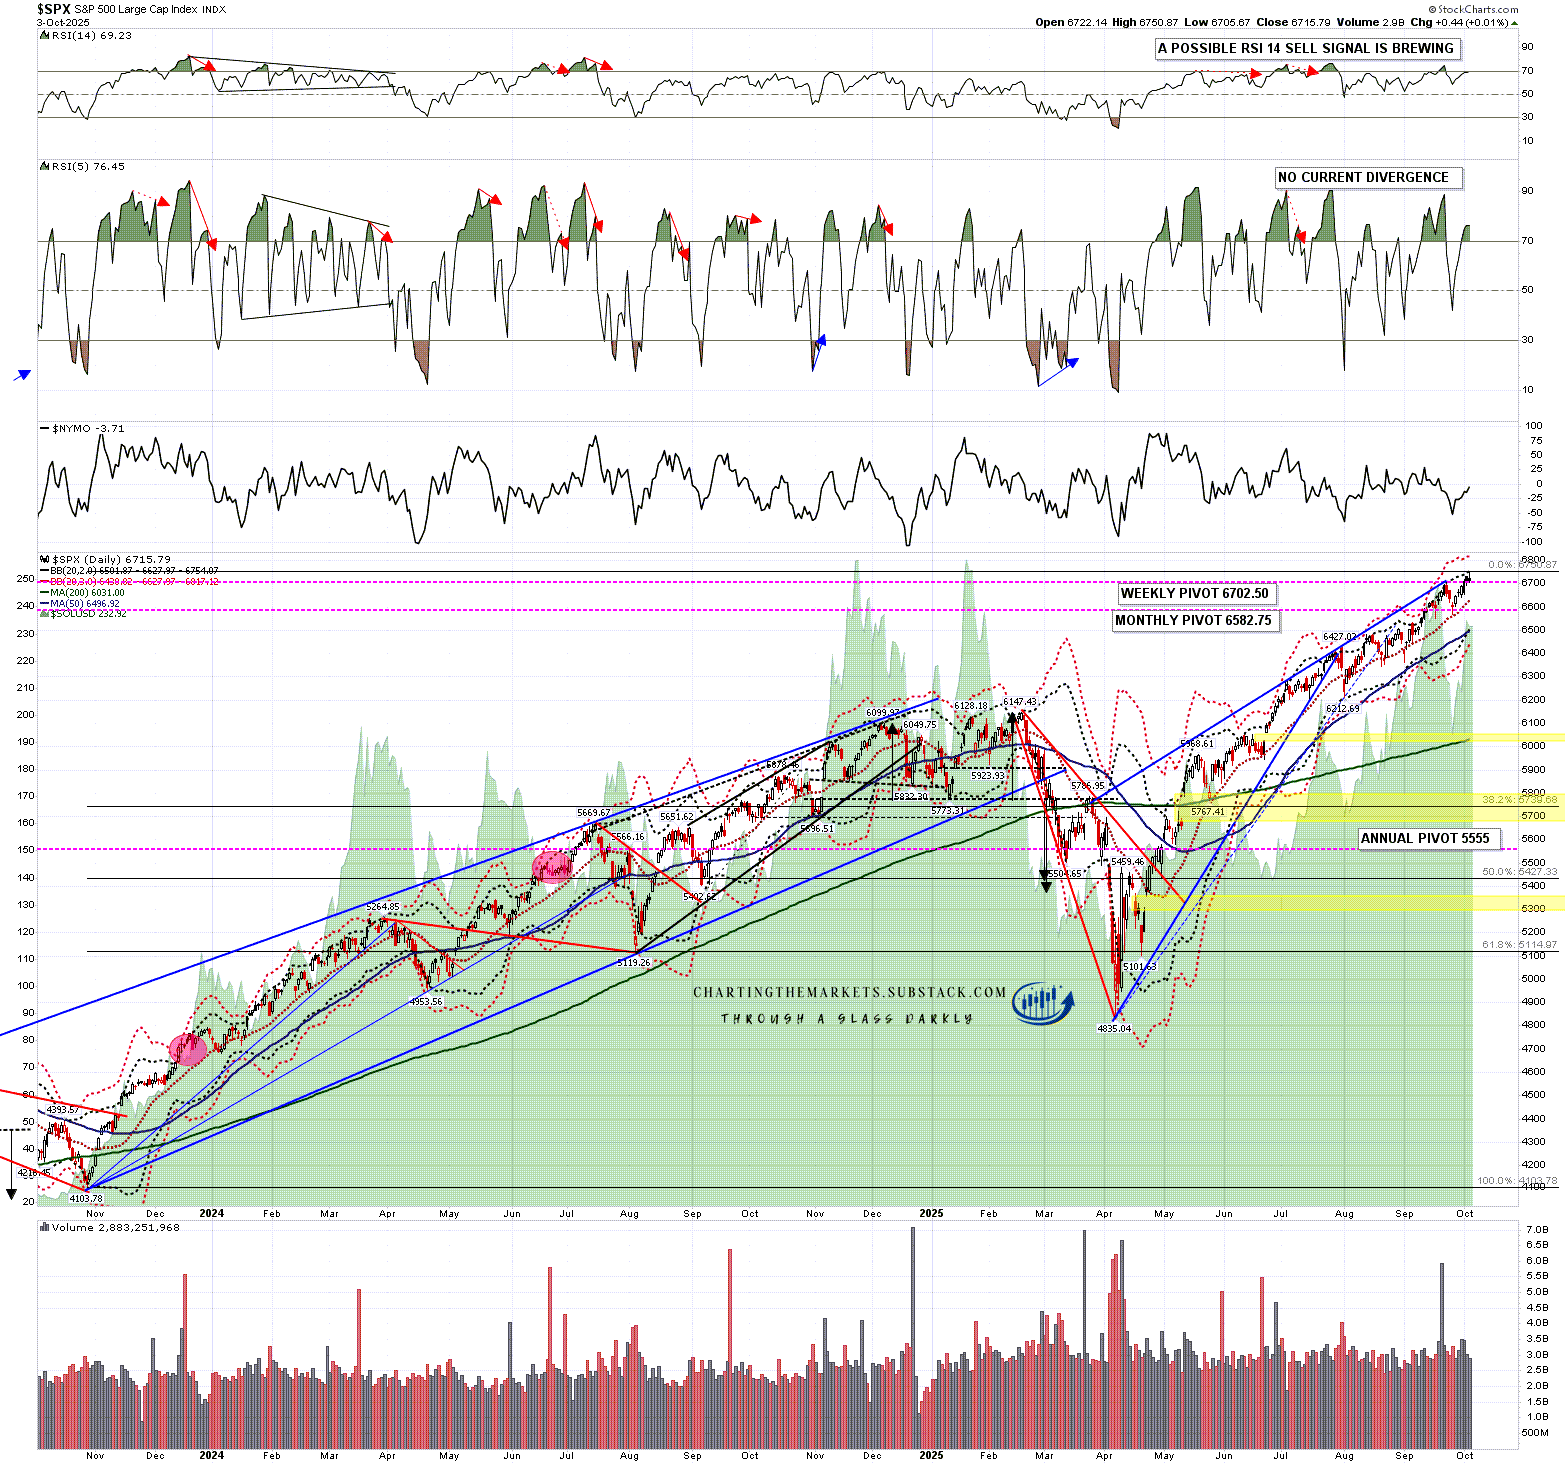
On SPX a daily RSI 14 sell signal is now brewing, but there is no current negative divergence on the daily RSI 5, which would be much more of a short term warning signal.
The daily middle band closed last week at 6627.97 after a near perfect backtest in the last retracement and, until we see a sustained break below, this remains in a strong uptrend from the April low:
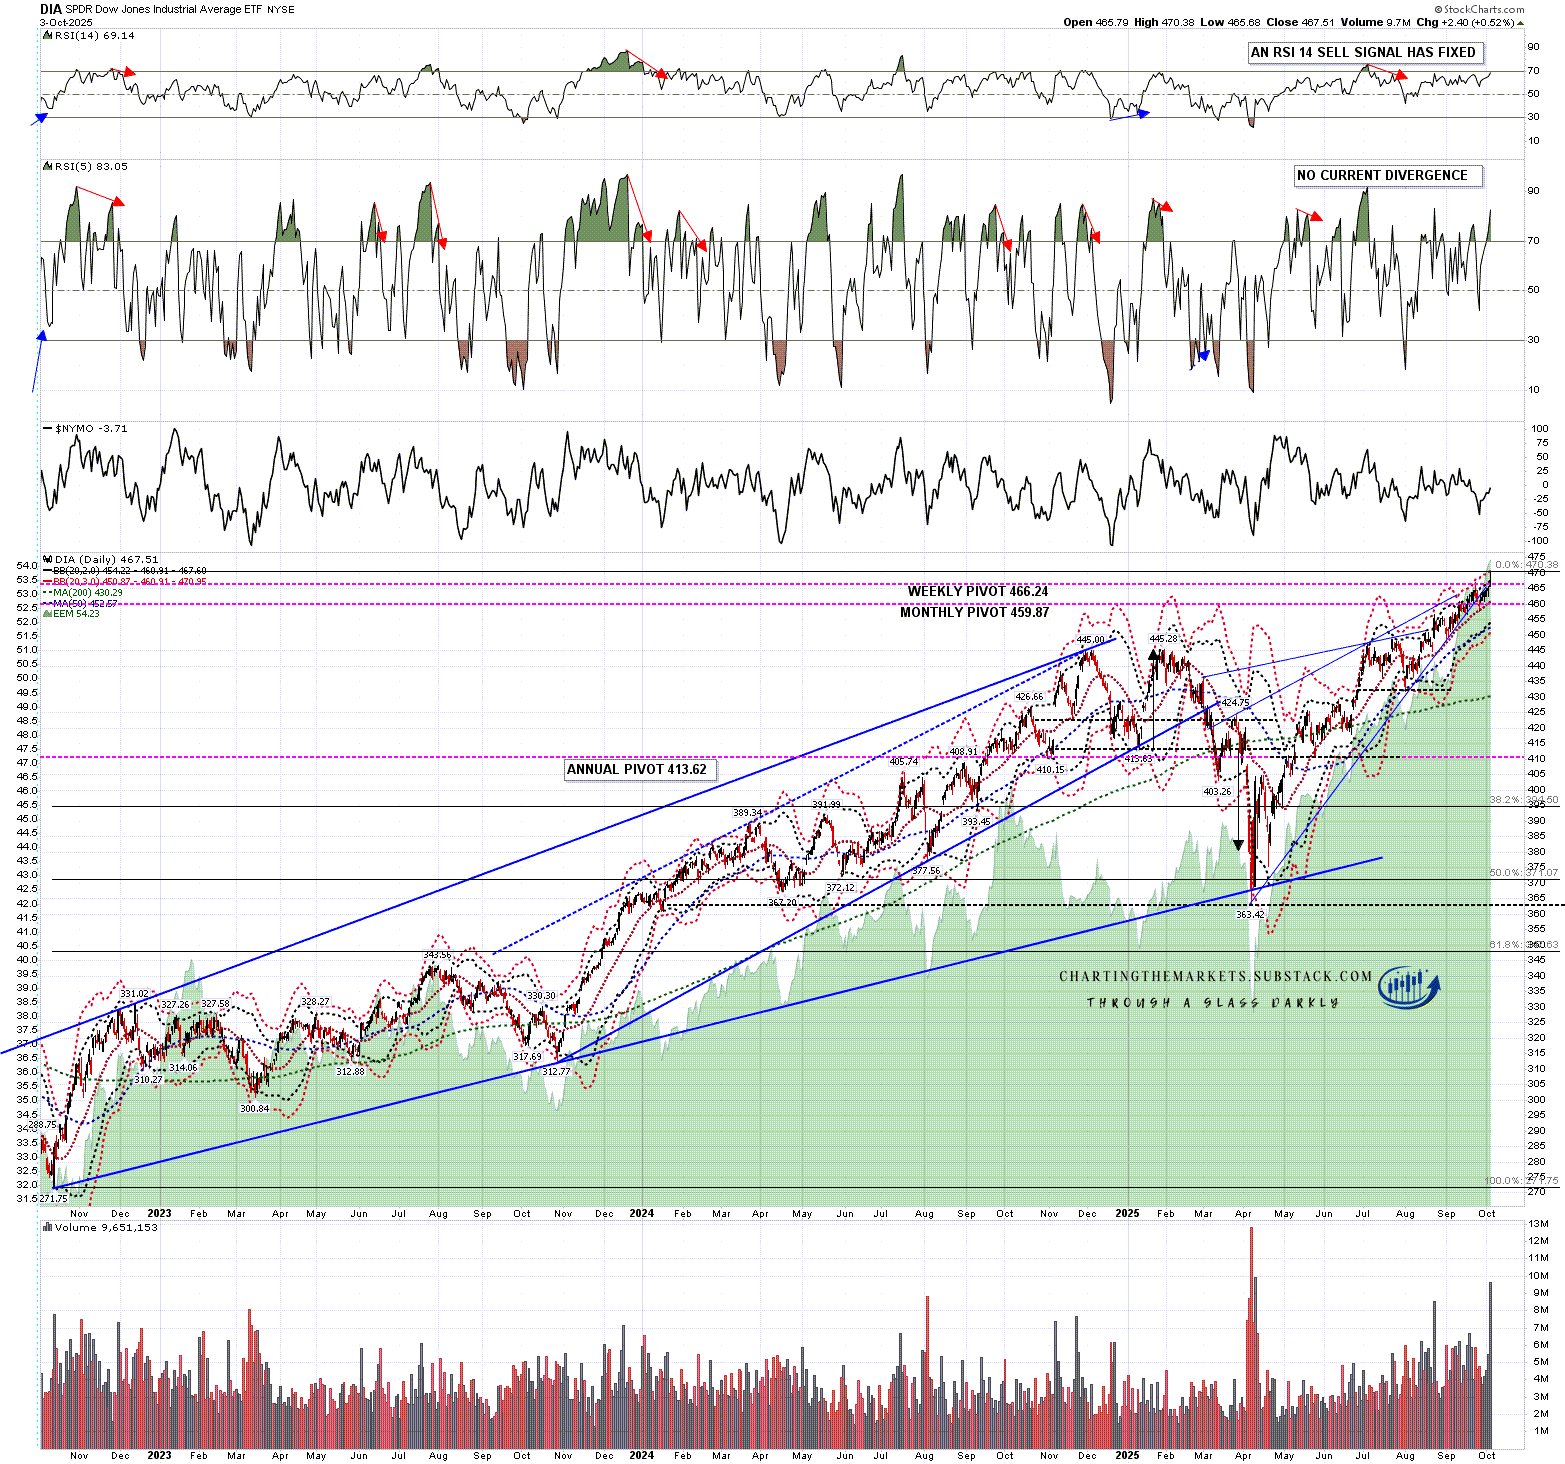
On DIA a daily RSI 14 sell signal fixed back in August, but there is no current negative divergence on the daily RSI 5.
The daily middle band closed last week at 460.91 after a near perfect backtest in the last retracement and, until we see a sustained break below, this remains in a strong uptrend from the April low:
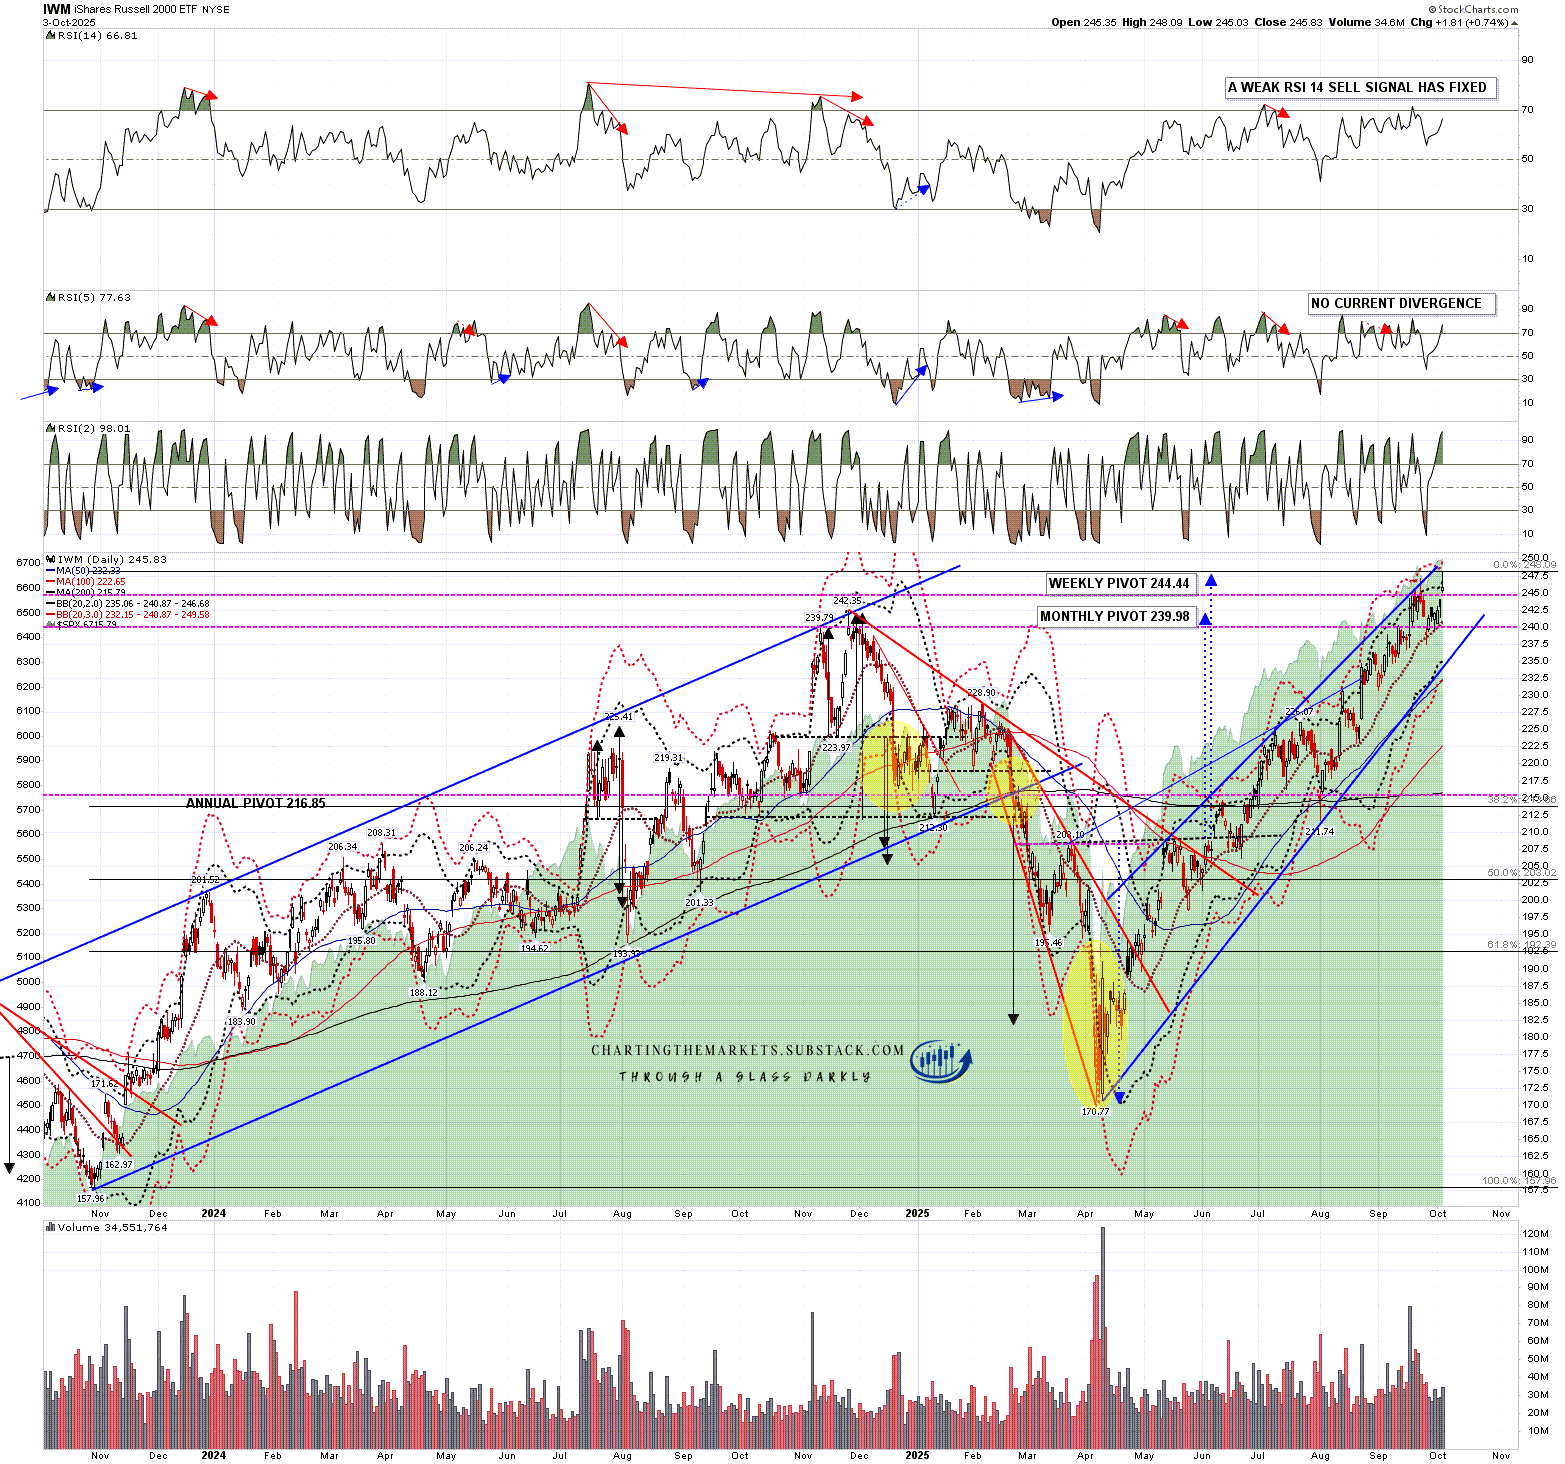
On IWM a weak daily RSI 14 sell signal fixed back in July, but there is no negative divergence on the daily RSI 5.
The daily middle band closed last week at 240.87 after a backtest in the last retracement and, until we see a sustained break below, this remains in a strong uptrend from the April low:
In terms of the historical stats this week they lean neutral to bullish today, 61.9% bearish tomorrow, neutral to bearish on Wednesday, 61.9% bullish on Thursday and neutral on Friday. Overall a neutral week with a modestly bearish lean into the close on Wednesday.
Overall I’m thinking we might see a bit of consolidation early this week after last week’s gains, but the overall lean remains up, with some caution as there may be blowback from the government shutdown as that progresses. It does look as though this shutdown might last into November as there are currently no obvious negotiations ongoing to end it.
If you like my analysis and would like to see more, please take a free subscription at my chartingthemarkets substack, where I publish these posts first. I also do a premarket video every day on equity indices, bonds, currencies, energies, precious commodities and other commodities at 8.45am EST, but only for paying subscribers. Other places to find me are my twitter, and my Youtube channel.
No comments:
Post a Comment