- WE'RE JUST RANDOM SPECKS OF DUST IN A TORNADO TO THE MARKETS .......
- CHARTISTS MUST PUT ALL BIAS ASIDE AND LET THE CHARTS DO THE TALKING OR WE'LL SEE ONLY WHAT WE WANT TO SEE
- This blog has a copy of all header posts that I publish anywhere, so that those interested in seeing what my thoughts are on the markets can find them easily.
- I will be answering questions and responding to comments, so feel free to respond to any posts and I will see your comment even if it is not on the most recent post.
- If you're interested in seeing any intraday charts I post, I do that on twitter, and my twitter handle is @shjackcharts.
- The charts in the posts are as large as I can practically make them. if you would like to look at one more closely, click on it, and the link will take you to a larger version at screencast. If you click on that again, you will get a full page version, and can use the resizing function on your browser to enlarge parts of interest further.

Monday, 29 September 2025

We Could Still See Another Leg Down Directly

In my post on Monday September 15th and my post on Friday 19th September I was looking in detail at the historical stats suggesting that after Tuesday 16th September last week there was a short bearish window into the end of September, and looking at the limited pattern support for a modest retracement then.

In my last post on Friday 26th September I was looking at the backtests of the daily middle bands on SPX, DIA and IWM and saying that the minimum targets for a modest retracement had been met. The bearish window still runs into the close tomorrow, as the last day of September and the third quarter, but equity indices might well run directly back into new highs.

Today I would like to look at the possibility that we might still see another leg down into the end of the month as there are possible pattern setups and targets for that.

In terms of the historical stats this week tomorrow leans bearish, Wednesday is the first day of the month and, as these often do, leans bullish, and Friday leans strongly bullish.

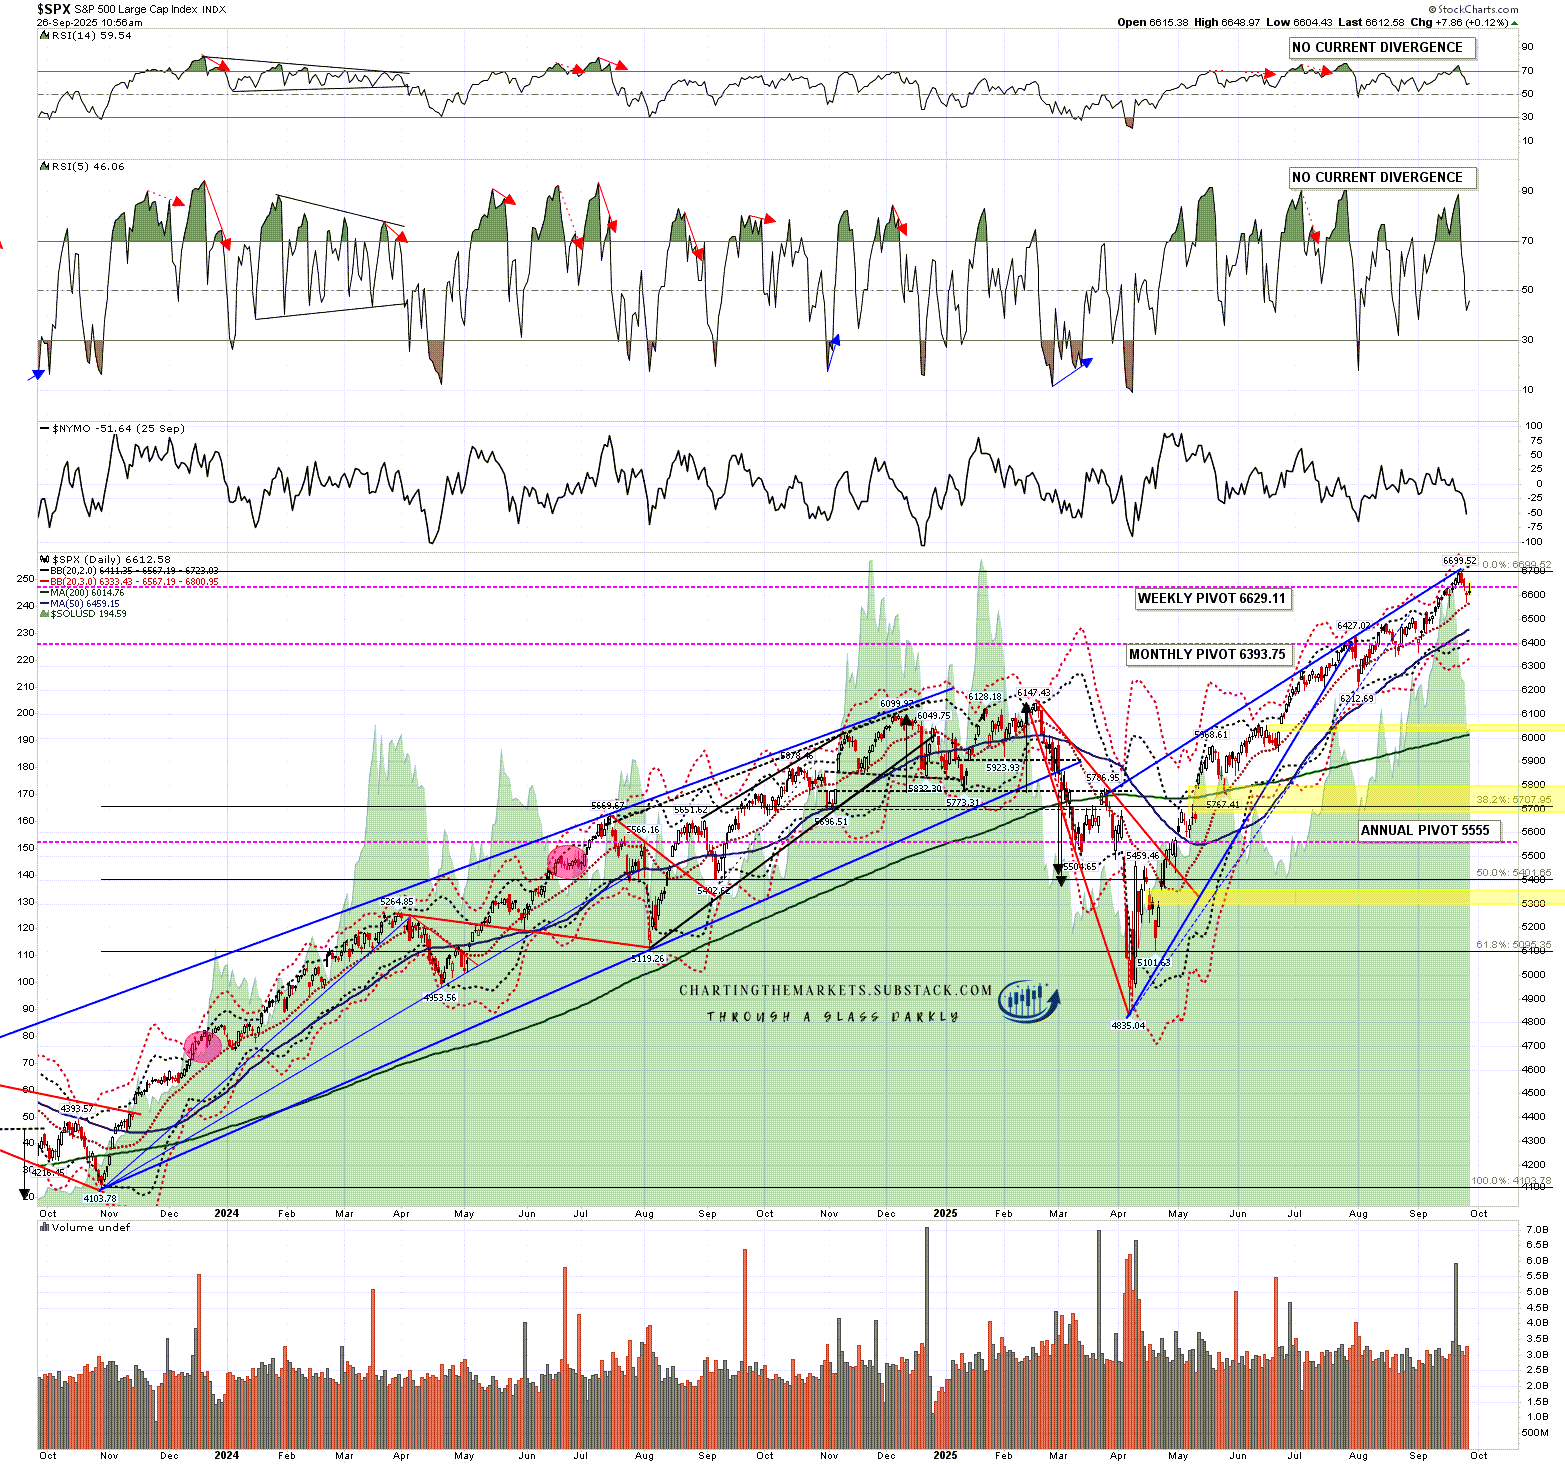
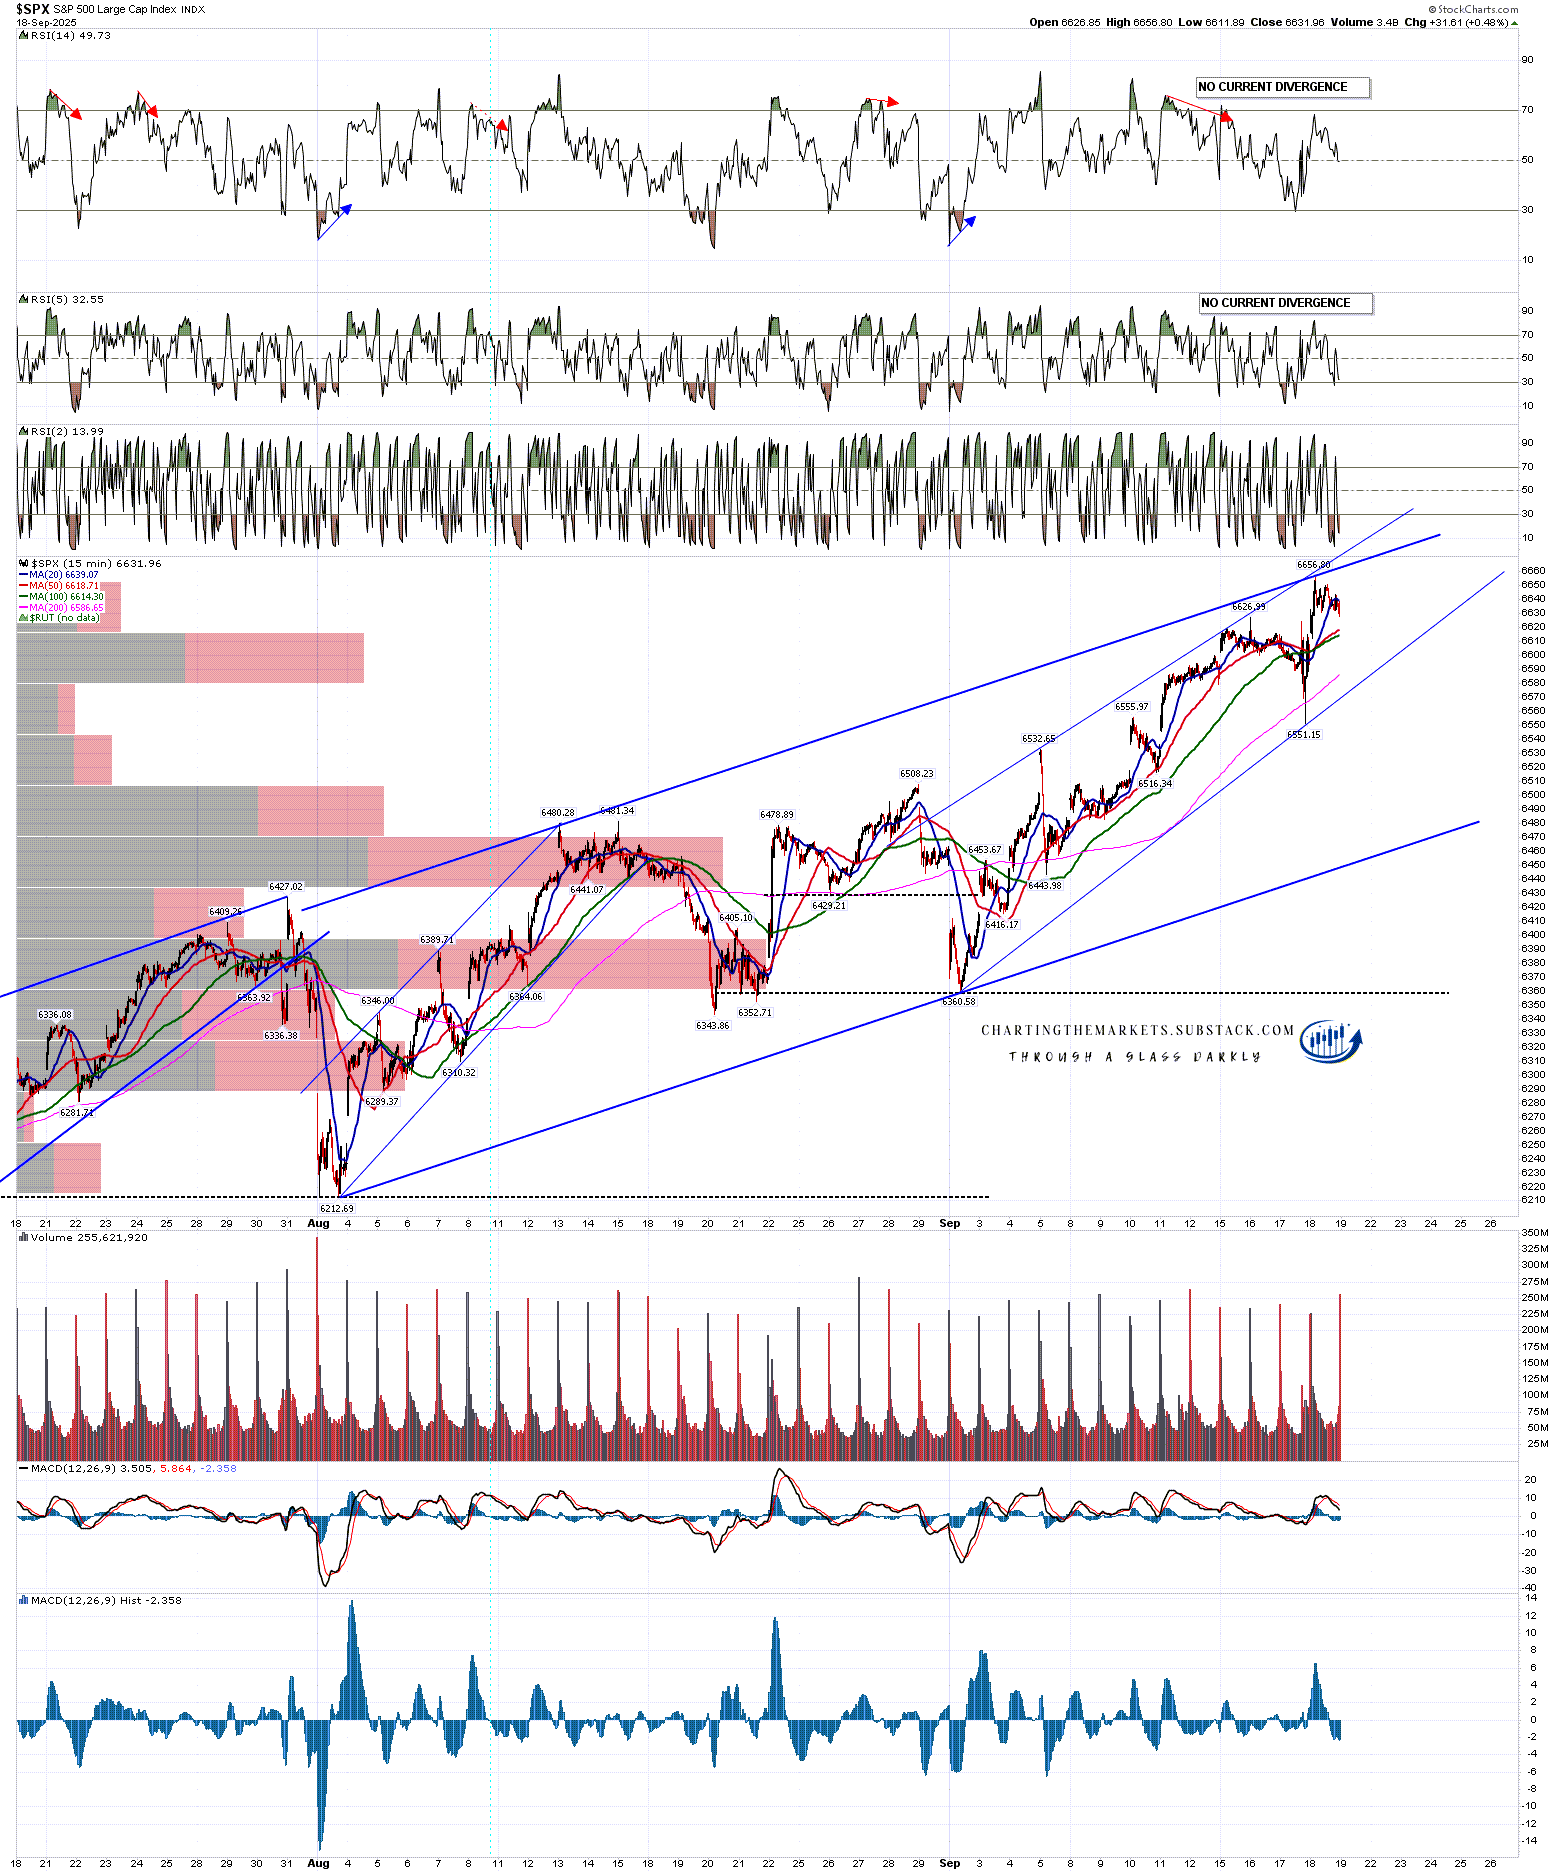
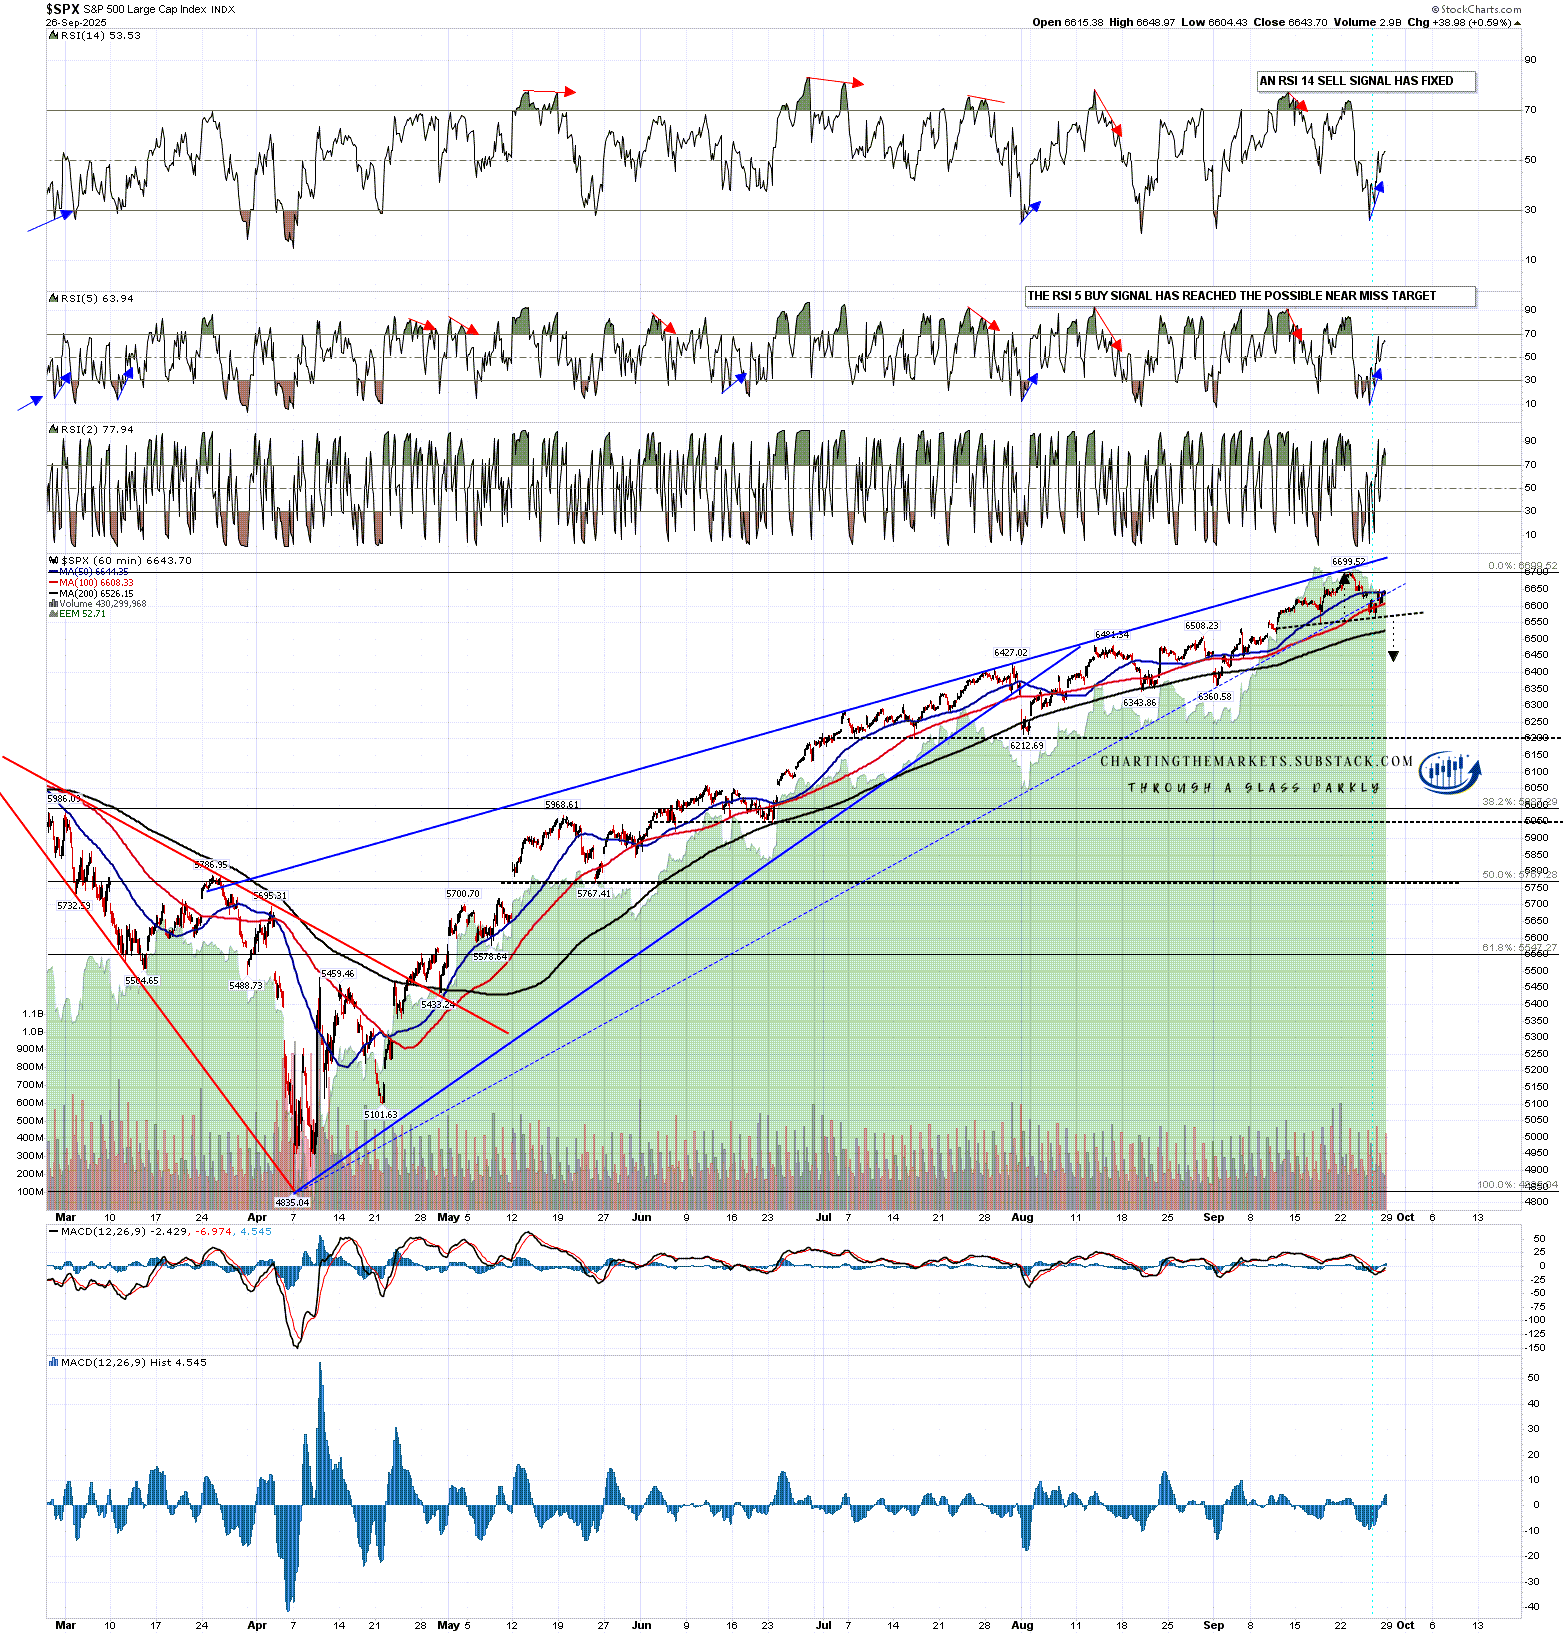
On SPX an H&S could be forming here, and on a sustained break below the H&S neckline, currently in the 6570 area, would have a target in the 6430 area. I would note that there is still a fixed hourly RSI 14 buy signal, but that is the only such hourly buy signal across these equity indices.

SPX 60min chart:

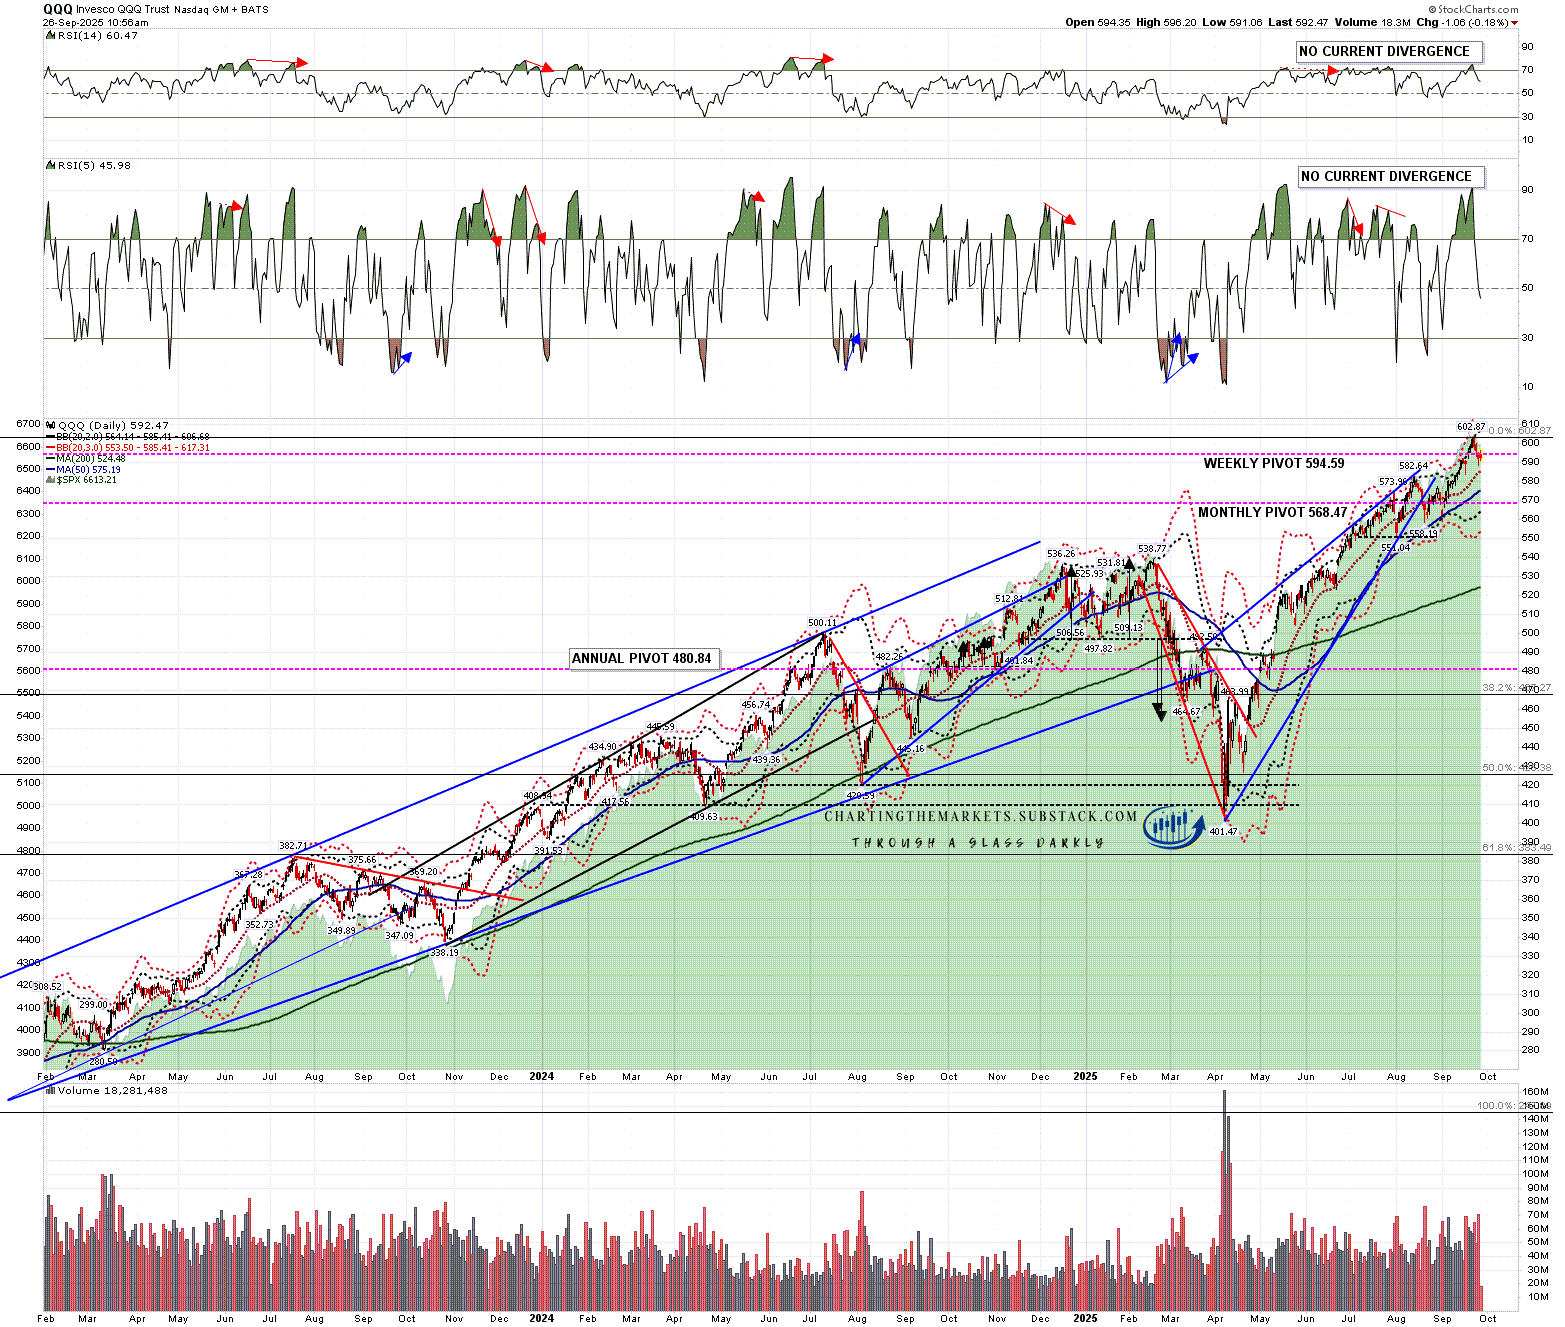
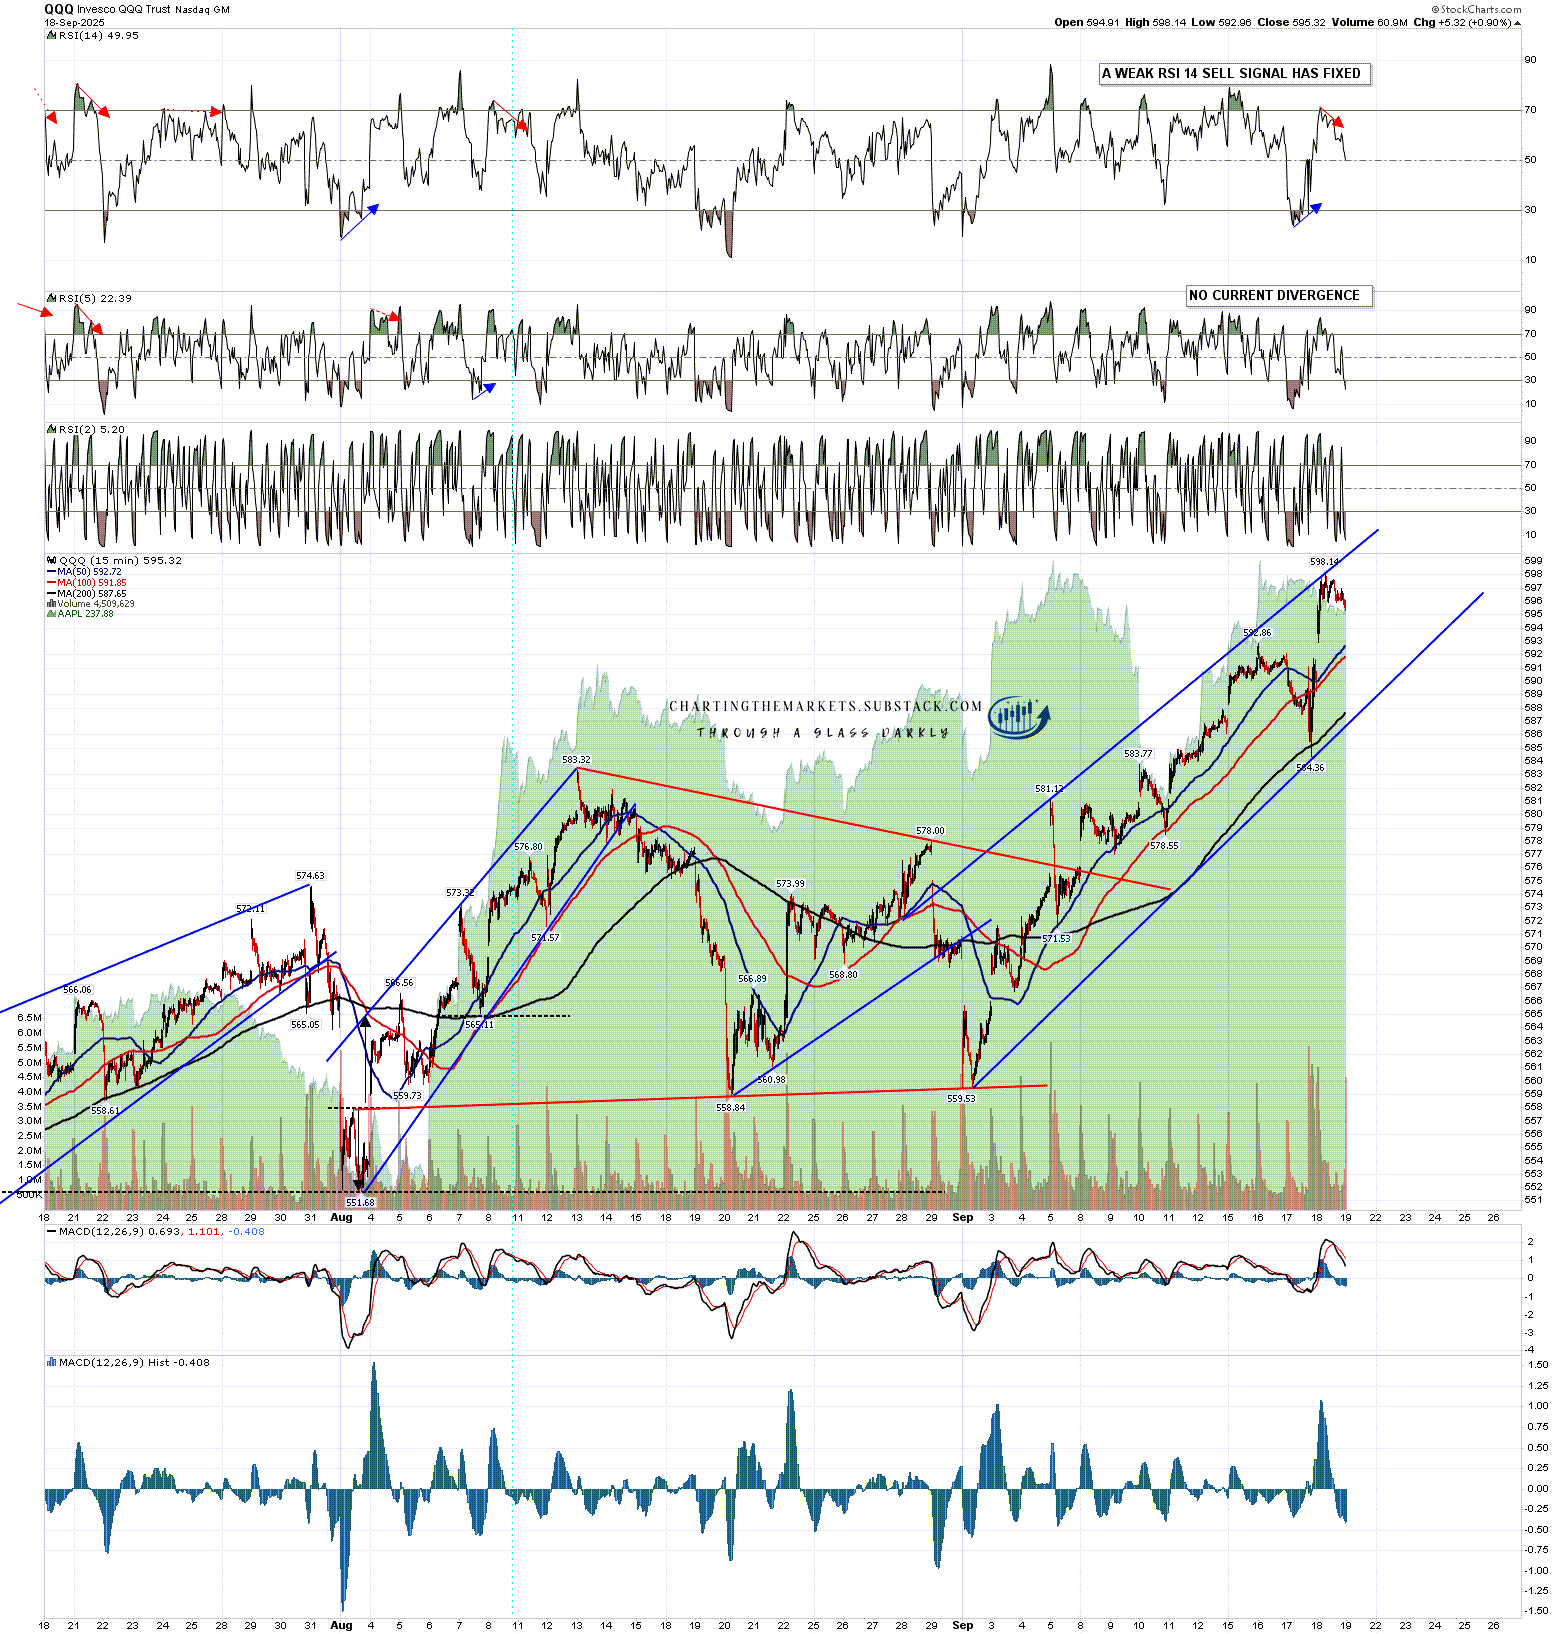
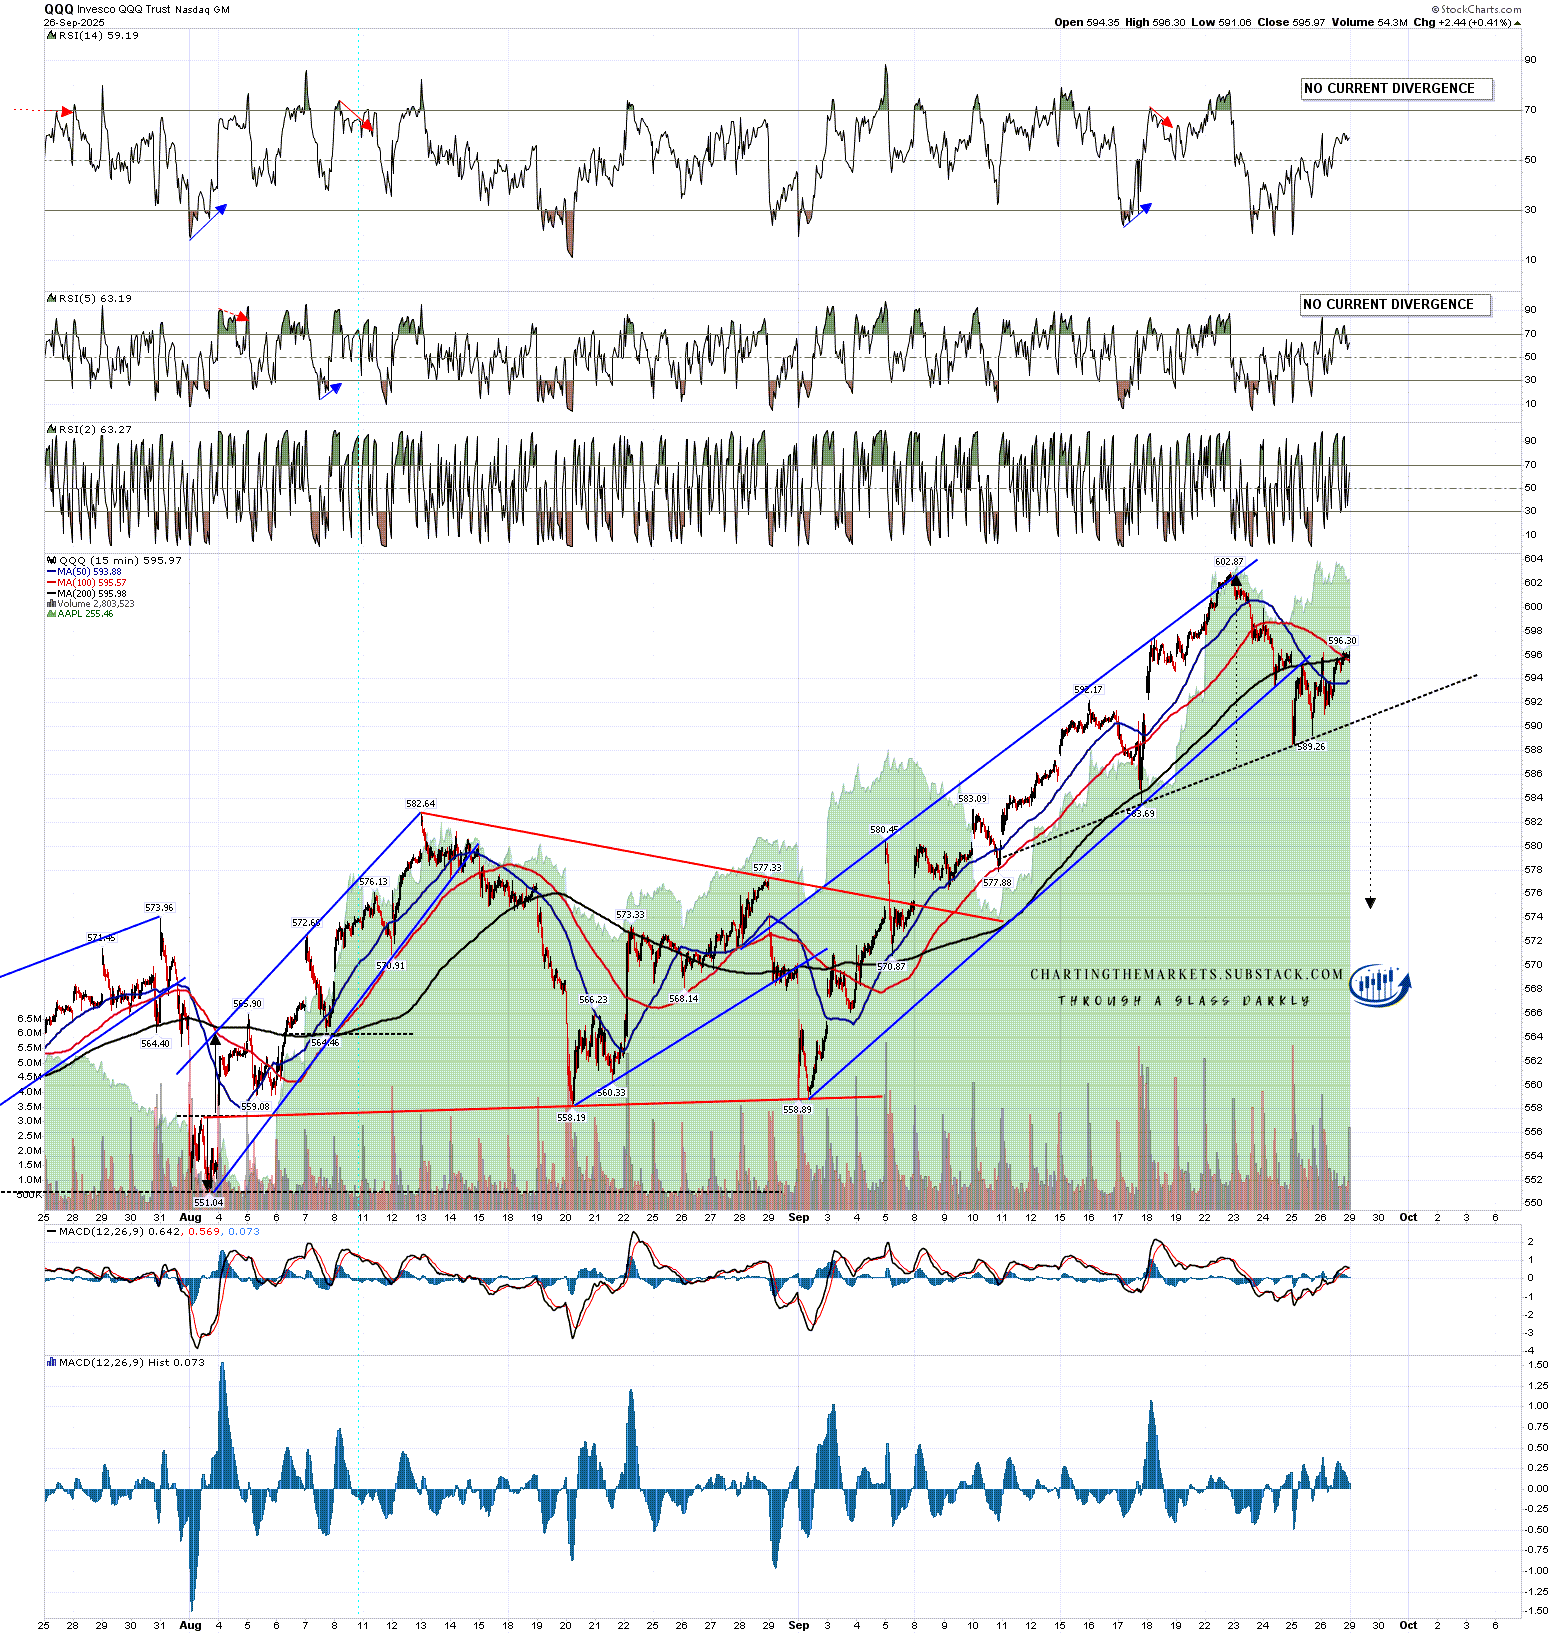
On the QQQ 15min chart there is also a possible H&S, though less high quality, and on a sustained break below the H&S neckline, currently in the 590-1 area, the target would be in the 574-5 area:

QQQ 15min chart:

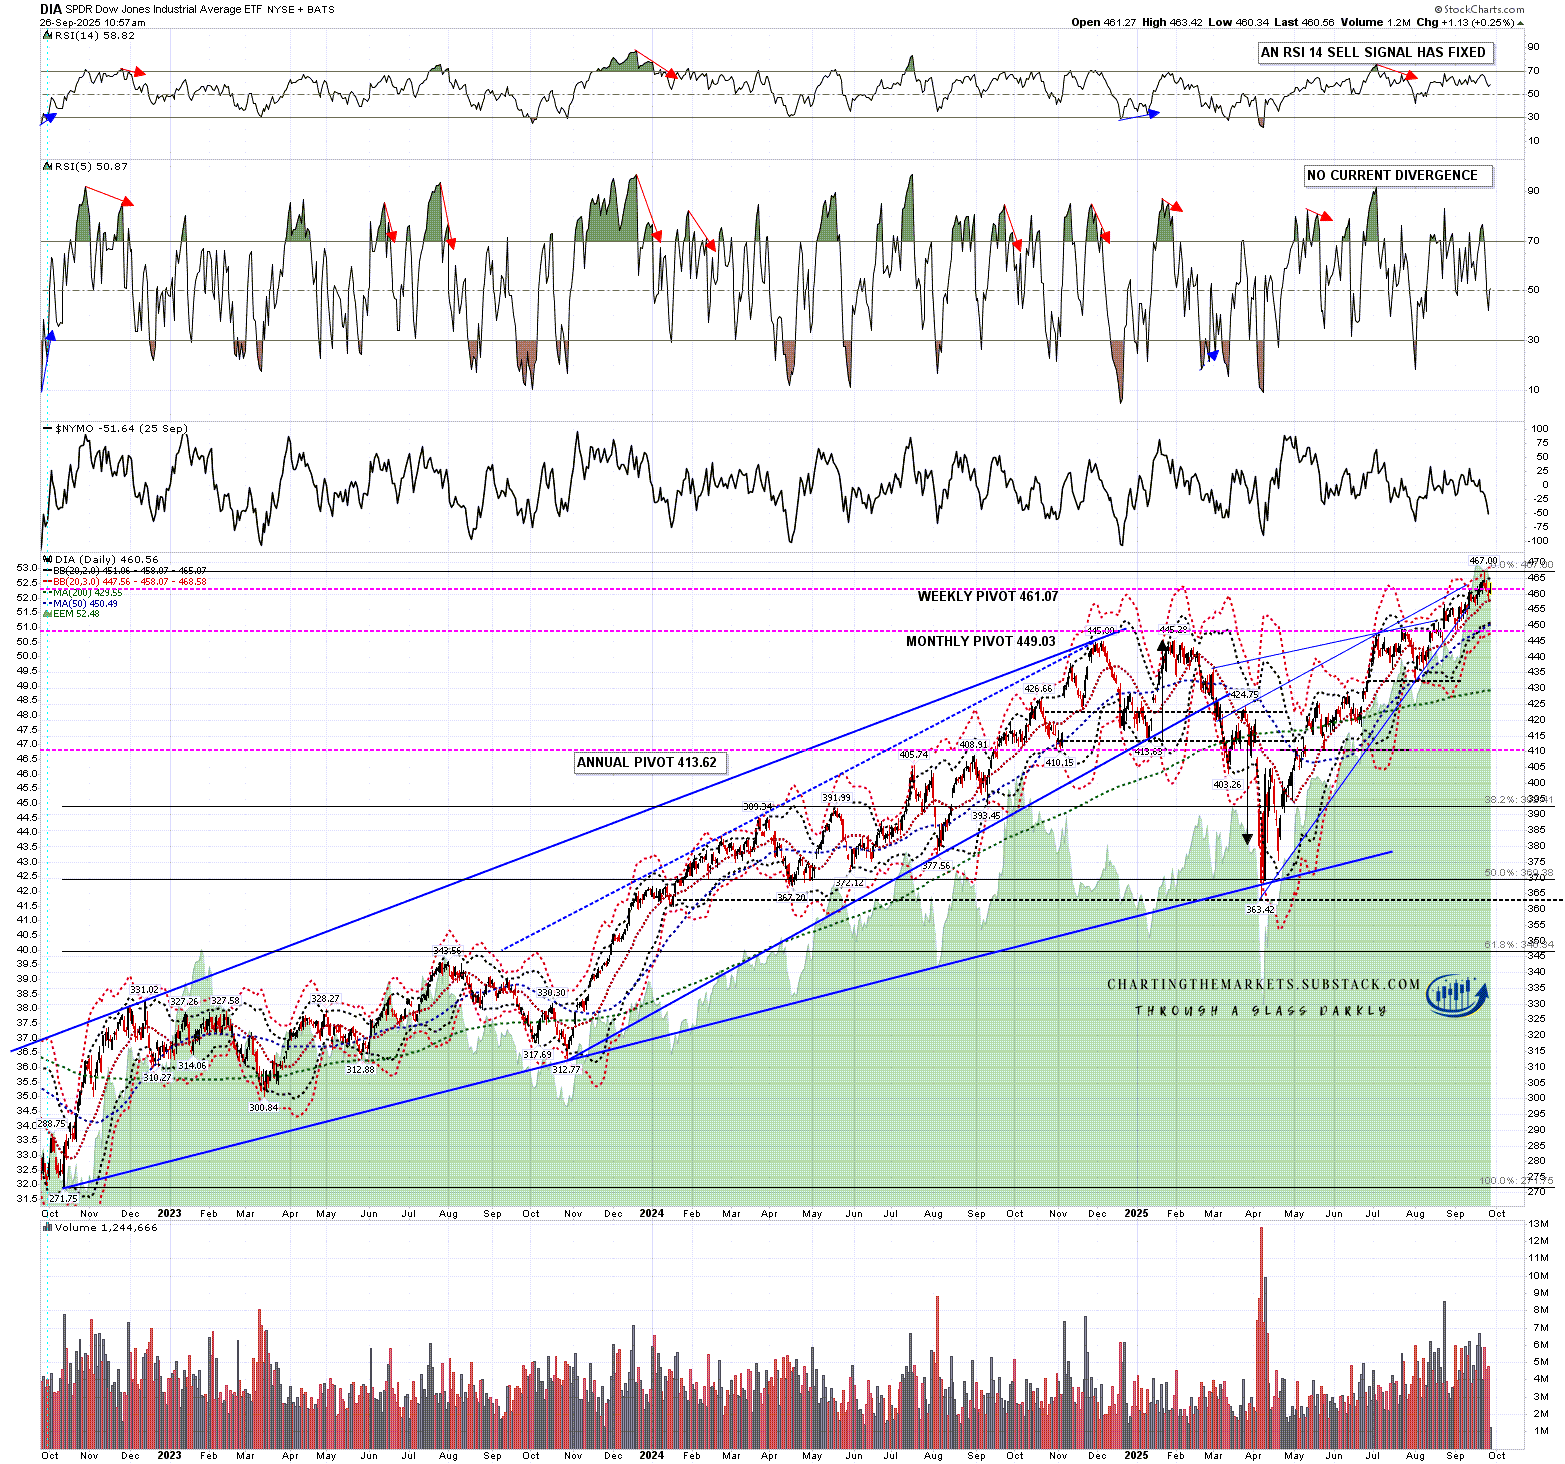
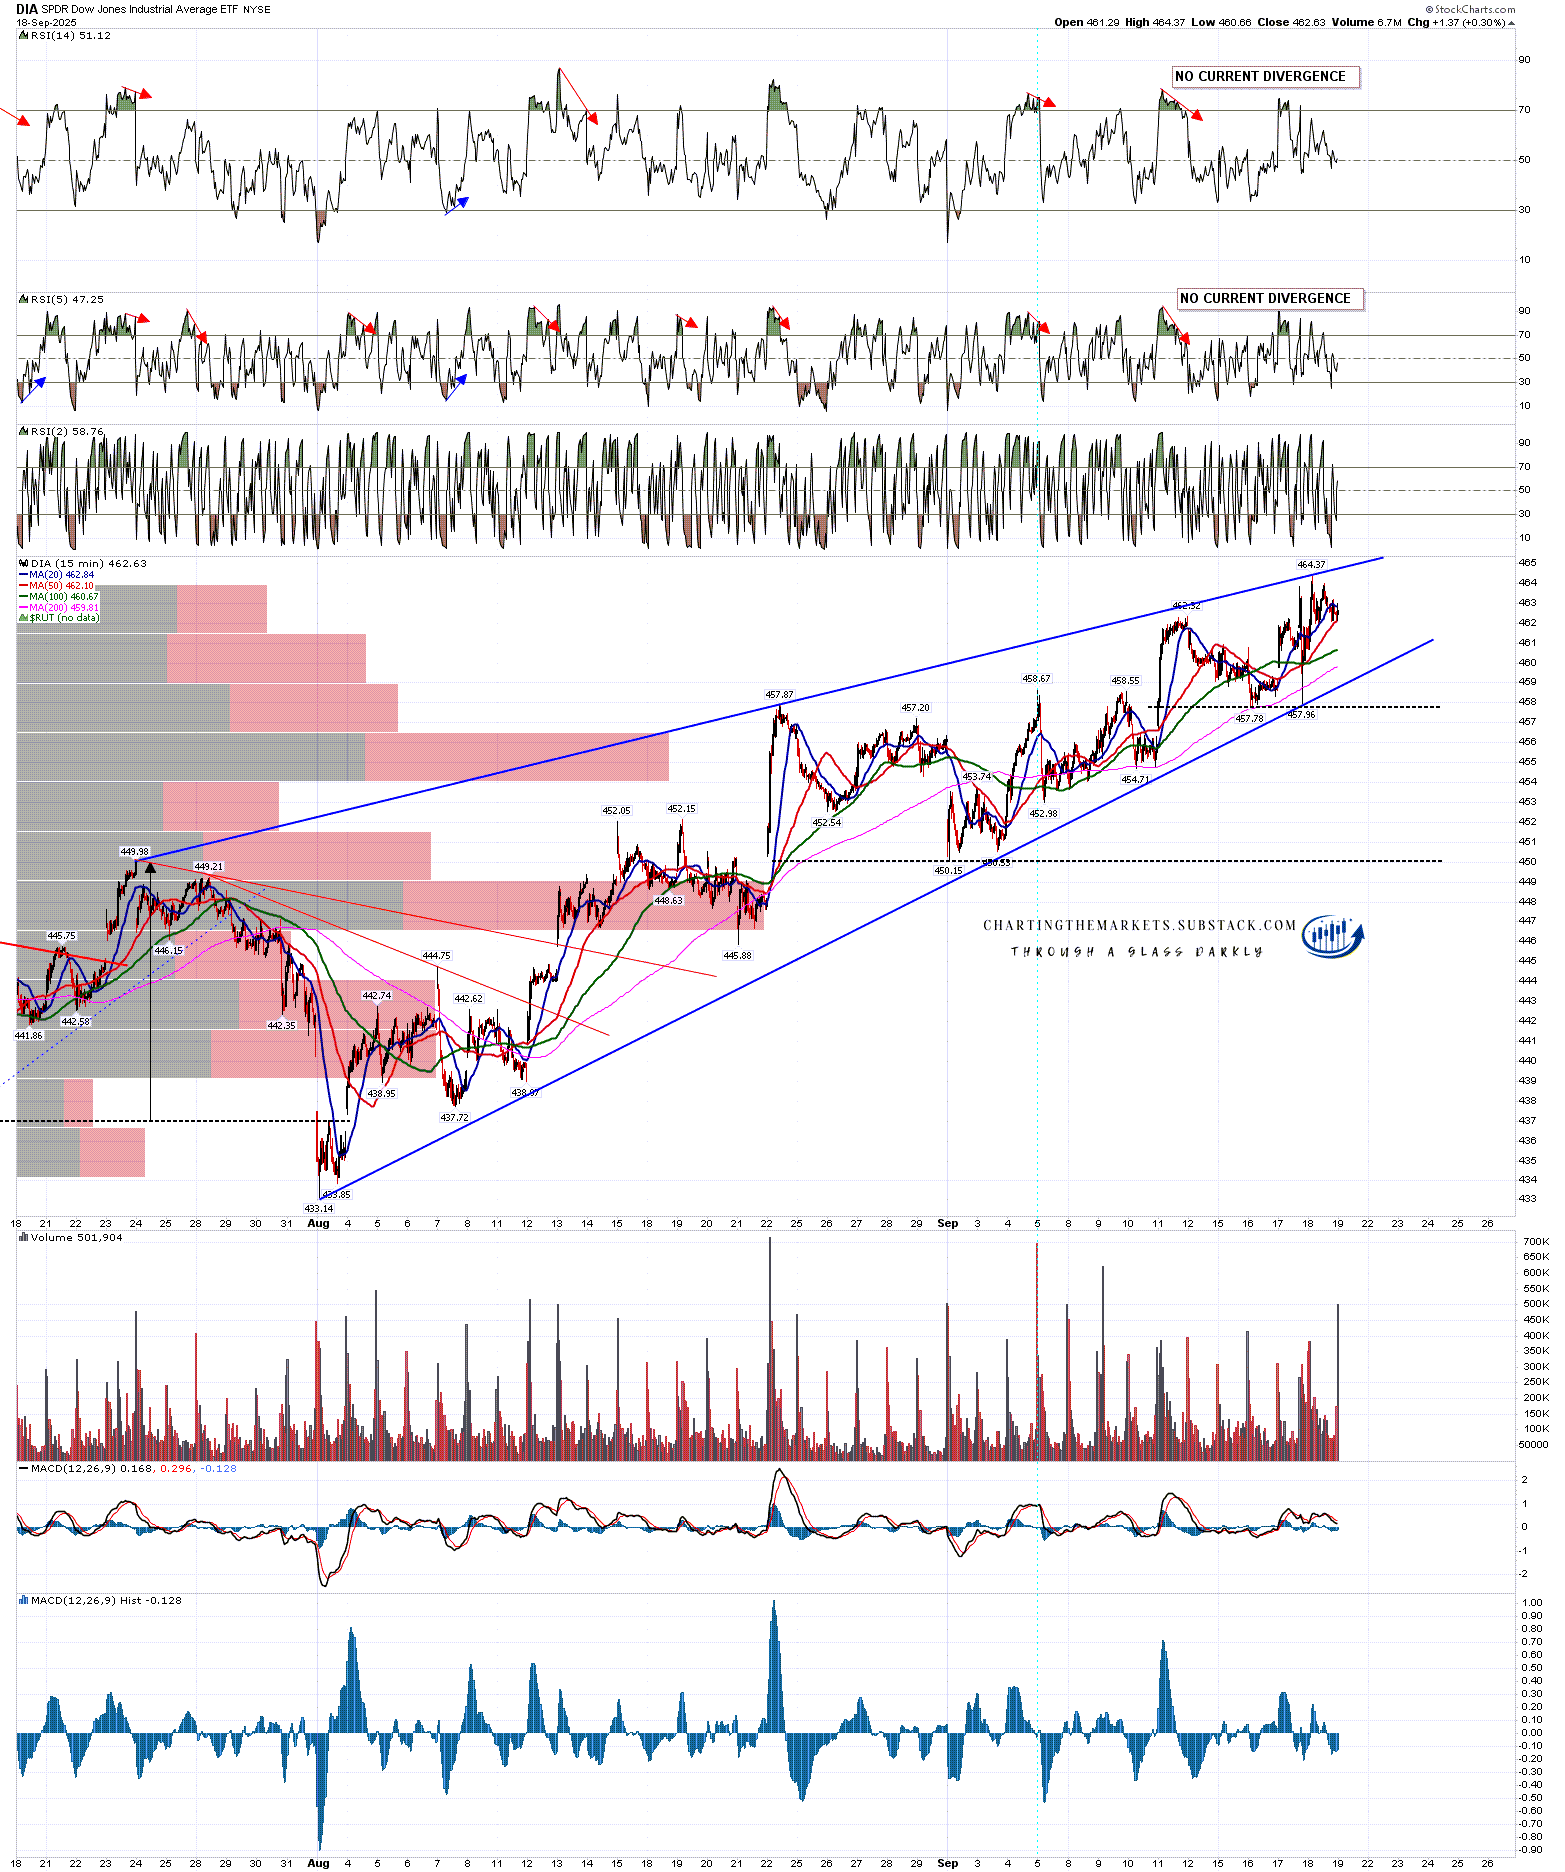
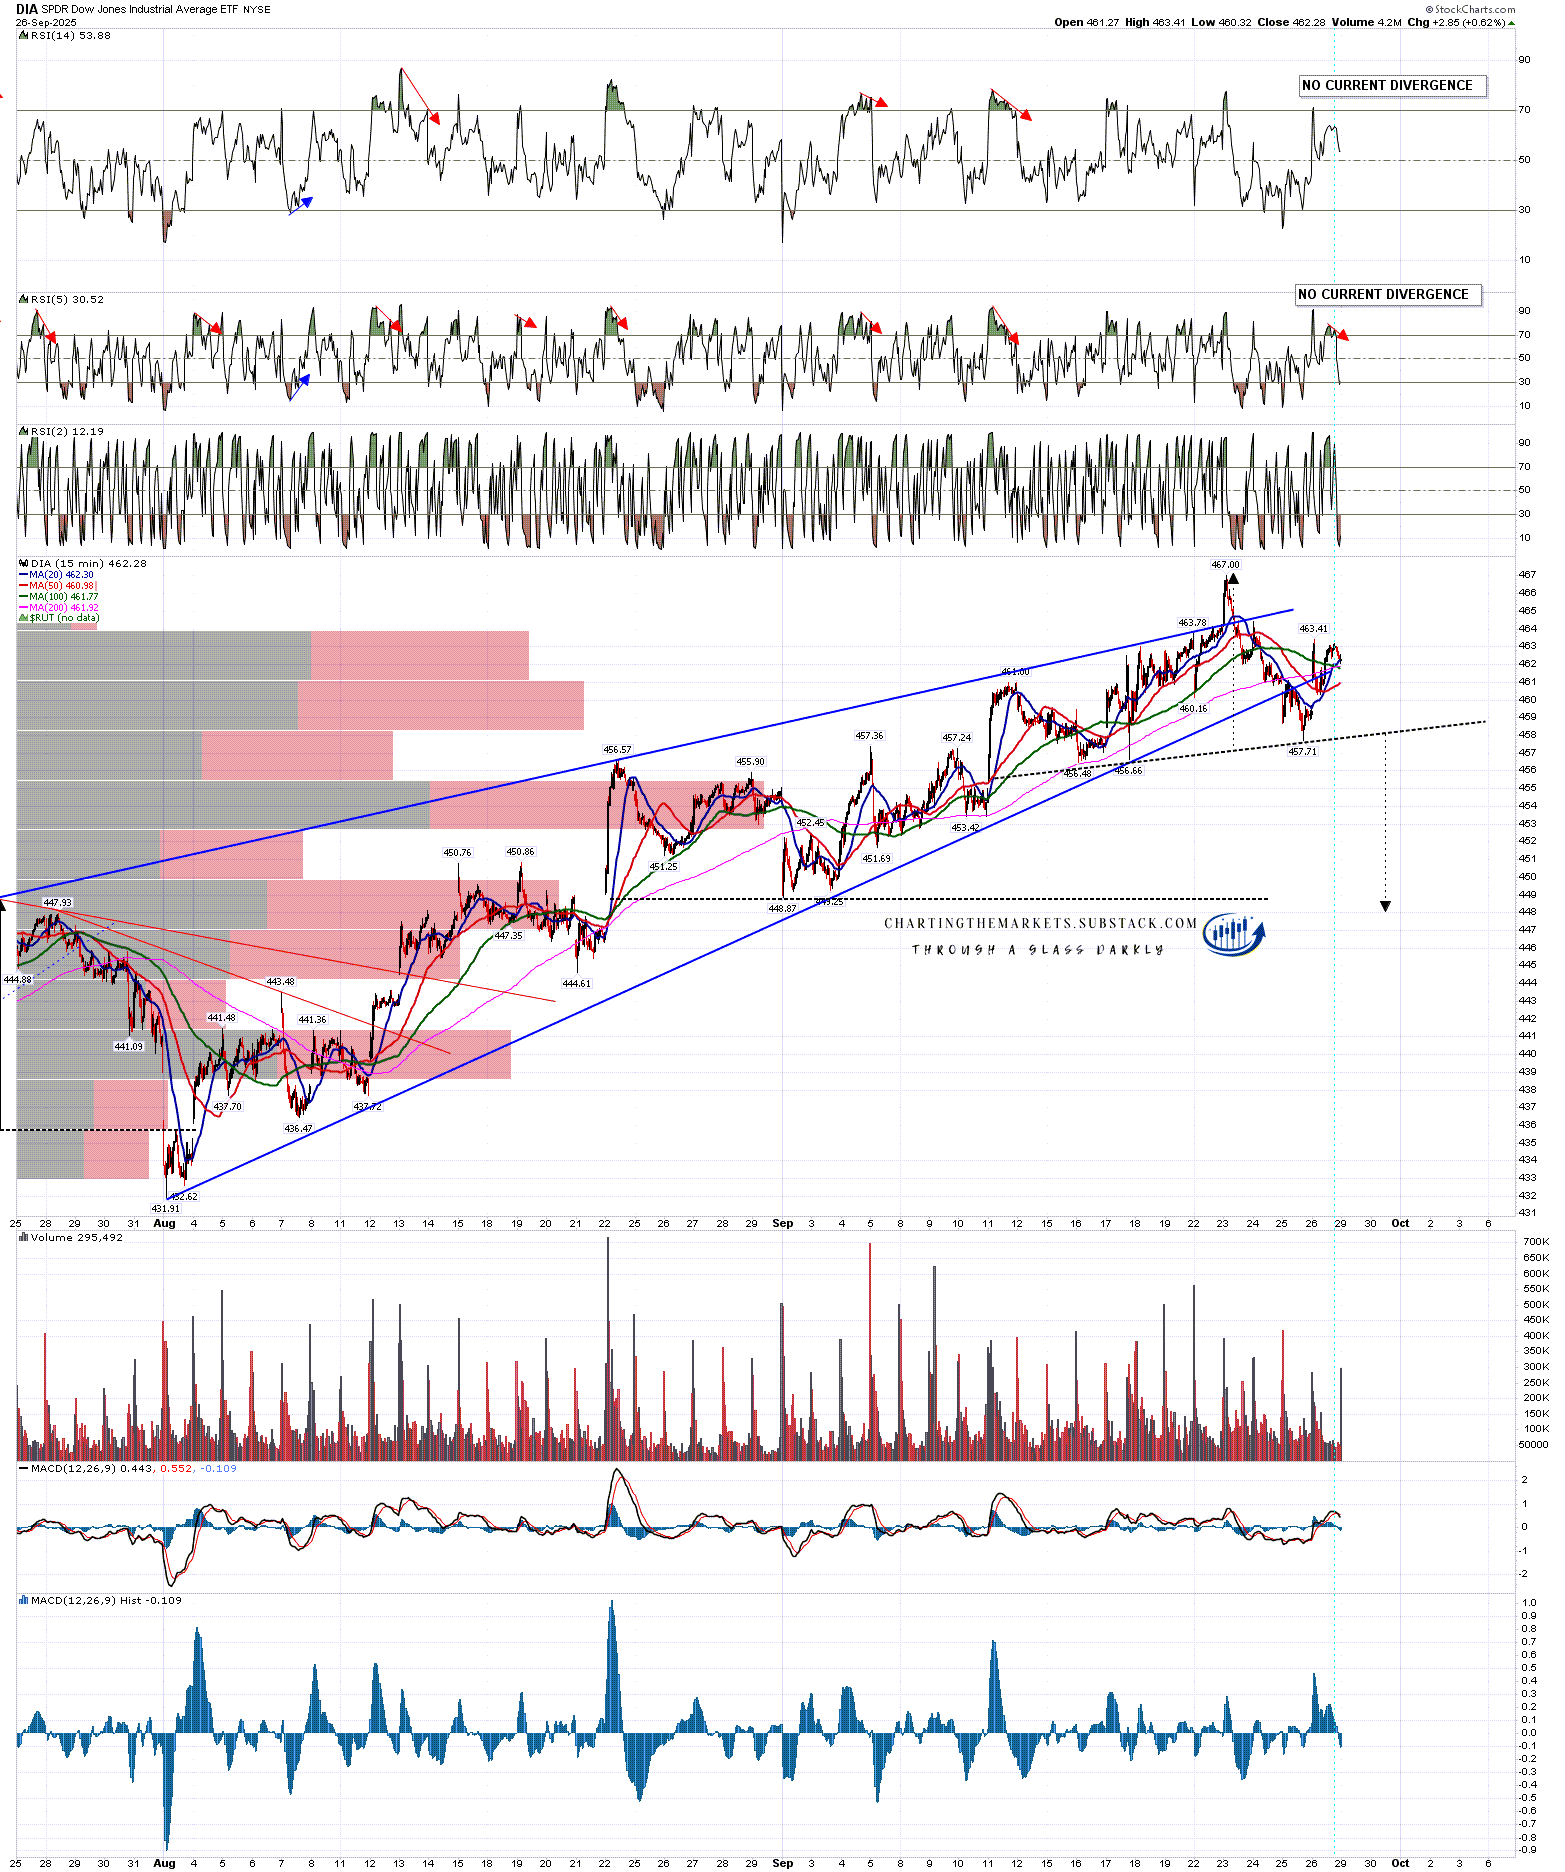
On the DIA 15min chart there is also a possible decent quality H&S setup, and on a sustained break below the H&S neckline, currently in the 458 area, the target would be in the 448 area:

DIA 15min chart:

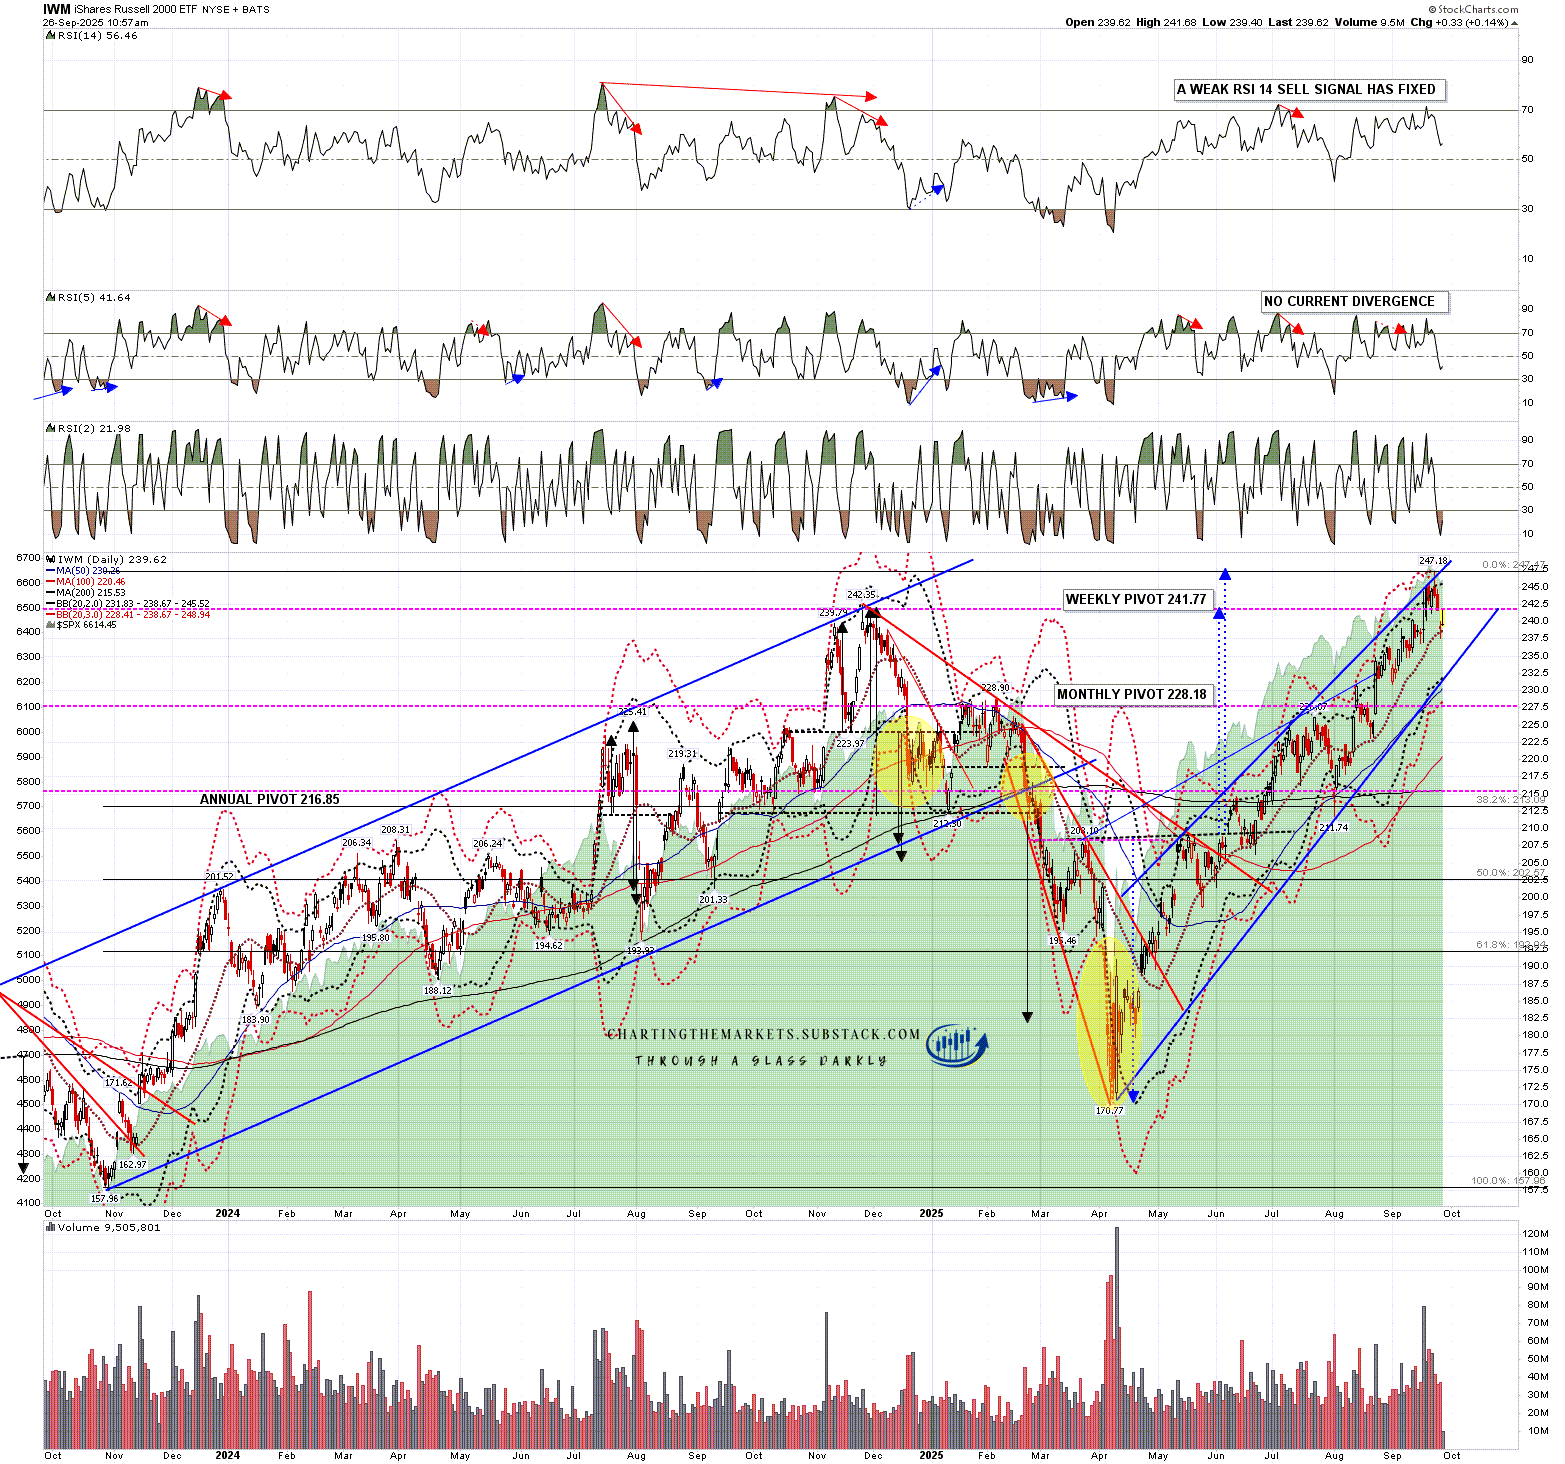
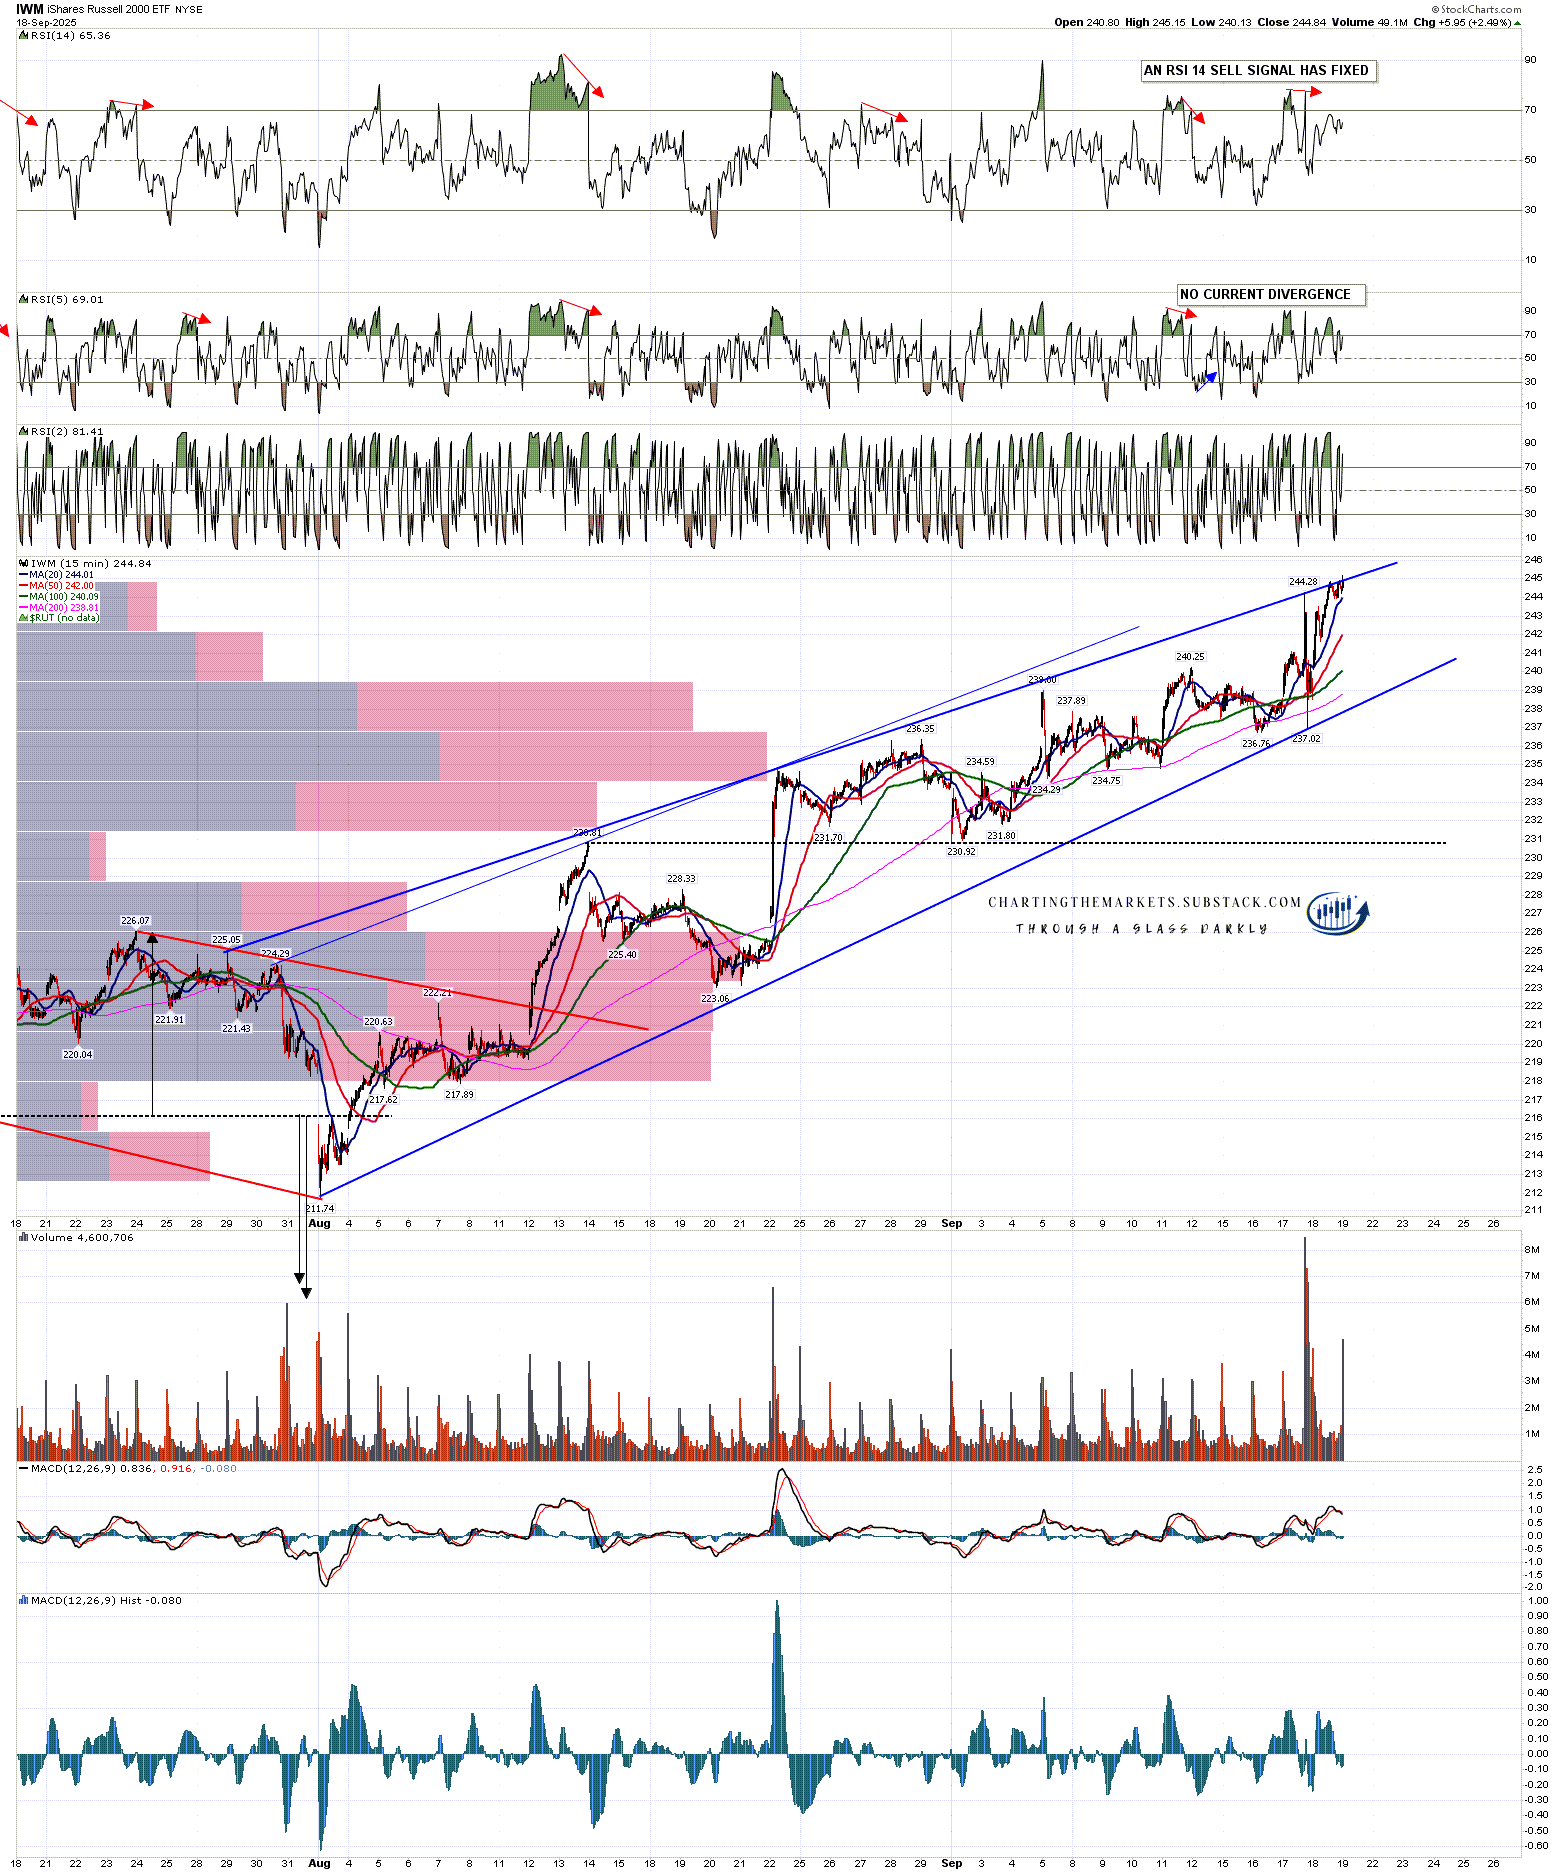
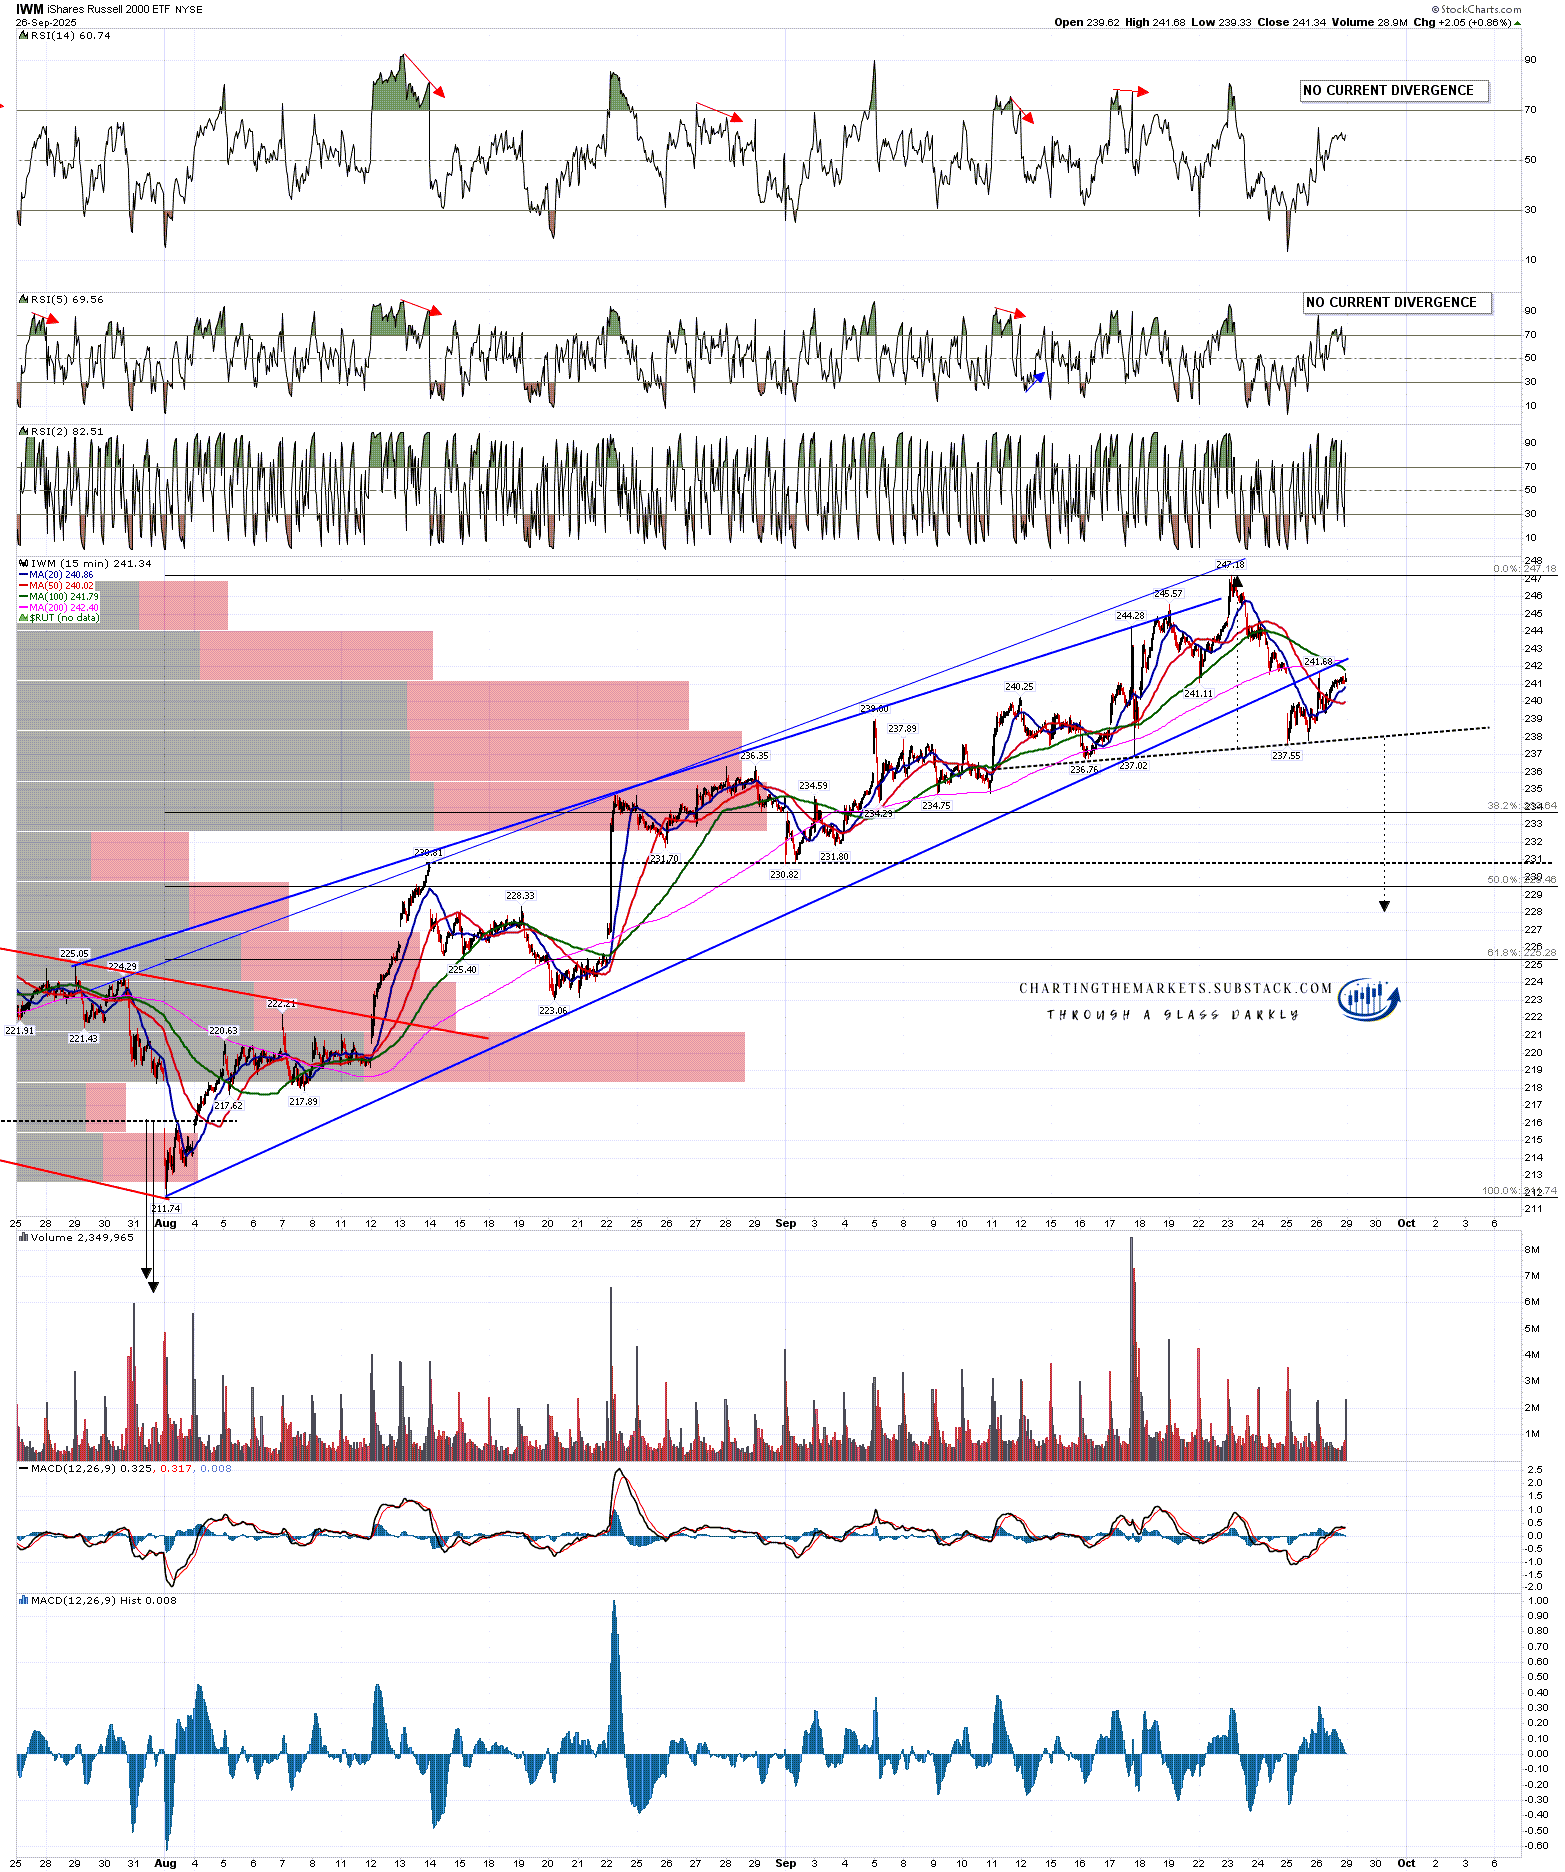
On the IWM 15min chart there is also a possible decent quality H&S setup, and on a sustained break below the H&S neckline, currently in the 238 area, the target would be in the 228 area:

IWM 15min chart:

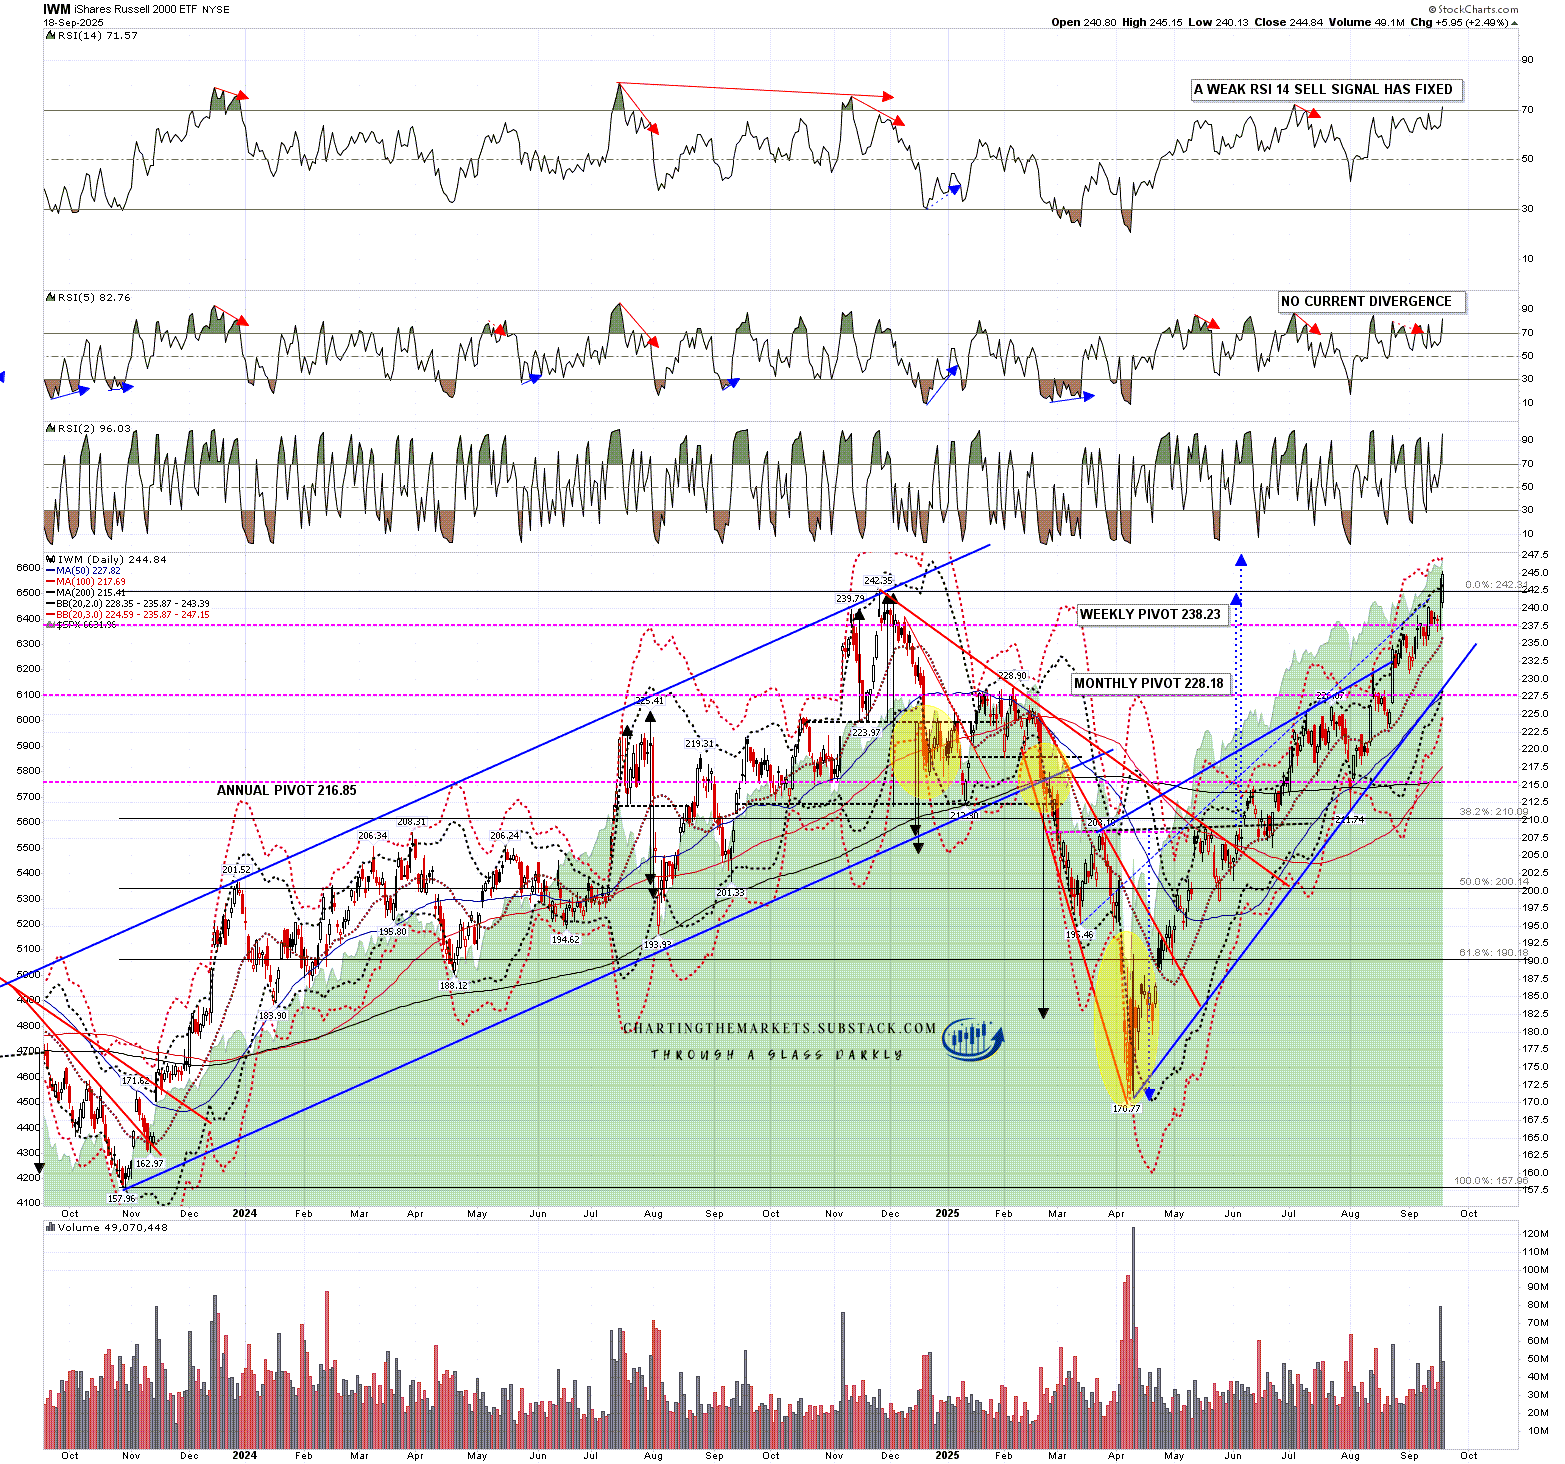
If instead SPX and QQQ head back directly into retests of their all time highs, then that would set possible daily sell signals brewing, with daily sell signals already fixed of course on DIA and IWM.

We could still see a larger retracement in October. There’s no clear bearish leaning window in October but that is the last of the historically weakest six months of the year and there have been a lot of bearish moves in October historically.

SPX daily chart:

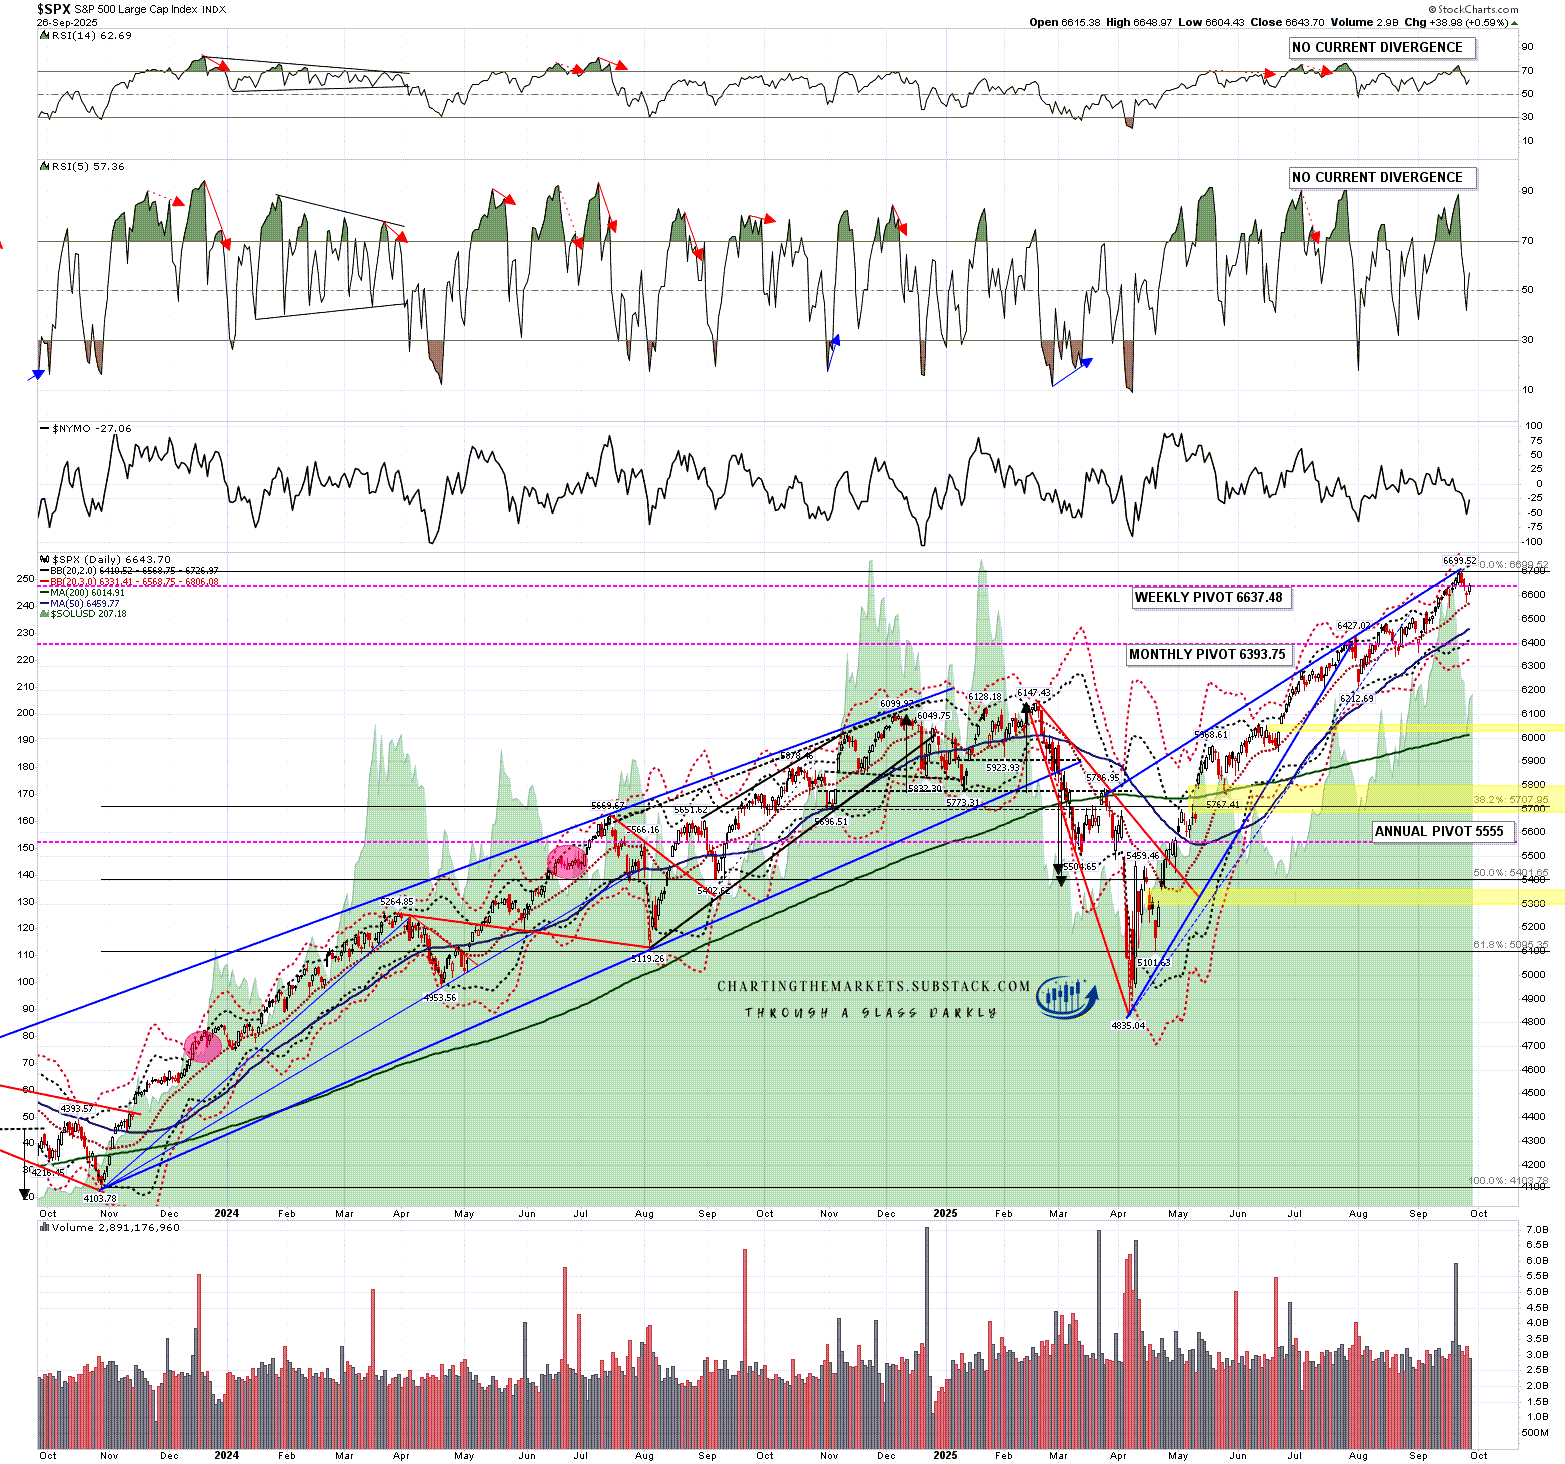
What are the odds of seeing these H&S patterns play out today and tomorrow? Possible but not that likely IMO, maybe 25% to be generous. The setup for a larger retracement would look better if SPX and QQQ retest their all time highs and fail there, setting up high quality double tops with daily negative divergence. We’ll see.

Are equities looking extremely overvalued here? Definitely, but as John Maynard Keynes noted, ‘the markets can stay irrational longer than you can stay solvent’. I’m watching for a decent looking big topping setup to form, akin to the one I posted at the highs on 19th February, and I don’t see it yet. As I have been all year I’m still looking for a possible big high forming into December.

If you like my analysis and would like to see more, please take a free subscription at my chartingthemarkets substack, where I publish these posts first. I also do a premarket video every day on equity indices, bonds, currencies, energies, precious commodities and other commodities at 8.45am EST, but only for paying subscribers. Other places to find me are my twitter, and my Youtube channel.

Friday, 26 September 2025

This Bearish Window Is Closing

In my post on the morning of September 3rd, just after the sharp decline on the first trading day of this month, I was noting buy signals on all six of the hourly equity index futures charts that I follow, and those all delivered over the remainder of that week. When four or more of these fix at once on the hourly futures they generally deliver.

In my the Bigger Picture video on Sunday 7th September I was noting the strongly bullish leaning historical stats for the coming week and was suggesting a target for QQQ at a retest of the August all time high at 583.32, and we saw that with a new all time high at 587.86, seeing also new all time highs on SPX and DIA, and IWM moving closer to the IHS target at a retest of the Nov 2024 all time high at 243.04.

In my post on Monday September 15th and my last post a week ago I was looking in detail at the historical stats suggesting that after Tuesday last week there was a short bearish window into the end of September, and looking at the limited pattern support for a modest retracement

That bearish window is not yet over, but the strongest part of it is over. The stats favor the bullish side today, are neutral to bullish on Monday, with a bearish leaning day on Tuesday, last day of the month and down on SPX 18 out of the last 27 years. That ends the bearish window, with bullish days on Wednesday and Friday next week and generally bullish leaning tape until the start of the last week in October.

Does that mean that equity indices can’t go down further? No, but the obvious window to do that is closing, and there isn’t much in terms of patterns or divergence to support much more downside.

In the short term SPX has reached the obvious retracement target at a backtest of the daily middle band. This is the sixth backtest since SPX broke back over the daily middle band after the April low and on the last three backtests SPX went a bit lower and closed below the daily middle band for one day before rejecting higher. We could still see that on SPX here before the end of the month but only a sustained break below the daily middle band would suggest any real weakness.

SPX daily chart:

DIA has also backtested the daily middle band at the low yesterday. This hasn’t been as consistently strong support as on SPX, and there have been two multi-day moves back under the daily middle band since the break back above after the April low. There were another seven tests where the middle band was backtested as it was yesterday, and DIA went directly higher from there.

DIA daily chart:

IWM also backtested the daily middle band at the low yesterday. On IWM there has been one multi-day move under the daily middle band since the break back above after the April low. There were further seven tests where the middle band was backtested as it was yesterday, and IWM went directly higher from there.

I would note though that this uptrend on indices was only supported by one major bottoming pattern from the April low, that I first laid out as a possible scenario in my post on 3rd June, which made target last week at a retest of the all time high on IWM made in Nov 2024. That doesn’t suggest a strong reversal here, but that pattern is no longer supporting more upside.

IWM daily chart:

What has supported much of the rest of the upside is tech stocks, which have not been as consistently bullish as SPX since the April low, with two breaks since then below the daily middle band that lasted a couple of days and only one other full middle band backtest otherwise. That wasn’t yesterday as QQQ is the only one of these four indices that has not backtested the daily middle band on this retracement. There is no strong history of full backtests on the daily middle band on QQQ, and no obvious reason to expect one now.

QQQ daily chart:

In my last post I said that:

Is there anything so far suggesting a significant high being made here? No, though that could change. If so we might still see a decent retracement in October, which is a strong month for those historically. I’ll keep an open mind and call out any decent patterns that form.

Overall I am liking bearish leaning tape into the end of the month and a possible retracement of some of the decent gains made in September. We’ll see.

On the bigger picture since late 2024 I have been leaning towards seeing a possible much more serious high on equities made at the end of 2025 and I didn’t see anything to change that view this week.

We’ve seen that retracement, and we may see a bit more, but to see anything genuinely impressive we would now need to see multiple hard breaks of these daily middle bands, and there’s not much to suggest that may happen here. If that changes I’ll be looking at that, but until then I’m expecting a resumption of the overall uptrend soon.

Everyone have a great weekend. :-)

If you like my analysis and would like to see more, please take a free subscription at my chartingthemarkets substack, where I publish these posts first. I also do a premarket video every day on equity indices, bonds, currencies, energies, precious commodities and other commodities at 8.45am EST, but only for paying subscribers. Other places to find me are my twitter, and my Youtube channel.

Thursday, 25 September 2025

Decision Time on the US Dollar

In my last post on the US Dollar on 26th June I was looking at the very big inflection point forming here on USD that will likely ultimately resolve into a rally back into a retest of the 2022 high at 114.78, or a break down towards the 78-9 area.

Since my last post, on the monthly chart below, USD delivered a small move down to test the rising megaphone support from the 2011 low, rallied and then retested the low, slightly breaking that rising megaphone support.

What would that generally mean? Well the slight break of the rising megaphone support means that my working assumption is now that USD is in an topping process for the move up from the 2011 low, so I am looking for a topping pattern to form, and the retested low has set up a shorter term double bottom that may now deliver a strong rally.

On the bigger picture there is a strong bull flag setup that I was looking at in my last post, and there is now also a possible monthly RSI 5 buy signal brewing, which is something I very much like to see at a possible major reversal back up. The obvious next move would be to return to bull flag resistance and then break up towards a retest of the 2022 high at 114.78, likely to make the second high of a large double top there setting up a topping pattern that might then deliver a return to the 78-9 area, last seen in the 2011-4 period.

USD monthly chart:

On the weekly chart a weak RSI 14 buy signal and a full RSI 5 buy signal have already fixed:

On the daily chart there’s no current RSI divergence, but there is now a very nice looking possible double bottom setup. On a sustained break over 100.26 the double bottom target would be in the to 104.14 to 104.30. That wouldn’t take USD all the way back to bull flag resistance, currently in the 108.80 area, but it would be a good start, and there is a possible IHS neckline in the 102 area that might deliver a larger reversal pattern.

USD daily chart:

As I was saying in my last post, this is a strong bull flag setup on USD that would generally have a strong chance of delivering a retest of the high at 114.78. There is a lot of gloom about the US Dollar here, but I’ve generally found that at big lows bearish sentiment tends to be very strong, just as bullish sentiment tends to be very strong at big highs.

I still really like this setup and this is a classic setup to start to deliver that retest. Even if USD ultimately fails to deliver that retest, this setup still has a strong chance of delivering at least a rally to the 104.14 to 104.30 target area.

The setup is also mirrored by a strong bear flag setup on EURUSD that on a break down would look for a retest of the 2022 low at 0.9538. The Euro is 57.6% of the US Dollar currency index.

EURUSD monthly chart:

There is a also a mirror bear flag setup on GBPUSD, though in this case there is no short term double top setup and I have more doubts about a retest of the 2022 low at 1.0384. Nonetheless the bear flag is there, high quality, and GBP is another 11.9% of the USD currency index.

GBPUSD monthly chart:

There is another thing to mention here, and that is the extensive talk this year that the decline in USD from the January high at 110.18 to the current lows was due to the poor management of the Trump administration.

Now I am no fan of the Trump administration, and I have written in detail about my serious concerns about the economic impact of tariffs and the direction of US debt, but correlation is not causation and I’m not at all convinced that the USD decline this year had anything to do with US government policy. Consider this from the USD charts above:

  1. On the monthly chart you can see my notes from Oct 2022 and Feb 2023 calling the likely high there at the establishment of the rising megaphone resistance trendline, and calling for the return to the corresponding rising megaphone support trendline that we have seen at the lows this year. USD dropped from 114.78 to 99.58 from Oct 2022 into July 2023 in a move that cannot be blamed on the Trump administration.

  2. On the daily chart I have drawn the bear flag that then formed between the July 2023 low and the January 2025 high, and on the monthly chart you can again see my note from 9th March this year that the next target was likely that rising megaphone support which has been tested and slightly broken at the lows this year.

In my last post I was noting that most presidencies are just a blip on the longer term USD charts and I have mentioned many times before over the years that the news tends to take things that happen at the same time and weave them into a cause and effect narrative. That comforts listeners who like to feel that everything is explainable in simple terms but it doesn’t make it true.

I’d add that while I think the Trump administration is economically and fiscally reckless, a loss of confidence is akin to bankruptcy, which tends to build over a long period and then happen all at once. If markets had lost confidence in the Trump administration then long term treasury rates would be over 6% and equity markets would be a lot lower. That kind of loss of confidence may happen in the future, but it hasn’t happened yet.

If that does start to happen then the USD bull flag may take the lower probability option and break down towards a target in the 78-9 area, but until then this is a beautiful bullish setup and the odds favor at least a strong rally from this area.

If you like my analysis and would like to see more, please take a free subscription at my thebiggerpicture substack, where I publish these posts first and for members (from next week) also bi-weekly videos looking at equity indices, bonds, currencies and commodities. Those videos are posted on my Youtube channel after a four day delay. Links to all my posts from my charting substacks are also always posted on my twitter.

Wednesday, 24 September 2025

Possible Retracement Low on Crypto

In my post on Tuesday last week I was looking at the possibility that we might see a modest retracement (by Crypto standards) on Crypto over this week and into the end of September, during the last significantly bearish leaning period (on equities) this year.

In my premarket videos over the rest of last week I was looking at the possibility that daily RSI 5 sell signals might form on Bitcoin (BTCUSD) and Solana (SOLUSD), and that Bitcoin and Ethereum (ETHUSD) might get another leg down within larger bull flags that might be forming from their last all time highs.

We haven’t actually been seeing much bearish action on equities during this historically weak bearish window on equities, at least until the Fed comments yesterday casting doubt on further rate cuts this year, but the pullback on Crypto has been proceeding as expected.

In my post on Monday I was looking at Bitcoin’s return to backtest the strong support at the weekly middle band, currently at 111,726, and that is holding so far. This is a possible retracement low.

BTCUSD weekly chart:

On the daily chart an RSI 5 sell signal formed last week and made target at the close on Monday.

Could we still see Bitcoin go lower? Yes. I’m thinking that either this is likely either the retracement low on Bitcoin or the end of an A wave in an ABC retracement, with a rally here before another leg down.

BTCUSD daily chart:

On the hourly chart an RSI 14 buy signal has fixed and a small double bottom has formed. If this is just a rally I’d be looking for that rally to go into the 114.5k area before turning back down again. At the time of writing the daily middle band is currently at 114,143.

If there is then another leg down then the obvious target would be the open double top target in the 99k to 100k area, supported by established support at 98.3k, or one of the two trendline options that I have shown above there currently in the 106k or 103k areas.

BTCUSD 60min chart:

On the Solana daily chart an RSI 5 sell signal formed last week and also made target at the close on Monday.

At the end of my The Bigger Picture video on Sunday I was looking at the small double top setup on Solana, I showed that again my my post on Monday morning with a target in the 205-10 area, and the overnight low at the time of writing is 205.05. The big support level I mentioned was the 50dma, currently at 206.40, and is obviously being tested at the moment.

SOLUSD daily chart:

On the hourly chart an RSI 14 buy signal has also fixed, and I’m looking for a rally. If this is the bottom of an A wave and there is a C wave coming, then the rally would ideally take Solana back up into the 225-35 area, with the daily middle band currently at 227.12, before another leg down with an ideal target at the weekly middle band, currently at 180.84, supported by the 50 week MA, currently at 181.46.

SOLUSD 60min chart:

On the Ethereum hourly chart there is a third fixed RSI 14 buy signal that fixed overnight, and a possible small double bottom setup. As with the other two this could be the retracement low, but if this is is the bottom of an A wave and there is a C wave coming, then the rally would ideally take Ethereum back up into the 4400-50 area, with the daily middle band currently at 4423.53, before another leg down with an ideal target at the weekly middle band, currently at 3474.95, with the H&S target shown on Monday and the chart below in the 3500 area.

ETHUSD hourly chart:

All of these three have reached decent support and have hourly buy signals fixed. The obvious path is to rally back to their daily middle bands and then either break back over those on the way back to higher highs, or fail there into another leg down, ideally into my next target areas.

I’ve been hearing a lot this week about speculation that the bull market in Crypto has just ended. Anything is possible of course but I’m not seeing any sign that might be the case yet & there tends to be talk like this on every significant retracement. After this retracement I’m still looking higher into the possible bull market high in December 2025 that I’ve been looking for all year.

Since I started doing daily videos on Crypto early last year I’ve got Crypto direction right most of the time and more so than any other analyst anywhere that I’m aware of. I’m a very good analyst and all three of these instruments are very classical chartist friendly. I’m not much of a marketer though, and the free Crypto substack I set up last August still has less than 200 readers. I’d like to increase that readership and invite any suggestions on how I could do that.

I am thinking about setting up a second YouTube Crypto channel and recording videos giving likely market direction without requiring the viewers to have some knowledge of technical analysis to understand the videos. Comments on that and other suggestions very welcome. I’ll likely start publishing videos on that project before the end of the month.

If you’d like to see more of these posts and the other Crypto videos and information I post, please subscribe for free to my Crypto substack. I also do a premarket video every day on Crypto at 9.05am EST. If you’d like to see those I post the links every morning on my twitter, and the videos are posted shortly afterwards on my Youtube channel.

Monday, 22 September 2025

A Modest Retracement on Crypto

In my post on Tuesday last week I was looking at possibility that we might see a modest retracement on Crypto over the next few days into the end of September, during the last significantly bearish leaning period this year.

In my premarket videos over the rest of the week I was looking at the possibility that daily RSI 5 sell signals might form on Bitcoin (BTCUSD) and Solana (SOLUSD), and that Bitcoin and Ethereum (ETHUSD) might get another leg down within larger bull flags that might be forming from their last all time highs.

Looking at Bitcoin, that next leg down may now have started, and it has retraced to test the first big support level on the way at the backtest of the May (then) all time high at 112k, and the weekly middle band just below that currently at 111,738. The overnight low at the time of writing is at 112,121.

For Bitcoin to break lower this is the key level that needs to be broken and converted to resistance so I am watching this level carefully.

BTCUSD weekly chart:

In terms of that daily RSI 5 sell signal it did form as I hoped and broke down on Friday, but won’t be much further assistance as it is already reaching the target at the 30 level on the daily RSI 5.

Bitcoin has broken back below the 50dma, currently at 114,030, and the daily middle band, currently at 114,028. If the daily middle band can also be converted to resistance then that opens the downside.

BTCUSD daily chart:

In terms of the hourly chart the only topping pattern was very small and has already reached target, but there is still an open target from a double top that broke down in August in the 99k to 100k area, and established strong support at the June low in the 98.3k area. If we see more weakness then that area just under 100k would be the obvious target area.

If a bull flag is forming I have drawn in the two most likely support trendlines, currently in the 103k and 106k areas.

BTCUSD 60min chart:

On Solana that daily RSI 5 sell signal also formed as I hoped and broke down over the weekend, but also won’t be much further assistance as it is already reaching the target at the 30 level on the daily RSI 5.

At the end of my The Bigger Picture video yesterday I was looking at the small double top setup on Solana and that broke down overnight with a target in the 205-10 area. Overnight Solana has broken below the daily middle band, currently at 226.58, and I’m liking the odds of that making target, particularly with the attractive support level at the 50dma currently at 204.60.

SOLUSD daily chart:

Ethereum still has a fixed daily RSI 14 sell signal that fixed in August and I am thinking that may well reach target in this retracement. Ethereum broke the daily middle band hard overnight and is testing the first important support area at the mid-August low at 4063.26.

ETHUSD daily chart:

A small upsloping H&S on Ethereum broke down overnight with a target in the 3500 area and, on a move below 3500 I have possible alternate double top targets in the 3150-3330 range.

I have drawn in possible larger bull flag support trendlines currently in the 3770 and 3430 areas and there is also a rising support trendline currently in the 2950 area that could be a target.

ETHEUSD 60min chart:

These levels hit overnight may be support, the daily RSI 5 sell signals on Bitcoin and Solana are already in their target areas, and it may be that support here will hold. If these do break lower I’m looking for a fairly modest retracement (in Crypto terms) over the next few days setting up the next legs up on all three of these.

On a break lower we could see daily buy signals set up on any or all three of these and if so I’ll be calling those as they form.

Since I started doing daily videos on Crypto early last year I’ve got Crypto direction right most of the time and more so than any other analyst anywhere that I’m aware of. I’m a very good analyst and all three of these instruments are very classical chartist friendly. I’m not much of a marketer though, and the free Crypto substack I set up last August still has less than 200 readers. I’d like to increase that readership and invite any suggestions on how I could do that.

I am thinking about setting up a second YouTube Crypto channel and recording videos giving likely market direction without requiring the viewers to have some knowledge of technical analysis to understand the videos. Comments on that and other suggestions very welcome. I’ll likely start publishing videos on that project before the end of the month.

If you’d like to see more of these posts and the other Crypto videos and information I post, please subscribe for free to my Crypto substack. I also do a premarket video every day on Crypto at 9.05am EST. If you’d like to see those I post the links every morning on my twitter, and the videos are posted shortly afterwards on my Youtube channel.

Friday, 19 September 2025

Decent Setup For Modest Retracement

In my post on the morning of September 3rd, just after the sharp decline on the first trading day of this month, I was noting buy signals on all six of the hourly equity index futures charts that I follow, and those all delivered over the remainder of that week. When four or more of these fix at once on the hourly futures they generally deliver.

In my the Bigger Picture video on Sunday 7th September I was noting the strongly bullish leaning historical stats for the coming week and was suggesting a target for QQQ at a retest of the August all time high at 583.32, and we saw that with a new all time high at 587.86, seeing also new all time highs on SPX and DIA, and IWM moving closer to the IHS target at a retest of the Nov 2024 all time high at 243.04.

In my last post on Monday September 15th I was looking at the historical stats suggesting that after Tuesday this week there was a short bearish window into the end of September.

In my premarket video on Wednesday I was looking at the short term bull flags on RTY and YM and looking for retests of the September highs on IWM and DIA.

It’s been an interesting week and in addition to the expected 0.25% reduction in the Fed Funds rate the Fed also gave guidance that there would likely be two more reductions in the remaining three months of the year.

Now reductions in the Fed Funds rate do not necessarily result in any meaningful reduction is borrowing costs in either the private or public sectors, and I’ll be looking at that in detail in a post over the next few days, but all this was received very positively by the markets and there were new all time highs across the board afterwards on SPX, QQQ, IWM and DIA.

As I mentioned in my last post, over the rest of September, there are clearly bearish leaning days today on Friday 19th, then Monday 22nd, Tuesday 23rd, Thursday 25th, with a single bullish leaning day on Friday 26th before a last clearly bearish leaning day on Tuesday 30th September, also the last trading day of September. This is the last strong series of bearish leaning days this year.

I’ve been watching the pattern setups here to consider the odds of seeing some retracement here, and that setup isn’t bad, though it lacks the clear directionality of the bullish setup I was looking at on equity indices at the start of September.

In terms of daily sell signals, there are possible weak RSI 14 sell signals brewing on SPX and QQQ. That’s a bit thin, but there are much better signals on two markets I’d be looking to retrace or consolidate with equities here, with fixed daily sell signals looking down on bonds, and possible high quality daily sell signals brewing on Bitcoin and Solana.

In terms of the hourly futures charts there are weak sell signals fixed or brewing on NQ, DAX and ESTX50, and a full 60min sell signal fixed on YM, which is encouraging for at least some downside.

In terms of the patterns setups the current move started at the start of August and SPX is at the top of a high quality rising channel from there, as well as a rising wedge from the September low.

SPX 15min chart:

DIA is at the top of a high quality rising wedge from the start of August.

DIA 15min chart:

IWM is slightly overthrowing a high quality rising wedge from the August low.

IWM 15min chart:

QQQ is a somewhat different story as QQQ spent August trading sideways rather than up but there is a high quality rising wedge from the September low which looks promising.

QQQ 15min chart:

This would also be an obvious place for IWM to retrace on the bigger picture, as it has now reached the IHS target on the IHS, that I first laid out as a possible scenario in my post on 3rd June, at a retest of the all time high made in Nov 2024.

IWM daily chart:

Are there high quality topping setups here in the short term? No, though there is some promising looking possible topping action and a lot of decent quality short term resistance trendlines have been established.

Is there anything so far suggesting a significant high being made here? No, though that could change. If so we might still see a decent retracement in October, which is a strong month for those historically. I’ll keep an open mind and call out any decent patterns that form.

Overall I am liking bearish leaning tape into the end of the month and a possible retracement of some of the decent gains made in September. We’ll see.

On the bigger picture since late 2024 I have been leaning towards seeing a possible much more serious high on equities made at the end of 2025 and I didn’t see anything to change that view this week.

If you like my analysis and would like to see more, please take a free subscription at my chartingthemarkets substack, where I publish these posts first. I also do a premarket video every day on equity indices, bonds, currencies, energies, precious commodities and other commodities at 8.45am EST, but only for paying subscribers. Other places to find me are my twitter, and my Youtube channel.

Tuesday, 16 September 2025

Solana Now Halfway To IHS Target

Back in my post on 11th April I called the likely start of a strong rally which we then saw.

Back in my post on 12th May I called for new all time highs on Bitcoin (BTCUSD) and laid out possible IHS scenarios on both Solana (SOLUSD) and Ethereum (ETHUSD), looking for ideal right shoulder lows on Solana in the 125.43 area and on Ethereum in the 2074.27 area. That hasn’t gone quite as I drew then but essentially Solana is still running that scenario, and Ethereum has already reached the IHS target.

Back in my post on 23rd June I called the likely lows on those right shoulders made on Solana at 126.09 and on Ethereum at 2113.65, and was looking for that IHS scenario on both to start to play out.

Back in my post on 18th July I was looking at the IHS that had since broken up on Ethereum and the progress made towards the IHS neckline on Solana.

In my post on 22nd July I was looking for some retracement after the IHS on Solana had broken up, and looking also at the possibility that a setup for a hard fail might form in that retracement.

In my post on 4th Aug I was looking at that retracement on Solana and looking for higher highs soon which we saw. I was expecting Ethereum to reach the IHS target at 4109.05 which we saw.

In my post on 19th August I was looking at a likely retracement starting on both equities and Crypto and we’ve seen that. There is now a clear inflection point here where Crypto could rally back into retests of the recent highs, or break down further into the next targets.

In my post on 25th August I was looking at a double top setup on Bitcoin, the weekly RSI 5 sell signal that had just fixed, and looking at the weekly middle band, currently at 110,115.55, as the key level that might prevent that double top reaching the target in the 99k to 100k area.

After that post the weekly RSI 5 sell signal reached the possible near miss target as Bitcoin closed slightly below the weekly middle band at the end of that week. That failed to follow through though afterwards and Bitcoin has continued to trade and close above it since.

In my last post on 9th September I was looking at the resistance levels that needed to be broken on Bitcoin and Solana to open the upside.

On Bitcoin the resistance levels were first at the daily middle band, currently at 112,225, and broken and converted to support last week, and second at the 50dma, currently at 114,367, broken at the weekend and currently backtesting as support.

BTCUSD daily chart:

On the hourly chart Bitcoin has broken up from a small IHS with a target in the 119.7k area and that target is now in range. We might then see a direct retest of the current all time high or, if a bull flag is forming, a lower low below 107.3k to complete and ABC bull flag before that retest.

BTCUSD 60min chart:

On the Solana daily chart I was looking at the possible resistance trendline marked in blue dotted line and saying that if Solana was to make a decent move towards the IHS target in the 282 area then that would need to be broken convincingly, and it now has been. Solana tested the 3sd upper band late last week and has since been consolidating.

SOLUSD daily chart:

On the Solana hourly chart I marked in a possible shorter term resistance trendline, currently in the 252 area, that has not yet been hit and there is no obvious topping action at the current highs. We might see some retracement soon but I’m expecting to see the IHS target at 282 reached within weeks and then likely a follow through into a full retest of the all time high at 294.95 not long after that.

SOLUSD 60min chart:

On the Ethereum daily chart we’ve been seeing some consolidation in recent weeks after the IHS target was hit and then a new all time high was made. As and when that consolidation ends I’m looking higher. As with Bitcoin there is a possibility that we may be looking at a part formed ABC bull flag here that may need a C wave down below 4212.31.

ETHUSD daily chart:

I’m keeping an open mind on short term direction here but historically the lean after today on equities is bearish into the end of September, and Crypto may well retrace somewhat with equities in that period.

I posted the following note at the end of my post on 13th Jan:

My preferred scenario here is that we see a bullish consolidation either now or soon on Crypto that takes a few months and sets up the next big leg up on Crypto into a possible bull market high in late 2025.

On this scenario we should soon start another leg up into a possible bull market high around December.

Since I started doing daily videos on Crypto early last year I’ve got Crypto direction right most of the time and more so than any other analyst anywhere that I’m aware of. I’m a very good analyst and all three of these instruments are very classical chartist friendly. I’m not much of a marketer though, and the free Crypto substack I set up last August still has less than 200 readers. I’d like to increase that readership and invite any suggestions on how I could do that.

I am thinking about setting up a second YouTube Crypto channel and recording videos giving likely market direction without requiring the viewers to have some knowledge of technical analysis to understand the videos. Comments on that and other suggestions very welcome. I’ll likely start publishing videos on that project before the end of the month.

If you’d like to see more of these posts and the other Crypto videos and information I post, please subscribe for free to my Crypto substack. I also do a premarket video every day on Crypto at 9.05am EST. If you’d like to see those I post the links every morning on my twitter, and the videos are posted shortly afterwards on my Youtube channel.