
In my post on the morning of September 3rd, just after the sharp decline on the first trading day of this month, I was noting buy signals on all six of the hourly equity index futures charts that I follow, and those all delivered over the remainder of that week. When four or more of these fix at once on the hourly futures they generally deliver.
In my the Bigger Picture video on Sunday 7th September I was noting the strongly bullish leaning historical stats for the coming week and was suggesting a target for QQQ at a retest of the August all time high at 583.32, and we saw that with a new all time high at 587.86, seeing also new all time highs on SPX and DIA, and IWM moving closer to the IHS target at a retest of the Nov 2024 all time high at 243.04.
In my last post on Monday September 15th I was looking at the historical stats suggesting that after Tuesday this week there was a short bearish window into the end of September.
In my premarket video on Wednesday I was looking at the short term bull flags on RTY and YM and looking for retests of the September highs on IWM and DIA.
It’s been an interesting week and in addition to the expected 0.25% reduction in the Fed Funds rate the Fed also gave guidance that there would likely be two more reductions in the remaining three months of the year.
Now reductions in the Fed Funds rate do not necessarily result in any meaningful reduction is borrowing costs in either the private or public sectors, and I’ll be looking at that in detail in a post over the next few days, but all this was received very positively by the markets and there were new all time highs across the board afterwards on SPX, QQQ, IWM and DIA.
As I mentioned in my last post, over the rest of September, there are clearly bearish leaning days today on Friday 19th, then Monday 22nd, Tuesday 23rd, Thursday 25th, with a single bullish leaning day on Friday 26th before a last clearly bearish leaning day on Tuesday 30th September, also the last trading day of September. This is the last strong series of bearish leaning days this year.
I’ve been watching the pattern setups here to consider the odds of seeing some retracement here, and that setup isn’t bad, though it lacks the clear directionality of the bullish setup I was looking at on equity indices at the start of September.
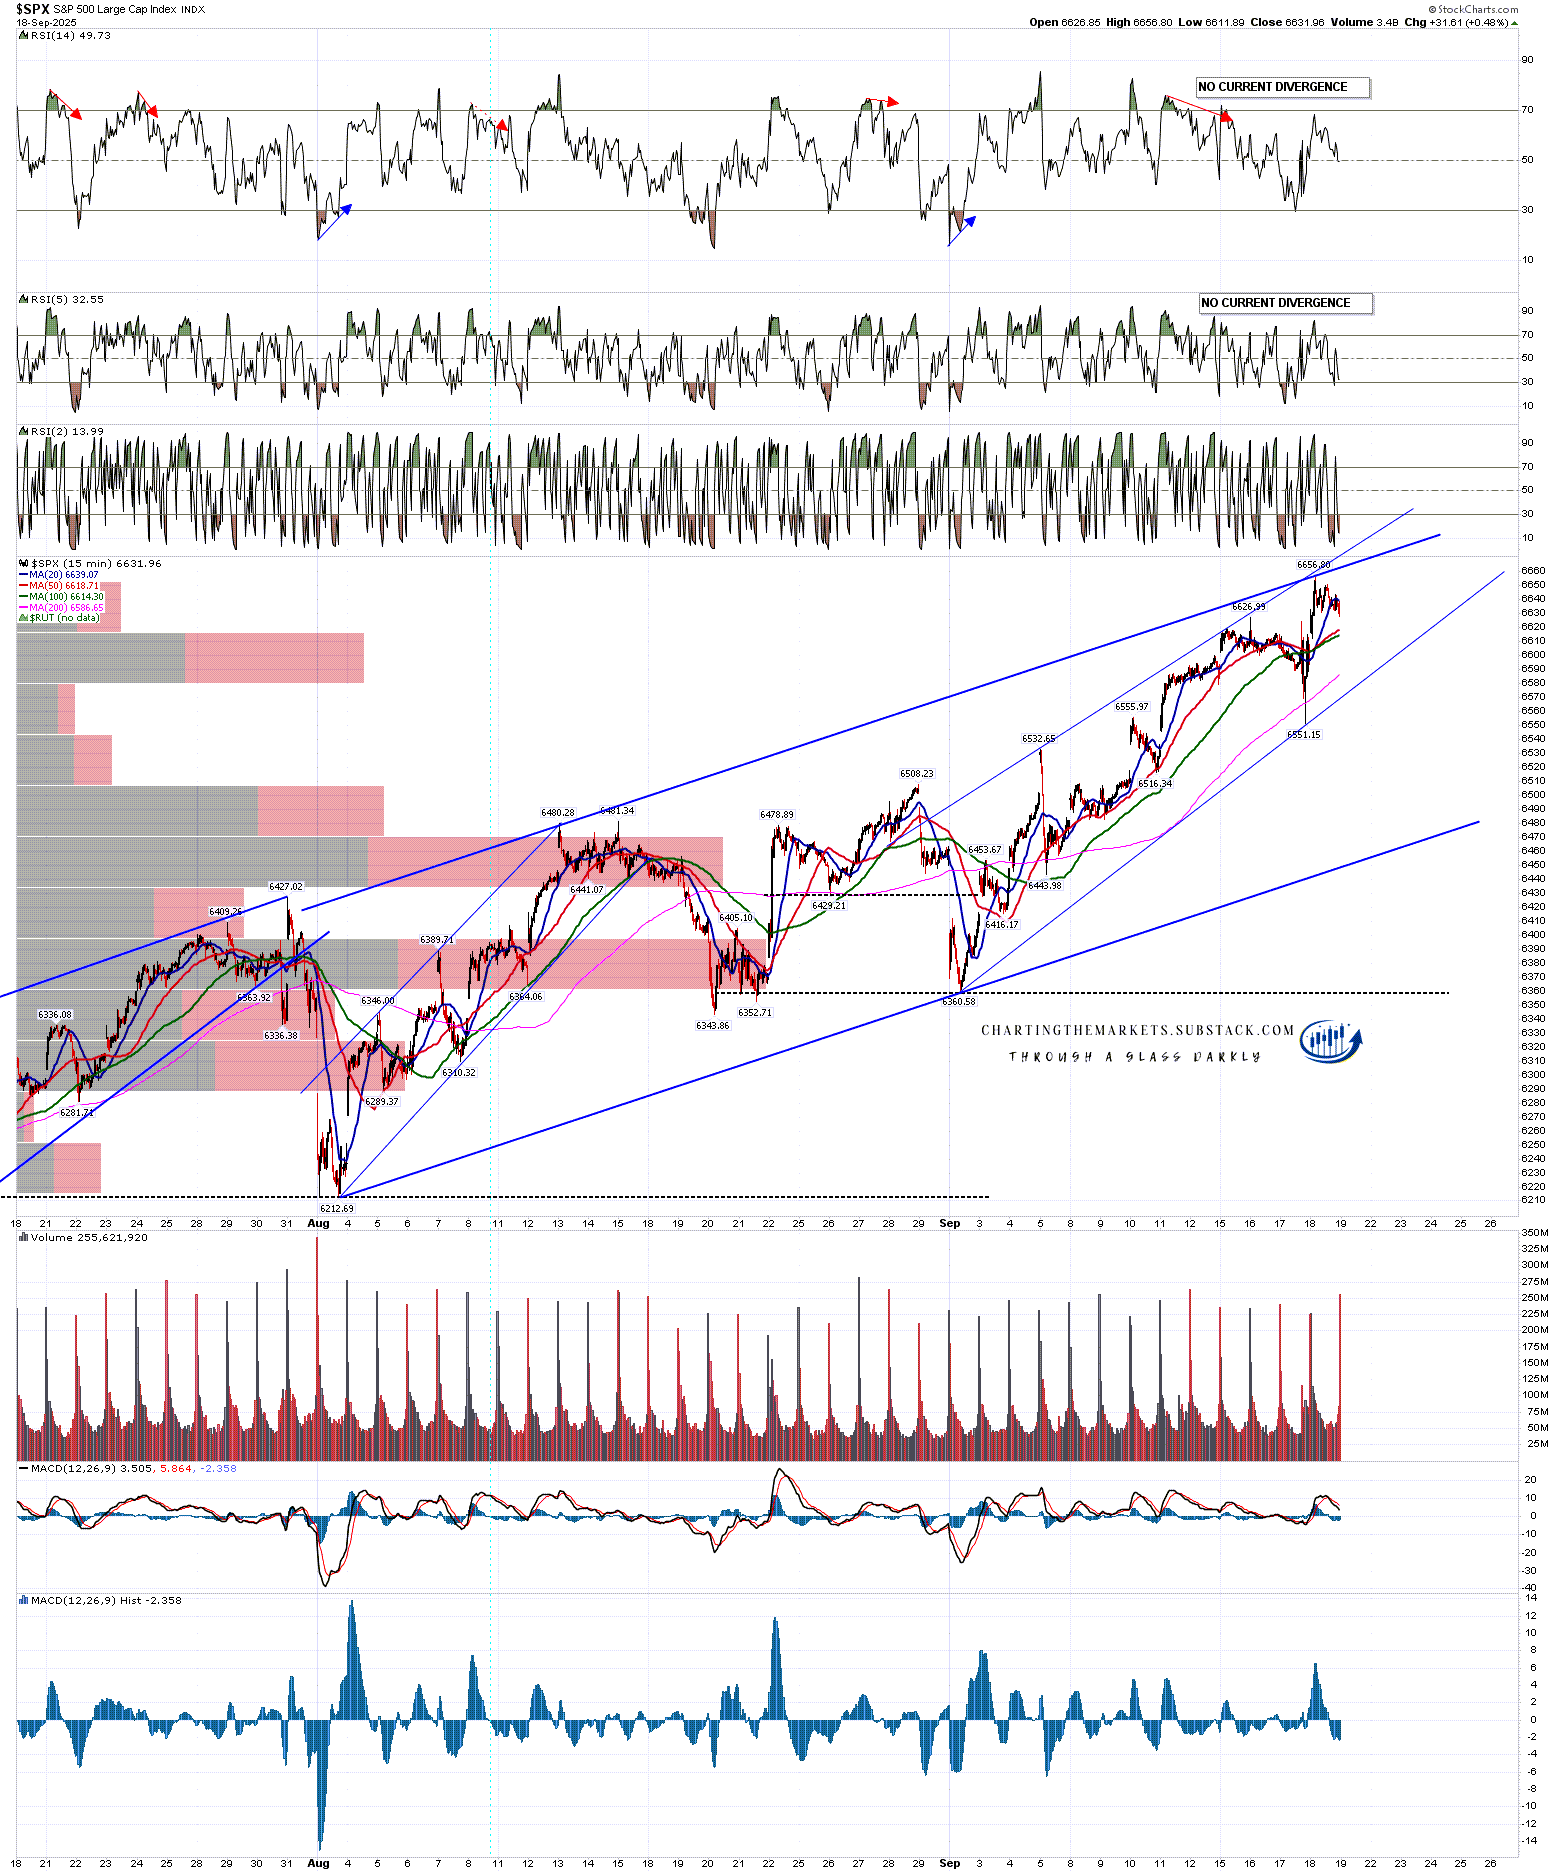
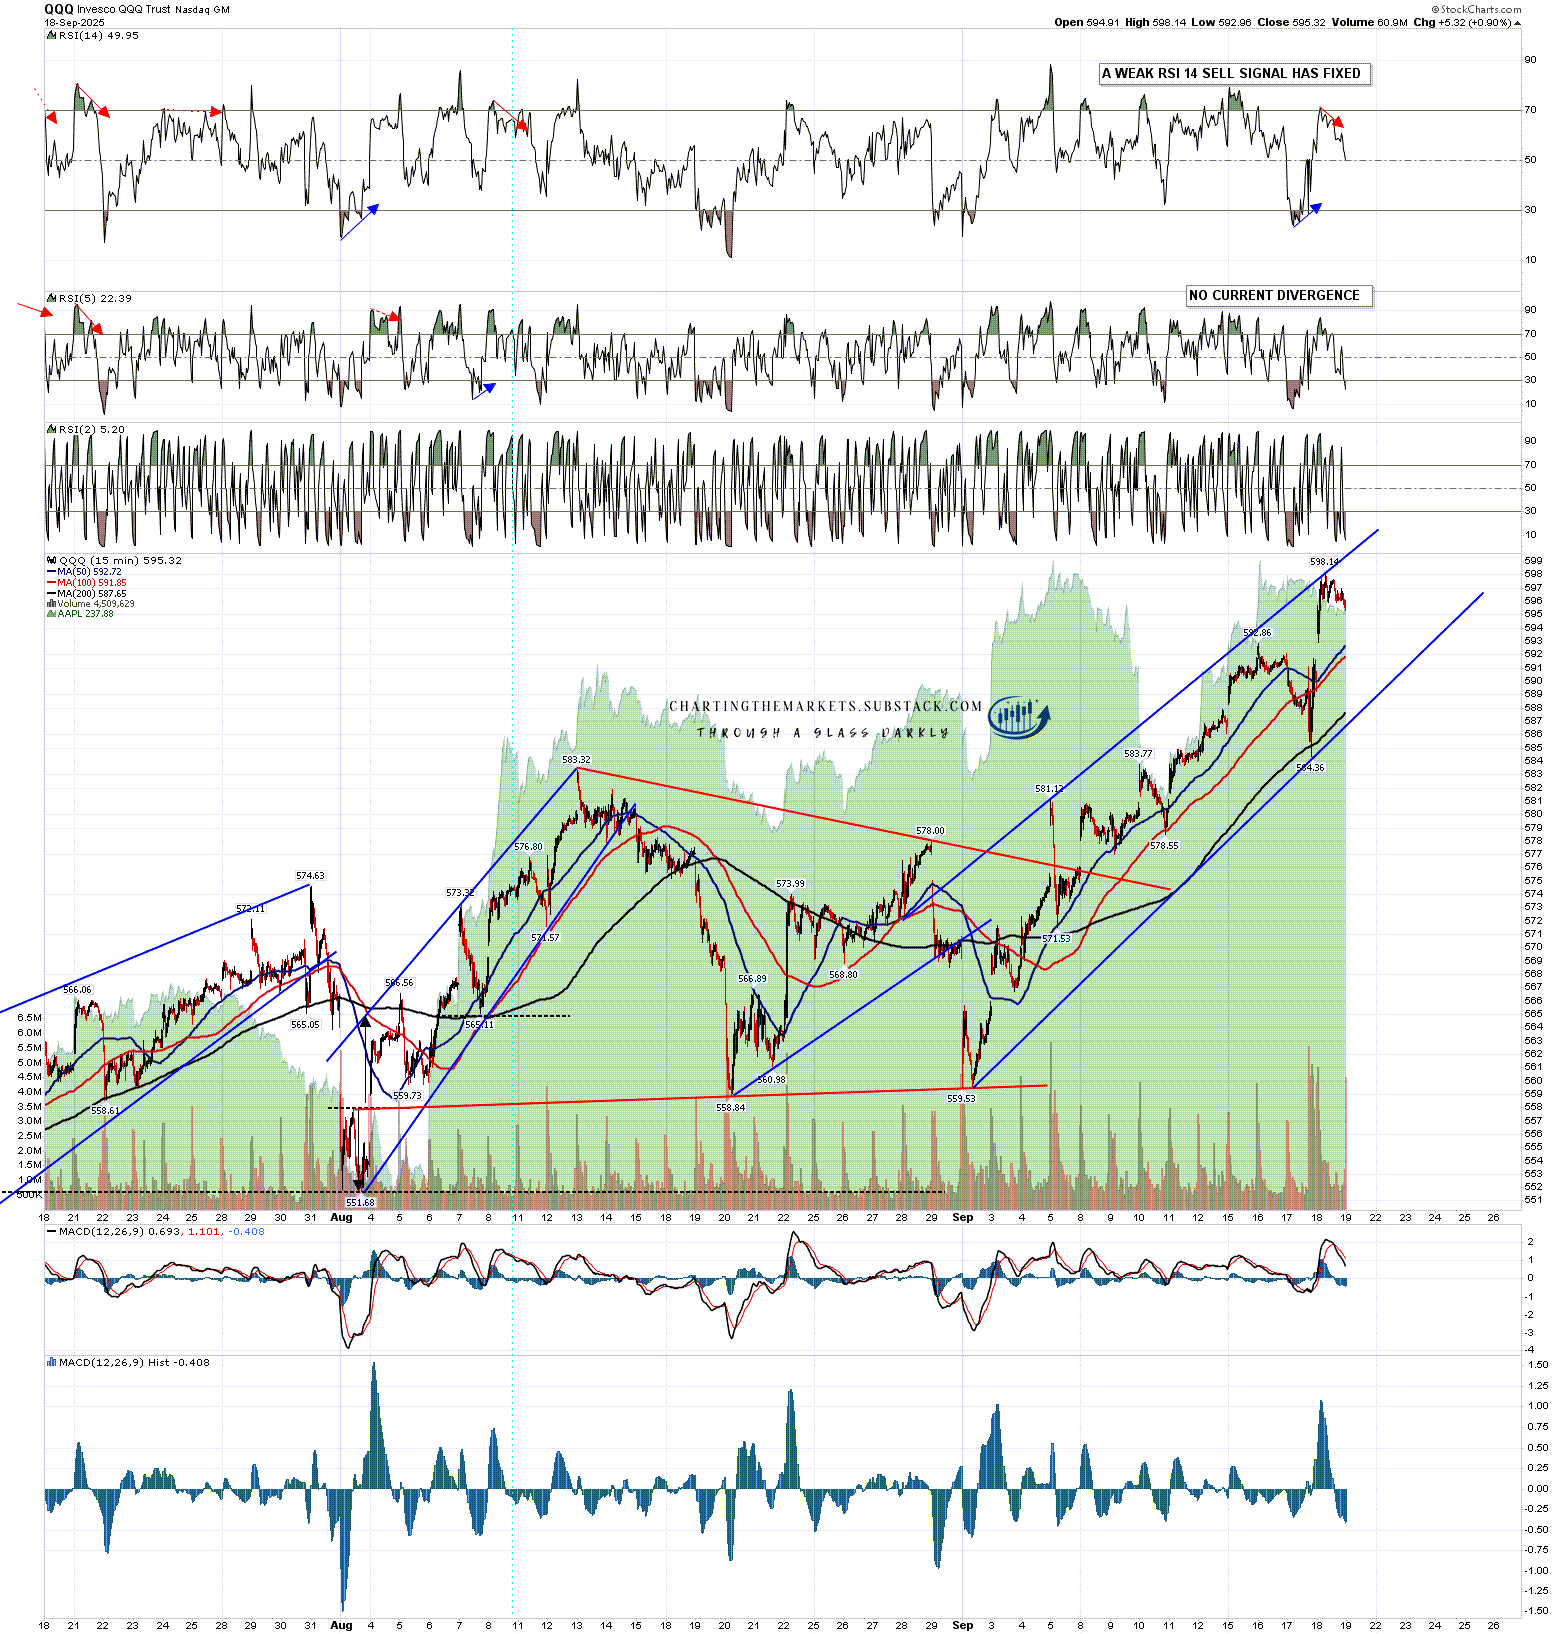
In terms of daily sell signals, there are possible weak RSI 14 sell signals brewing on SPX and QQQ. That’s a bit thin, but there are much better signals on two markets I’d be looking to retrace or consolidate with equities here, with fixed daily sell signals looking down on bonds, and possible high quality daily sell signals brewing on Bitcoin and Solana.
In terms of the hourly futures charts there are weak sell signals fixed or brewing on NQ, DAX and ESTX50, and a full 60min sell signal fixed on YM, which is encouraging for at least some downside.
In terms of the patterns setups the current move started at the start of August and SPX is at the top of a high quality rising channel from there, as well as a rising wedge from the September low.
SPX 15min chart:
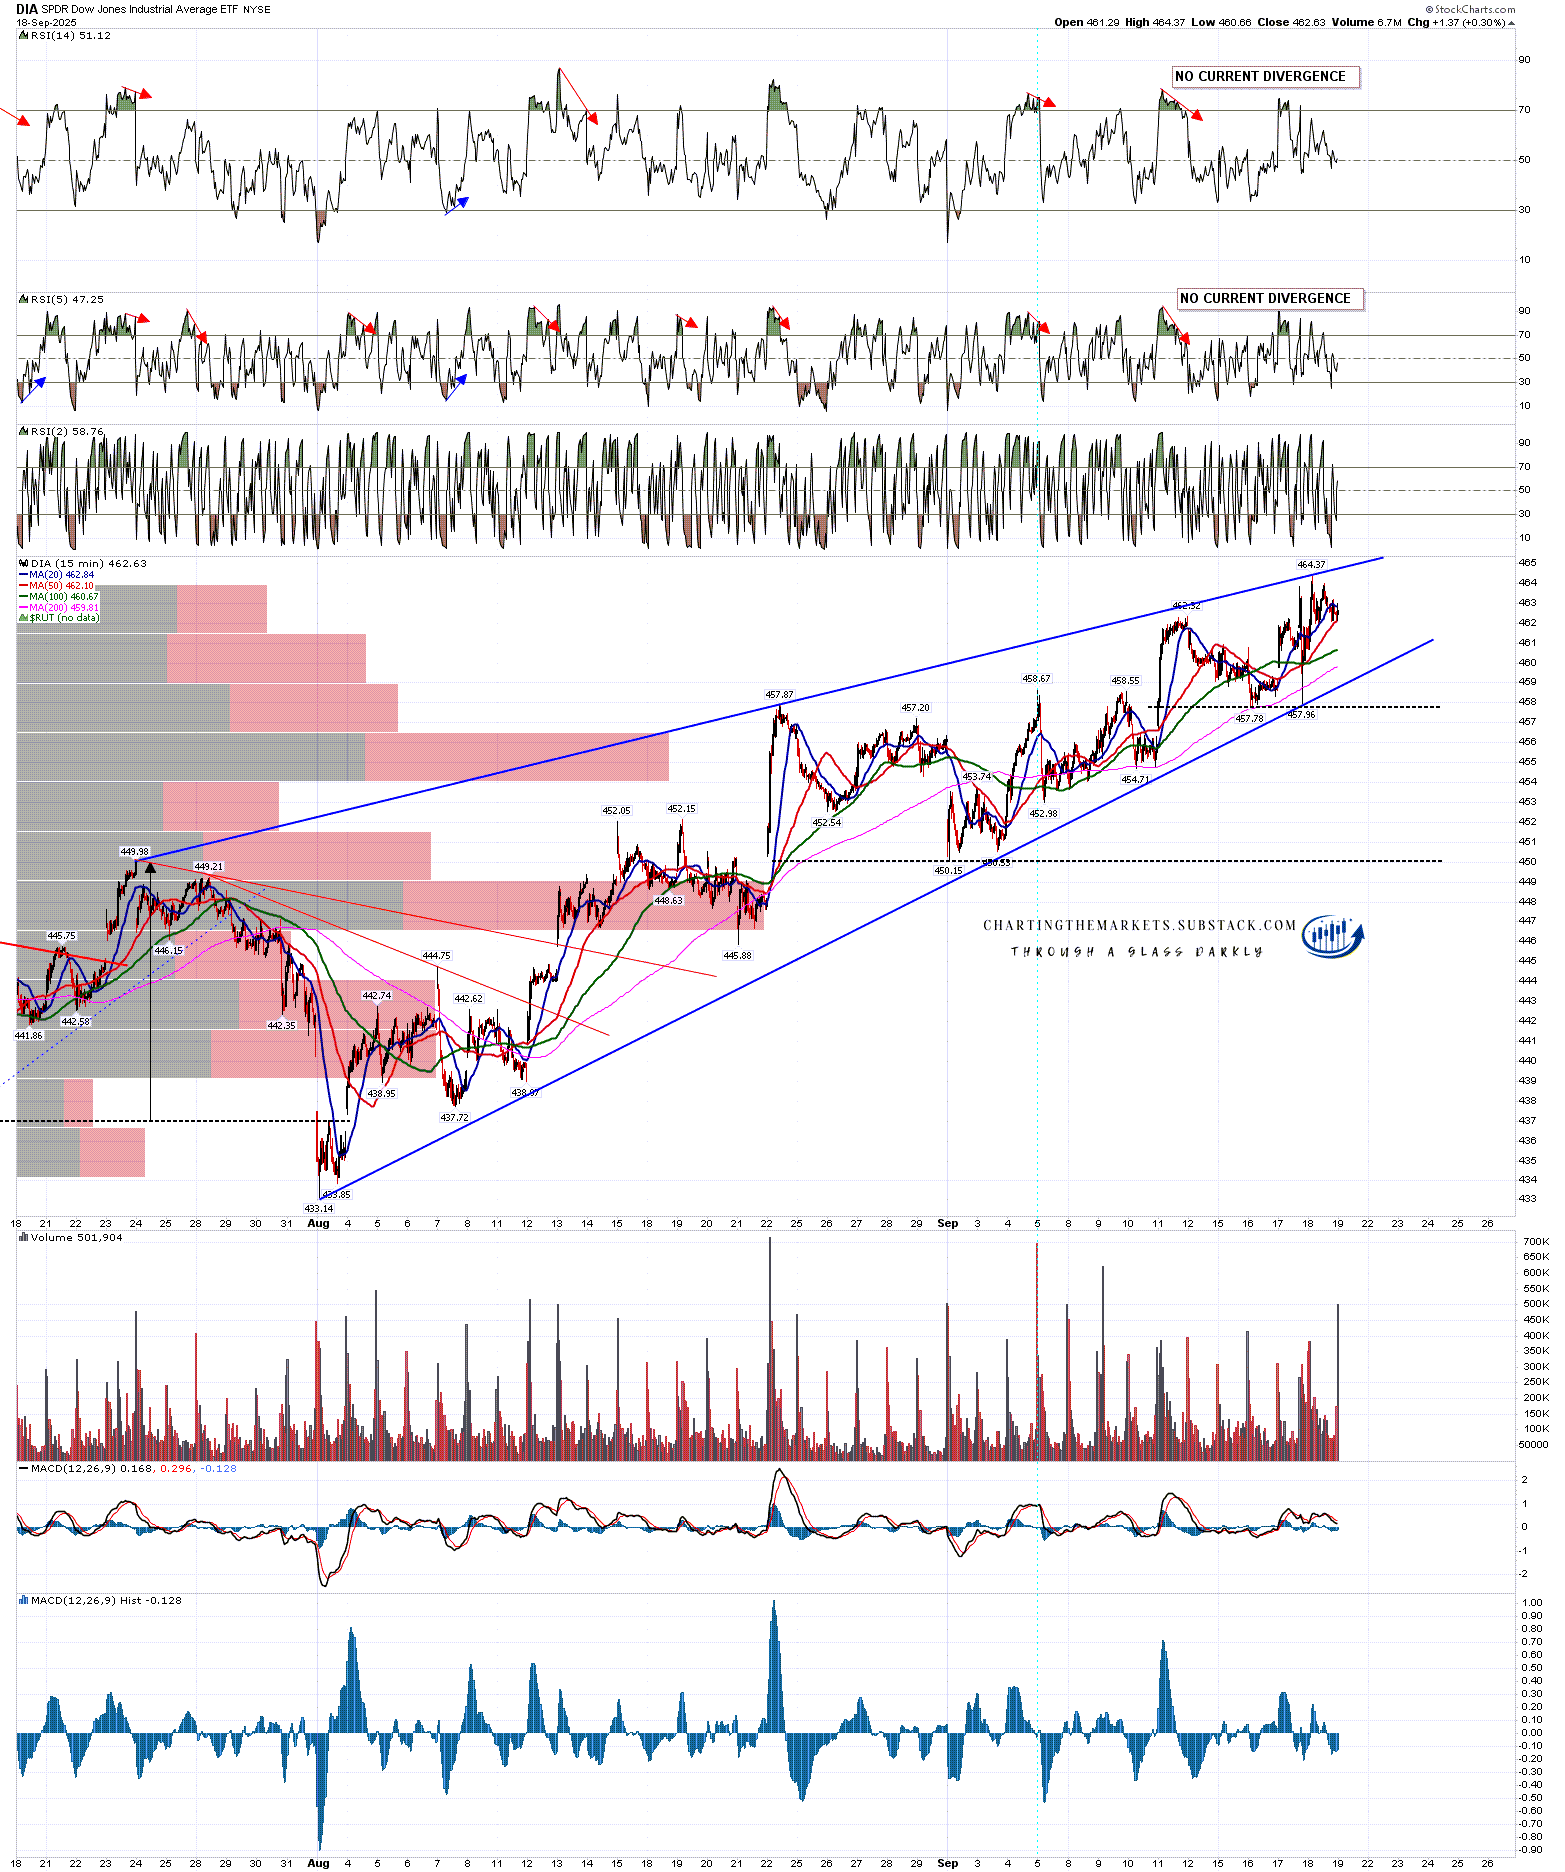
DIA is at the top of a high quality rising wedge from the start of August.
DIA 15min chart:
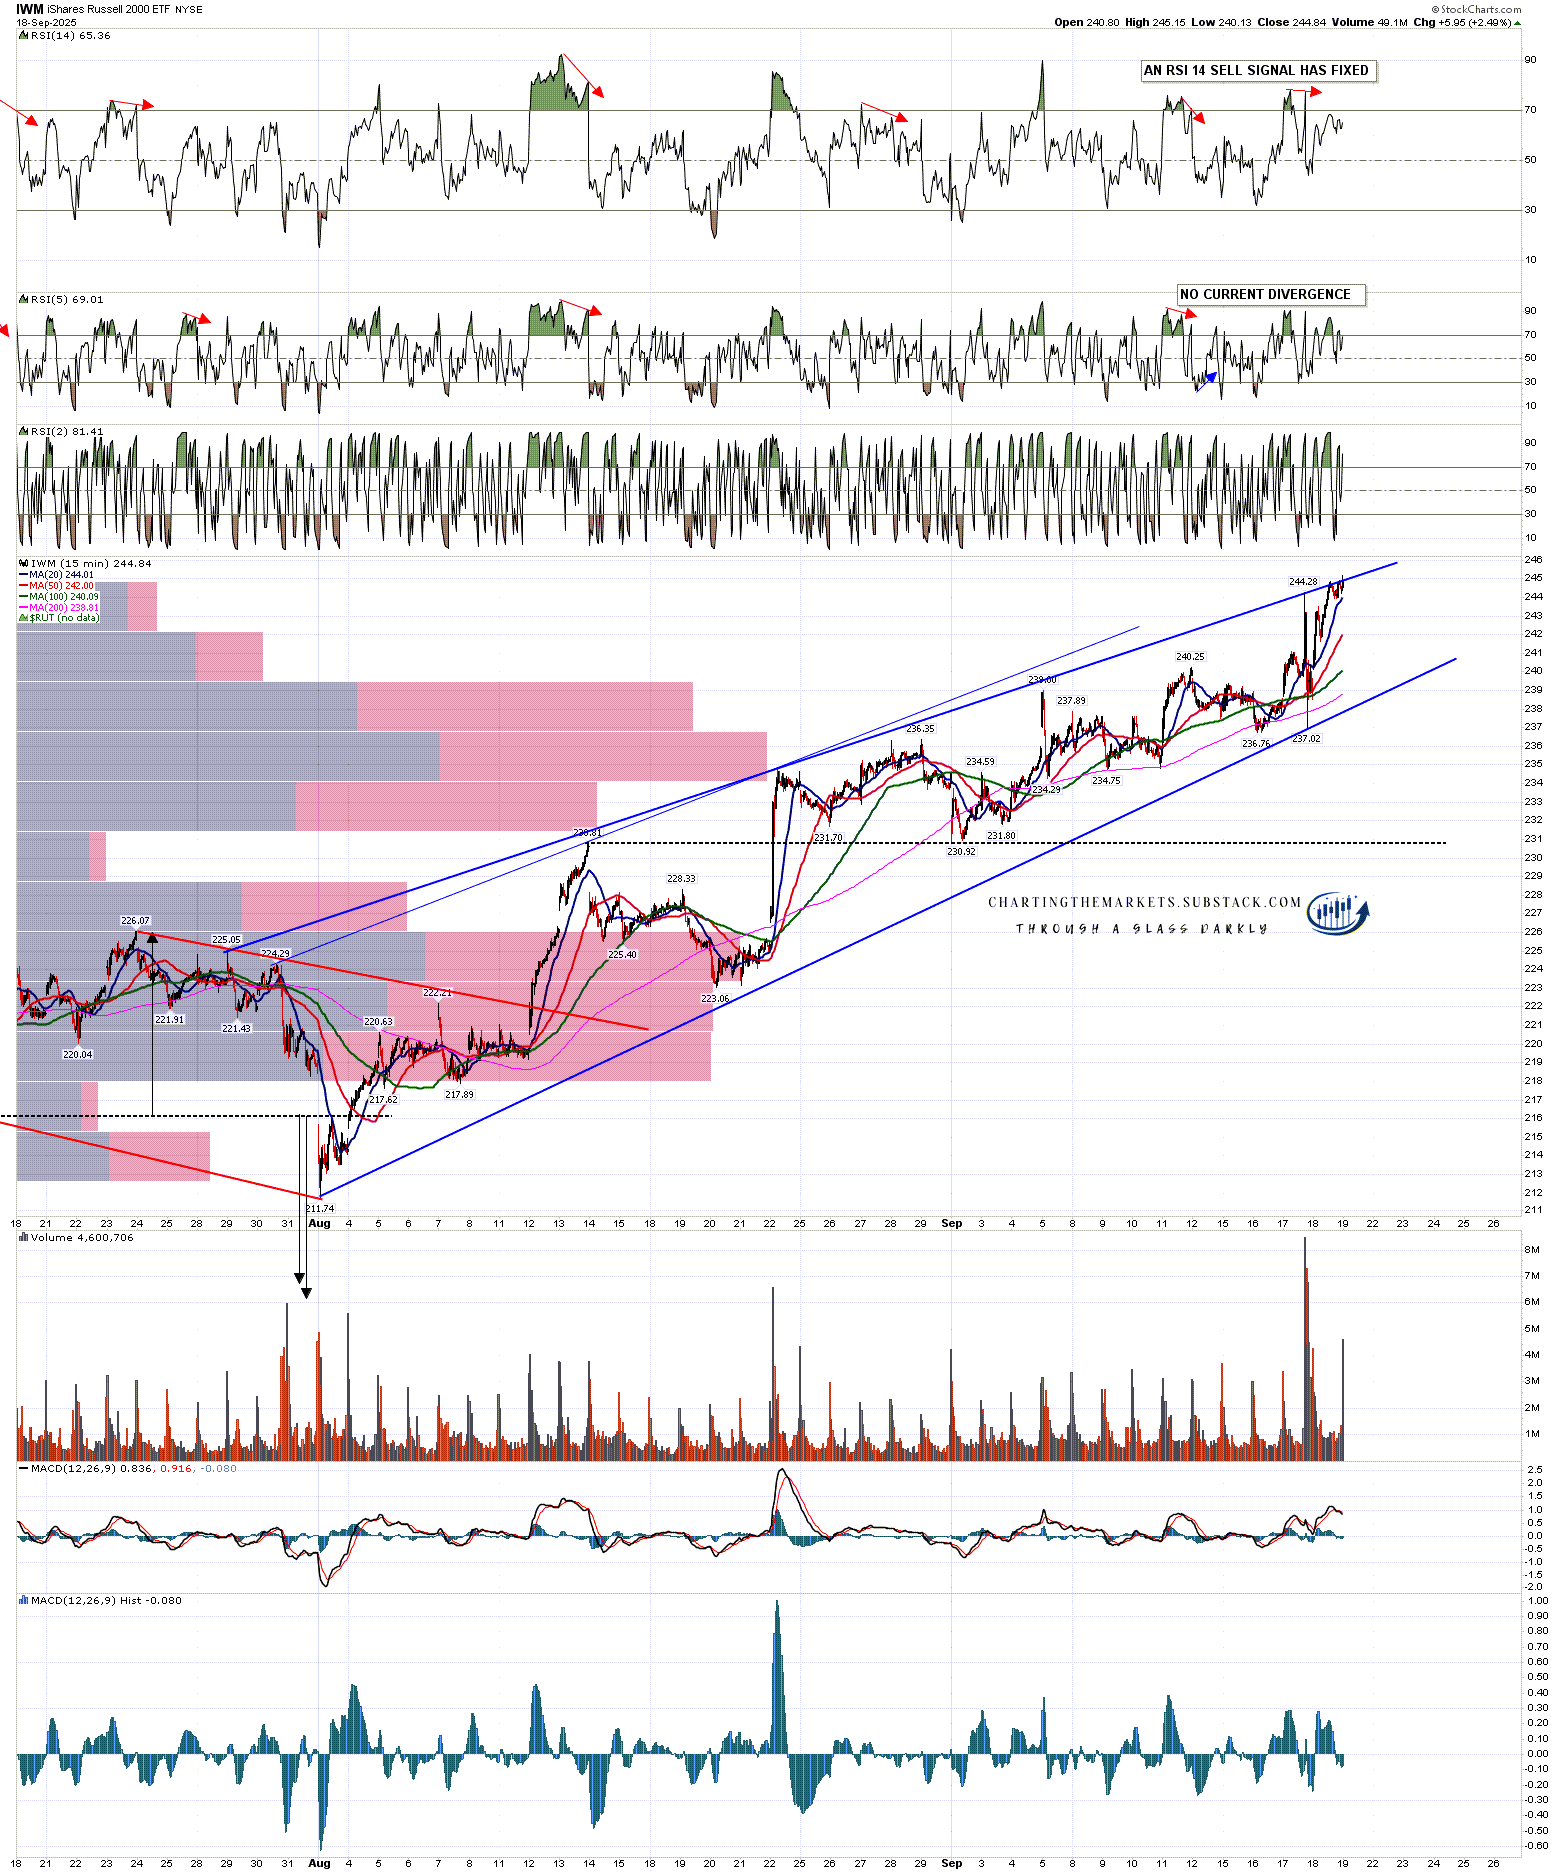
IWM is slightly overthrowing a high quality rising wedge from the August low.
IWM 15min chart:
QQQ is a somewhat different story as QQQ spent August trading sideways rather than up but there is a high quality rising wedge from the September low which looks promising.
QQQ 15min chart:
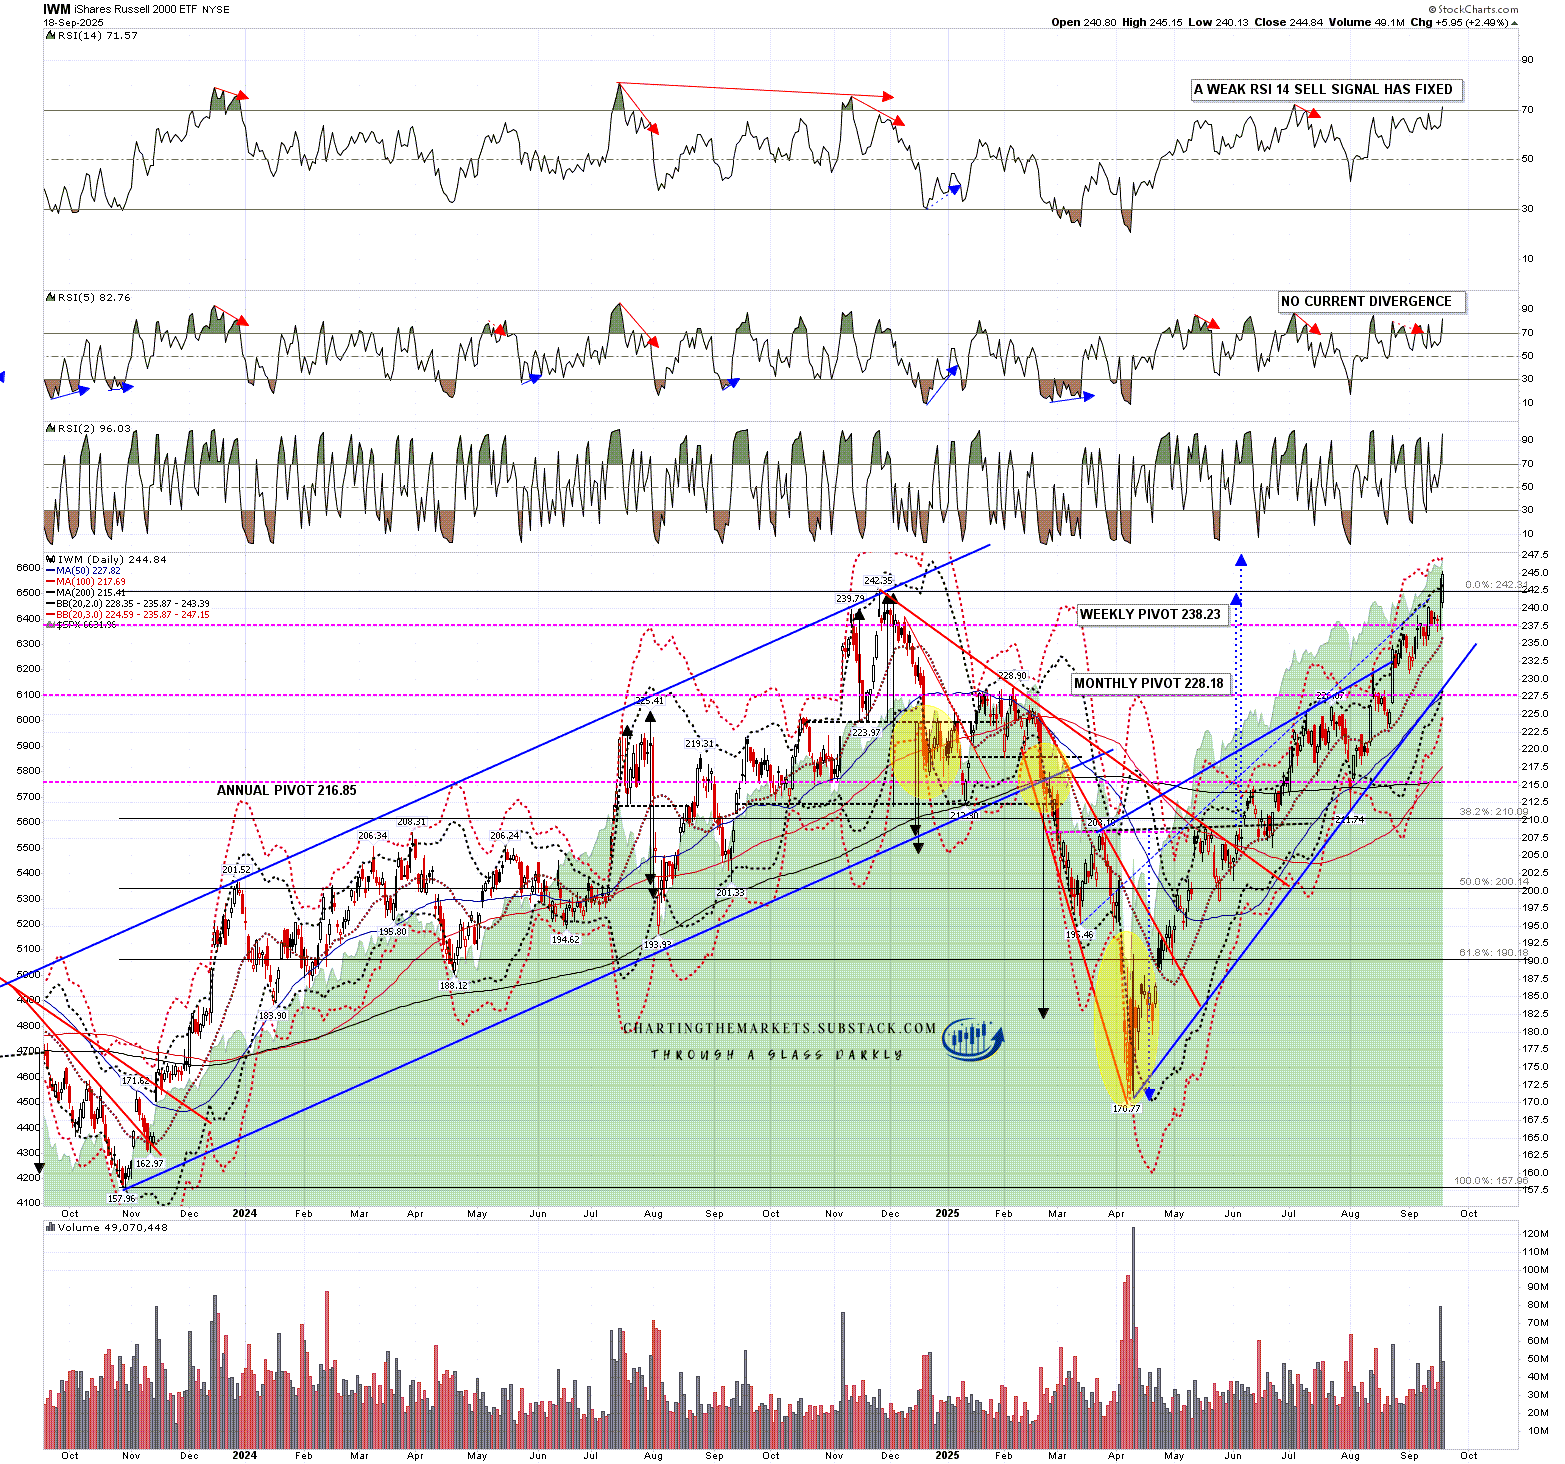
This would also be an obvious place for IWM to retrace on the bigger picture, as it has now reached the IHS target on the IHS, that I first laid out as a possible scenario in my post on 3rd June, at a retest of the all time high made in Nov 2024.
IWM daily chart:
Are there high quality topping setups here in the short term? No, though there is some promising looking possible topping action and a lot of decent quality short term resistance trendlines have been established.
Is there anything so far suggesting a significant high being made here? No, though that could change. If so we might still see a decent retracement in October, which is a strong month for those historically. I’ll keep an open mind and call out any decent patterns that form.
Overall I am liking bearish leaning tape into the end of the month and a possible retracement of some of the decent gains made in September. We’ll see.
On the bigger picture since late 2024 I have been leaning towards seeing a possible much more serious high on equities made at the end of 2025 and I didn’t see anything to change that view this week.
If you like my analysis and would like to see more, please take a free subscription at my chartingthemarkets substack, where I publish these posts first. I also do a premarket video every day on equity indices, bonds, currencies, energies, precious commodities and other commodities at 8.45am EST, but only for paying subscribers. Other places to find me are my twitter, and my Youtube channel.
No comments:
Post a Comment