
In my last post on the US Dollar on 26th June I was looking at the very big inflection point forming here on USD that will likely ultimately resolve into a rally back into a retest of the 2022 high at 114.78, or a break down towards the 78-9 area.
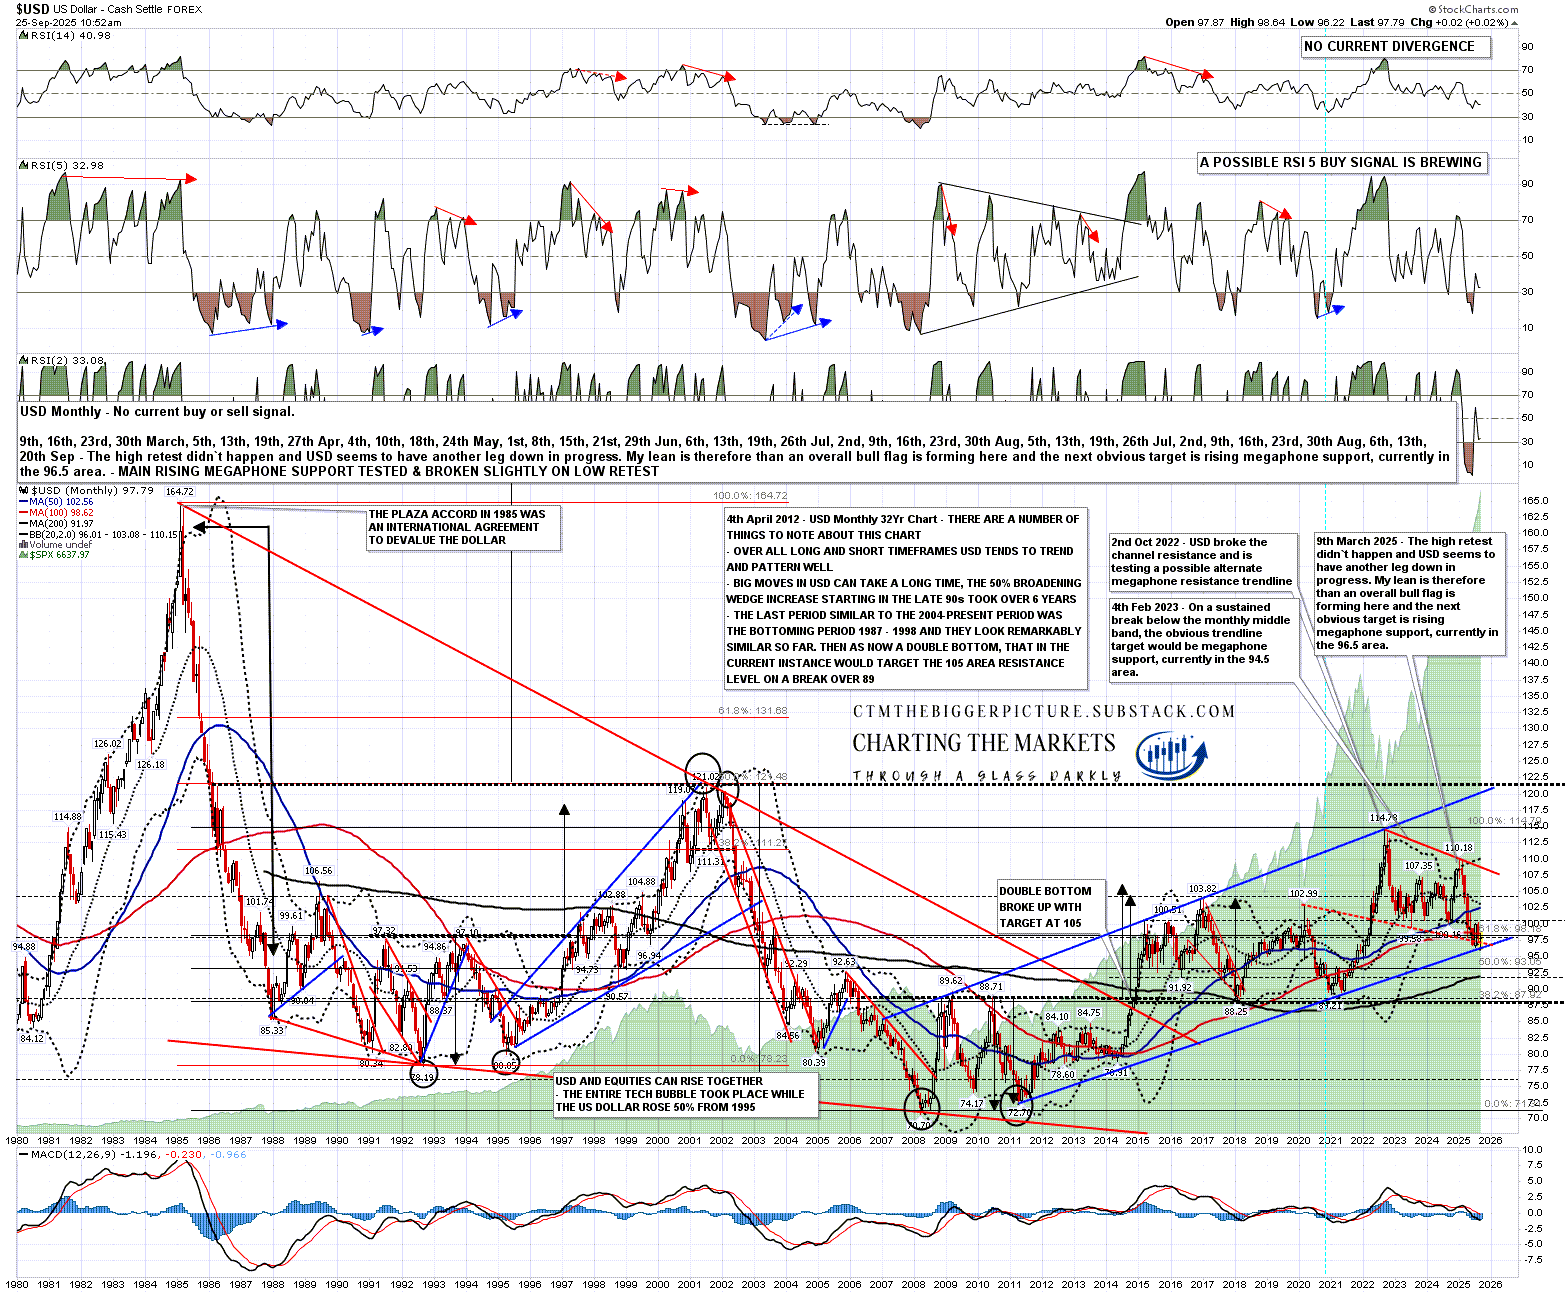
Since my last post, on the monthly chart below, USD delivered a small move down to test the rising megaphone support from the 2011 low, rallied and then retested the low, slightly breaking that rising megaphone support.
What would that generally mean? Well the slight break of the rising megaphone support means that my working assumption is now that USD is in an topping process for the move up from the 2011 low, so I am looking for a topping pattern to form, and the retested low has set up a shorter term double bottom that may now deliver a strong rally.
On the bigger picture there is a strong bull flag setup that I was looking at in my last post, and there is now also a possible monthly RSI 5 buy signal brewing, which is something I very much like to see at a possible major reversal back up. The obvious next move would be to return to bull flag resistance and then break up towards a retest of the 2022 high at 114.78, likely to make the second high of a large double top there setting up a topping pattern that might then deliver a return to the 78-9 area, last seen in the 2011-4 period.
USD monthly chart:
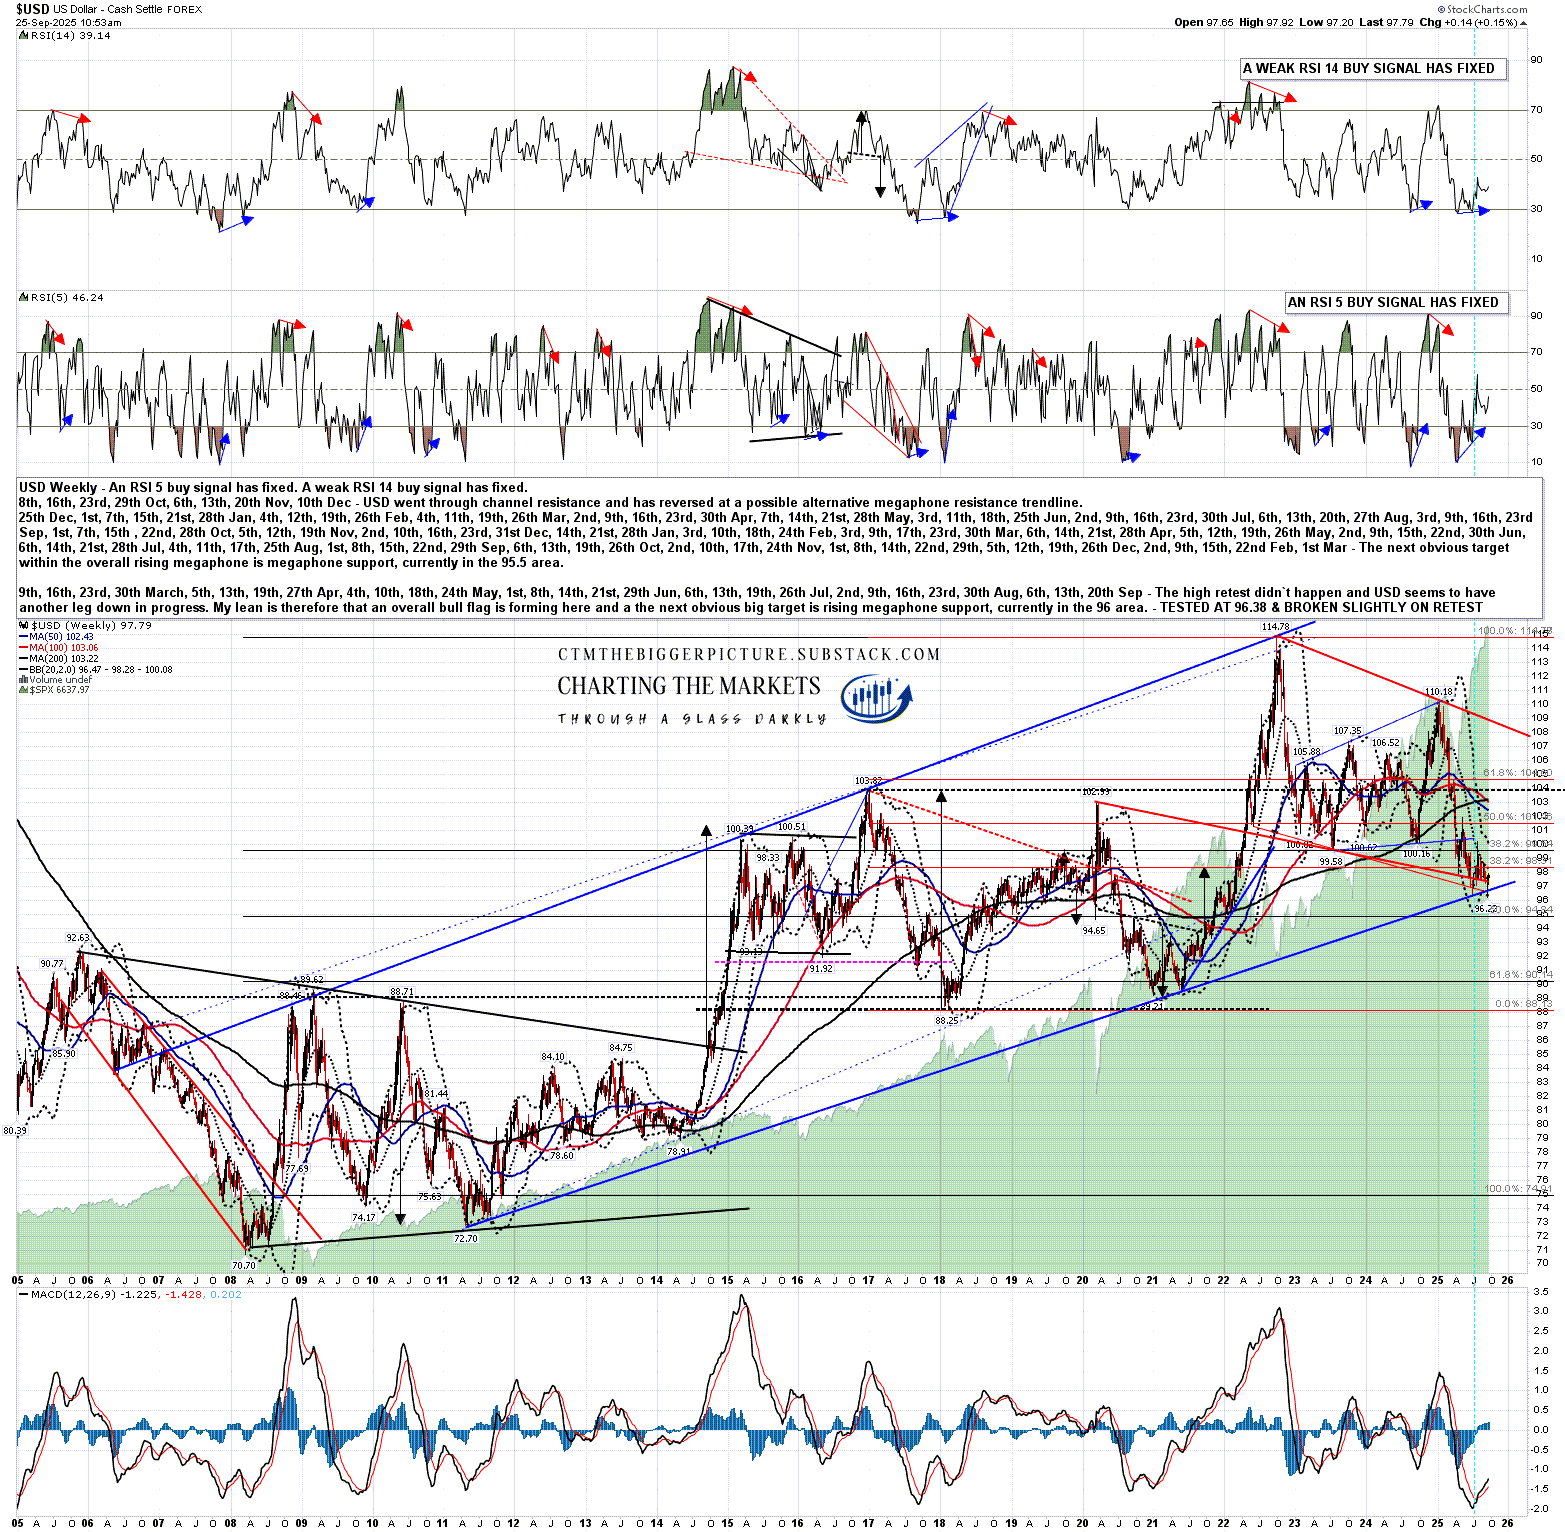
On the weekly chart a weak RSI 14 buy signal and a full RSI 5 buy signal have already fixed:
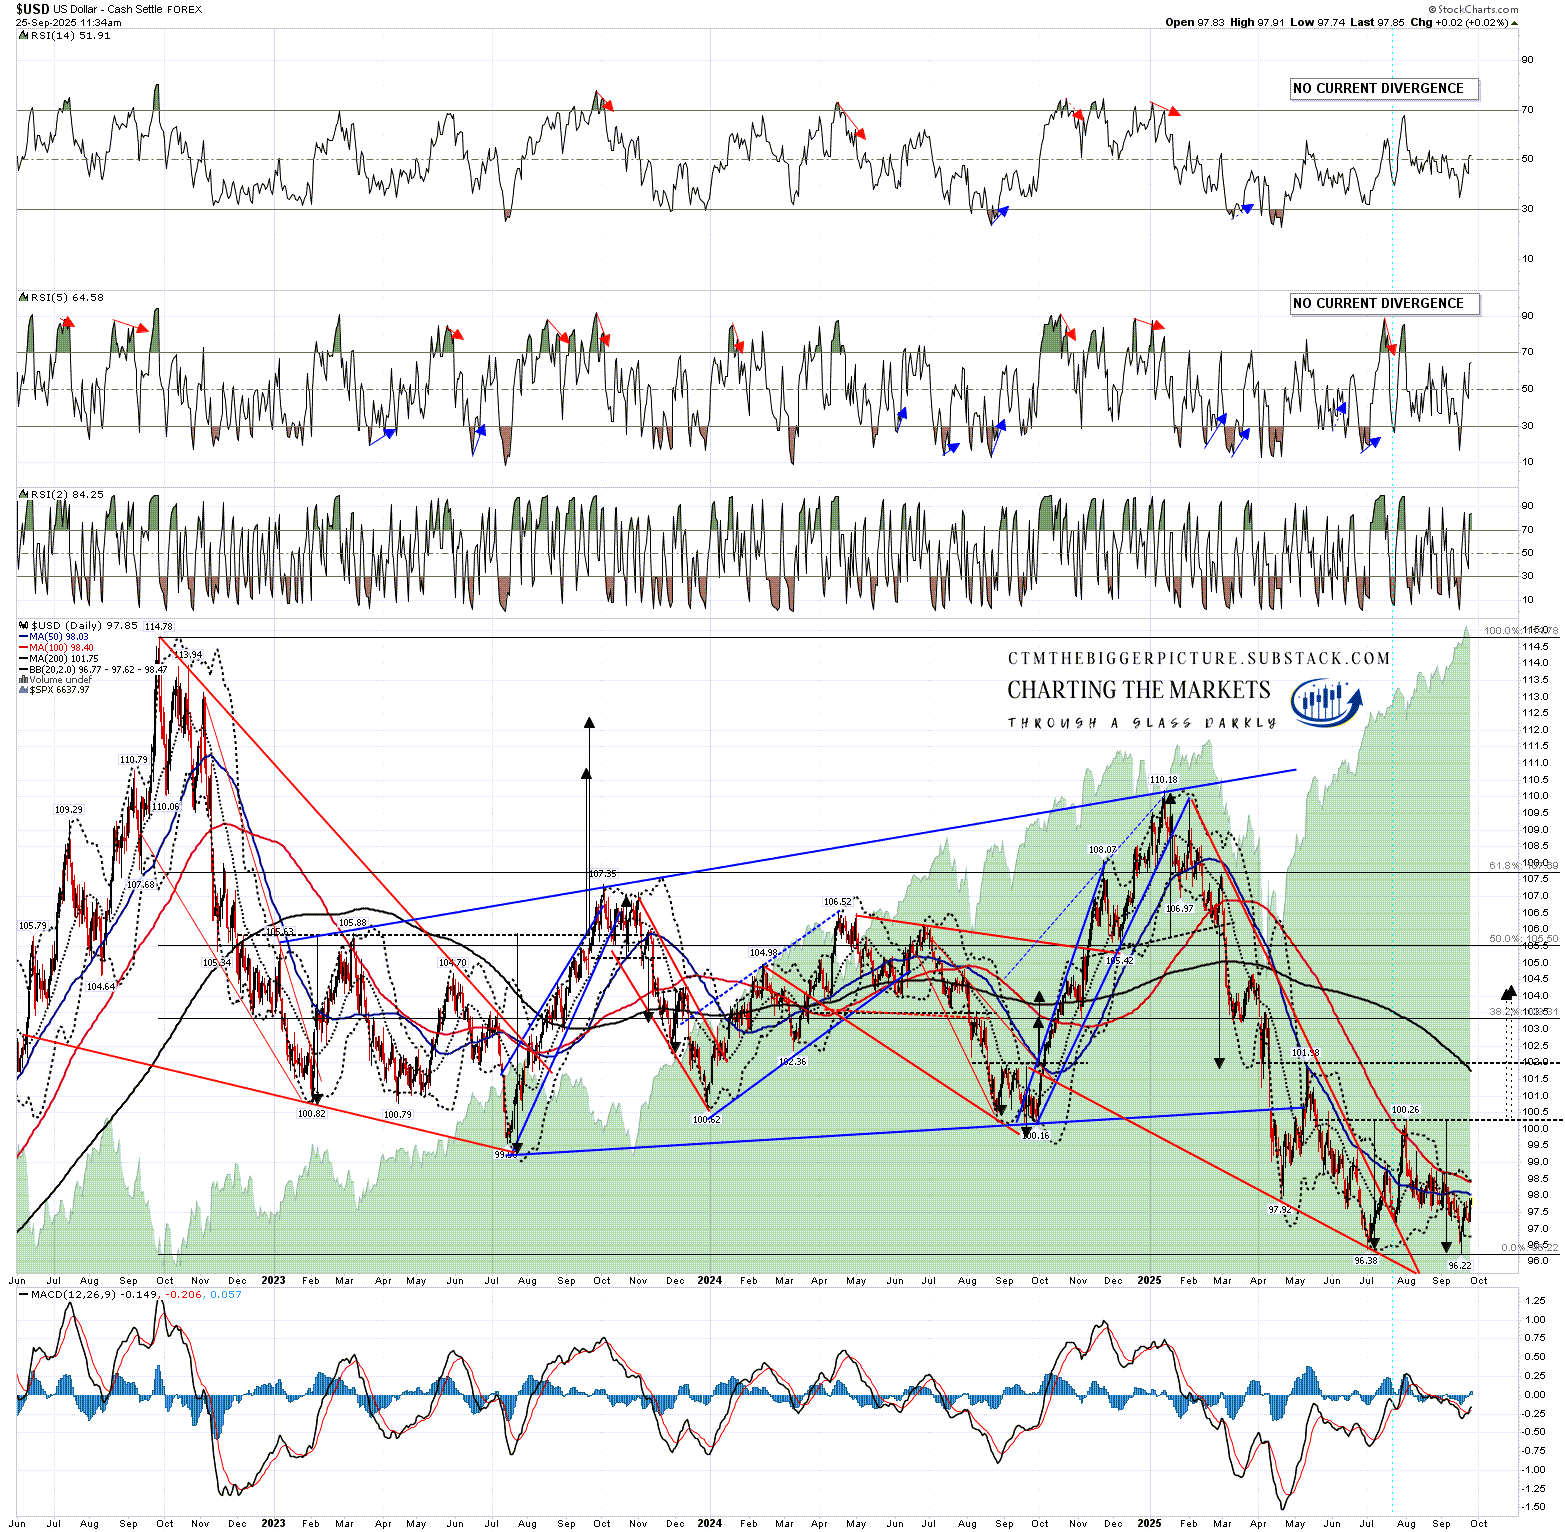
On the daily chart there’s no current RSI divergence, but there is now a very nice looking possible double bottom setup. On a sustained break over 100.26 the double bottom target would be in the to 104.14 to 104.30. That wouldn’t take USD all the way back to bull flag resistance, currently in the 108.80 area, but it would be a good start, and there is a possible IHS neckline in the 102 area that might deliver a larger reversal pattern.
USD daily chart:
As I was saying in my last post, this is a strong bull flag setup on USD that would generally have a strong chance of delivering a retest of the high at 114.78. There is a lot of gloom about the US Dollar here, but I’ve generally found that at big lows bearish sentiment tends to be very strong, just as bullish sentiment tends to be very strong at big highs.
I still really like this setup and this is a classic setup to start to deliver that retest. Even if USD ultimately fails to deliver that retest, this setup still has a strong chance of delivering at least a rally to the 104.14 to 104.30 target area.
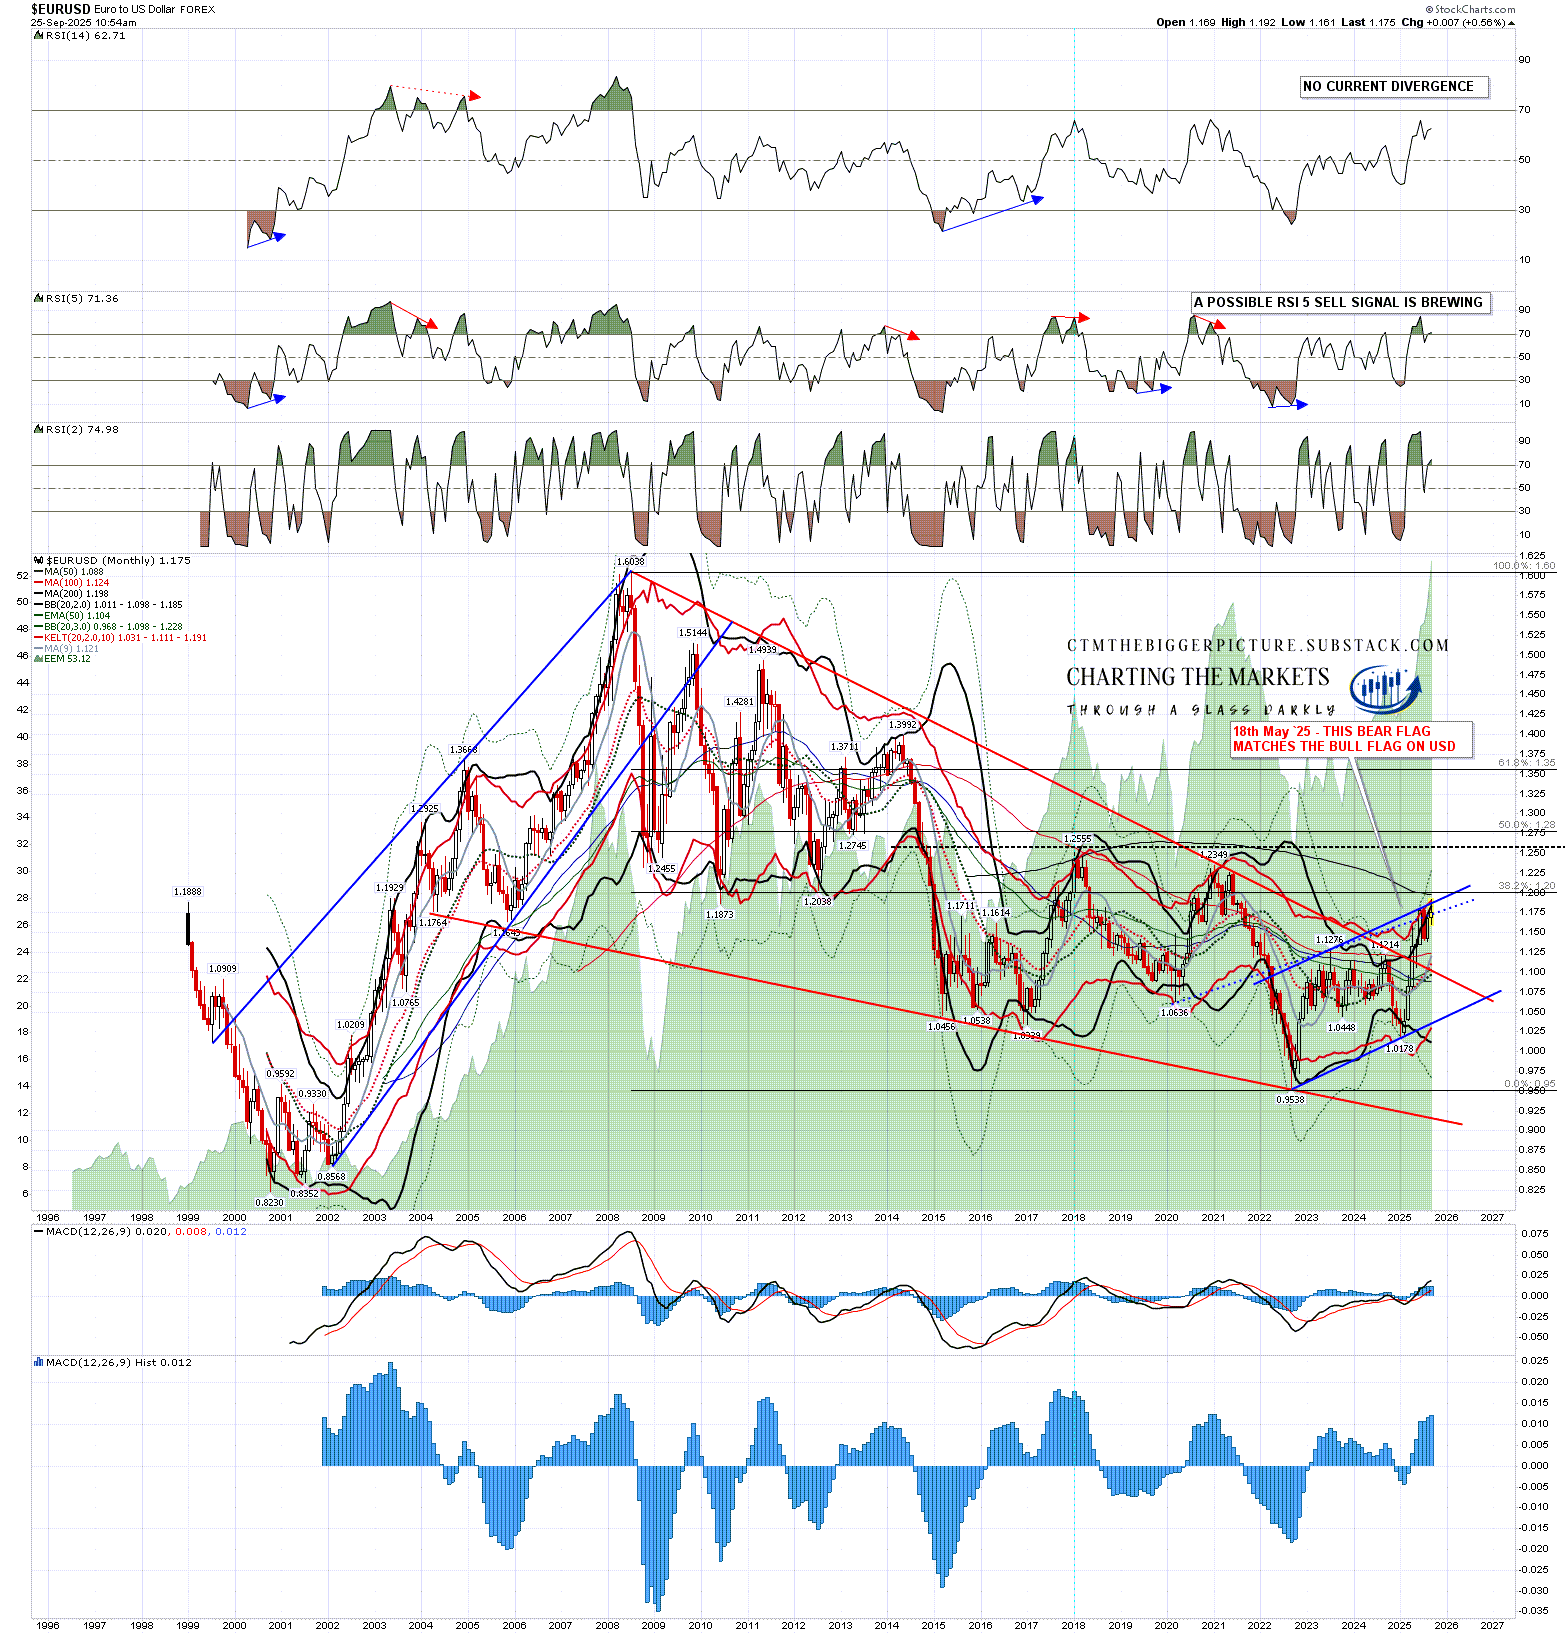
The setup is also mirrored by a strong bear flag setup on EURUSD that on a break down would look for a retest of the 2022 low at 0.9538. The Euro is 57.6% of the US Dollar currency index.
EURUSD monthly chart:
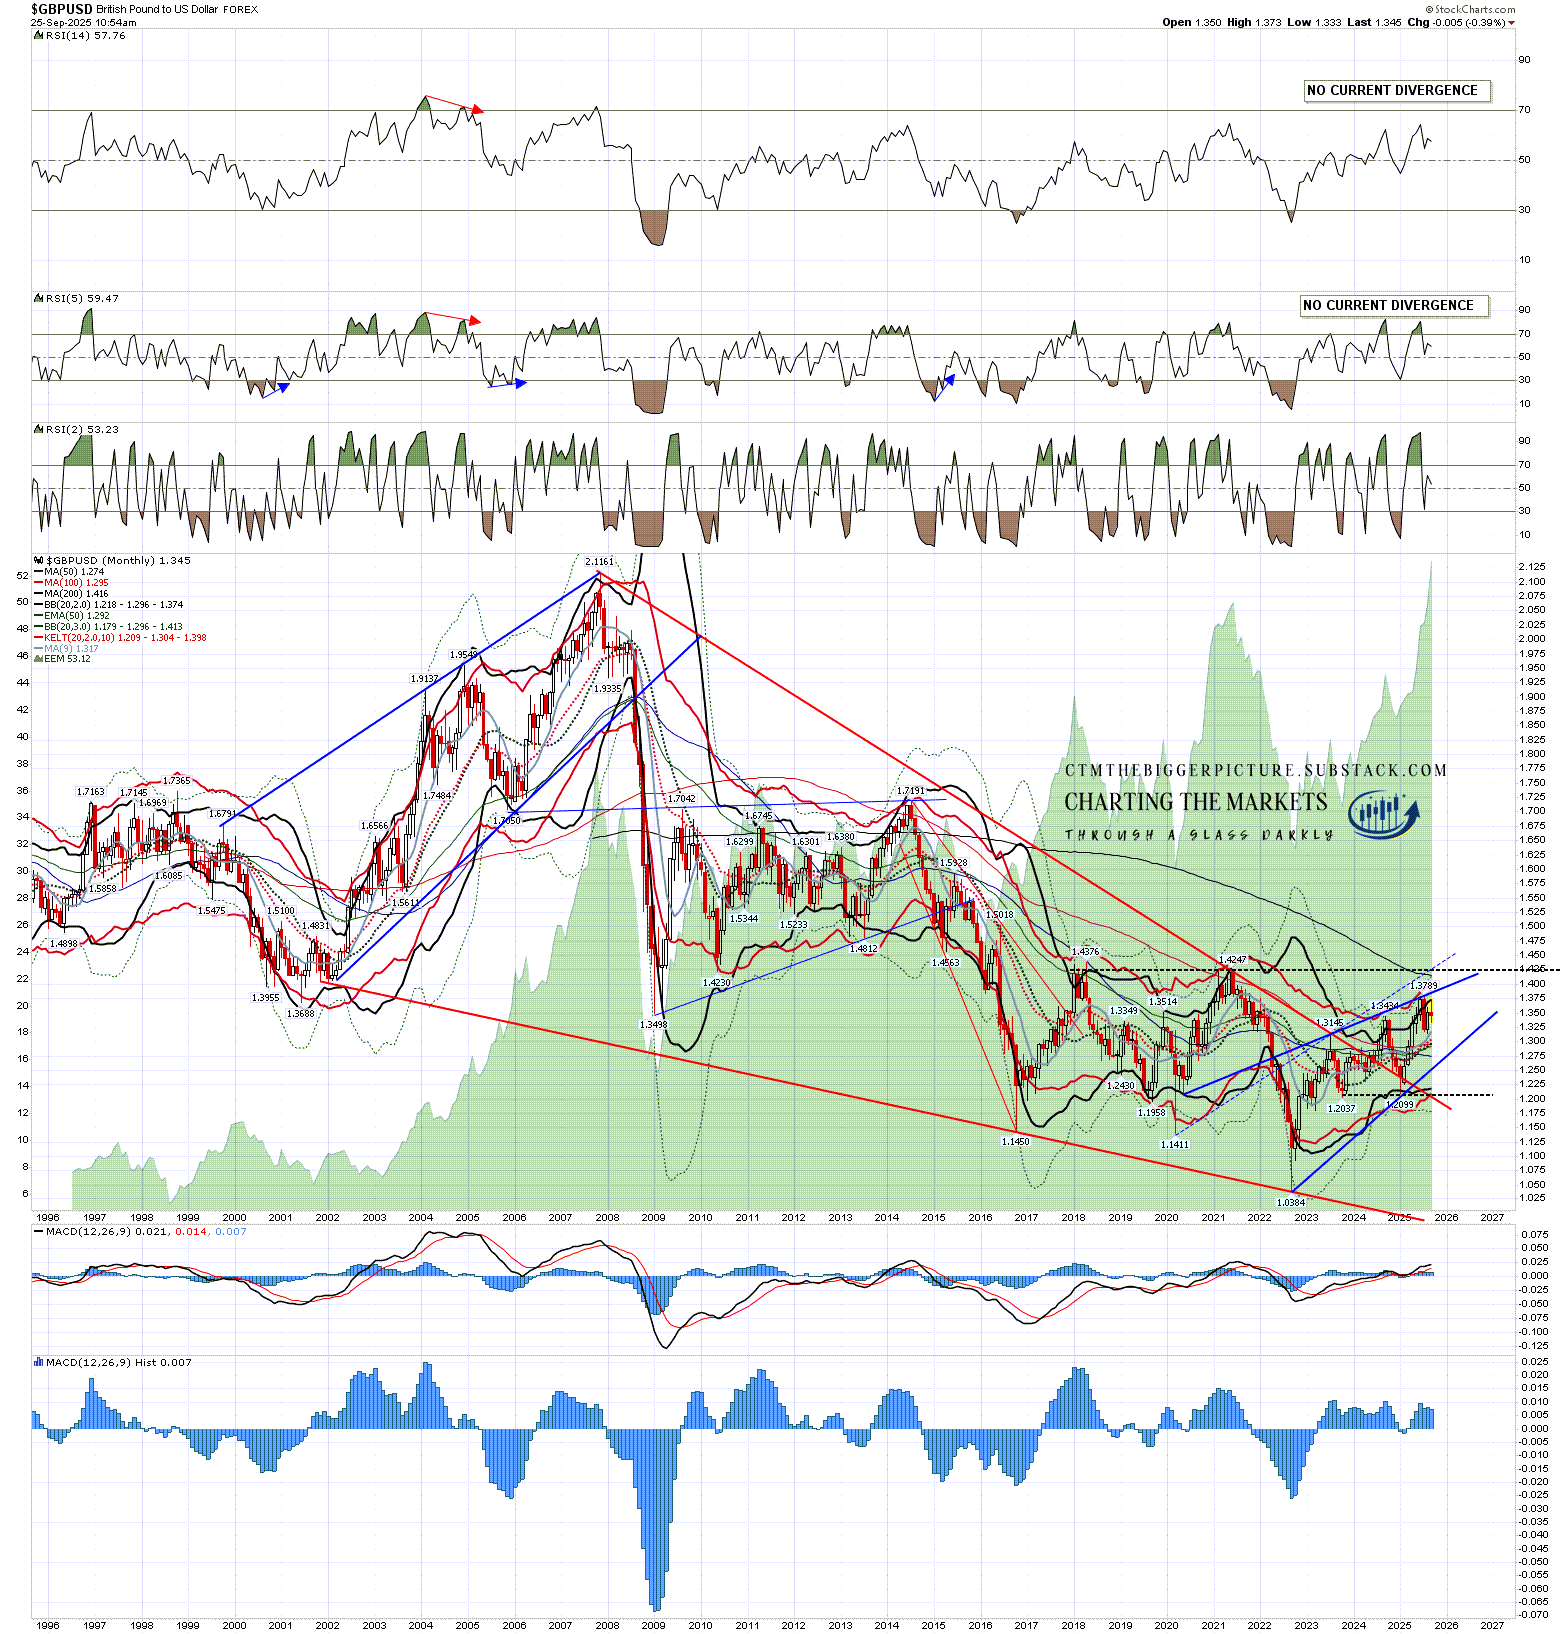
There is a also a mirror bear flag setup on GBPUSD, though in this case there is no short term double top setup and I have more doubts about a retest of the 2022 low at 1.0384. Nonetheless the bear flag is there, high quality, and GBP is another 11.9% of the USD currency index.
GBPUSD monthly chart:
There is another thing to mention here, and that is the extensive talk this year that the decline in USD from the January high at 110.18 to the current lows was due to the poor management of the Trump administration.
Now I am no fan of the Trump administration, and I have written in detail about my serious concerns about the economic impact of tariffs and the direction of US debt, but correlation is not causation and I’m not at all convinced that the USD decline this year had anything to do with US government policy. Consider this from the USD charts above:
On the monthly chart you can see my notes from Oct 2022 and Feb 2023 calling the likely high there at the establishment of the rising megaphone resistance trendline, and calling for the return to the corresponding rising megaphone support trendline that we have seen at the lows this year. USD dropped from 114.78 to 99.58 from Oct 2022 into July 2023 in a move that cannot be blamed on the Trump administration.
On the daily chart I have drawn the bear flag that then formed between the July 2023 low and the January 2025 high, and on the monthly chart you can again see my note from 9th March this year that the next target was likely that rising megaphone support which has been tested and slightly broken at the lows this year.
In my last post I was noting that most presidencies are just a blip on the longer term USD charts and I have mentioned many times before over the years that the news tends to take things that happen at the same time and weave them into a cause and effect narrative. That comforts listeners who like to feel that everything is explainable in simple terms but it doesn’t make it true.
I’d add that while I think the Trump administration is economically and fiscally reckless, a loss of confidence is akin to bankruptcy, which tends to build over a long period and then happen all at once. If markets had lost confidence in the Trump administration then long term treasury rates would be over 6% and equity markets would be a lot lower. That kind of loss of confidence may happen in the future, but it hasn’t happened yet.
If that does start to happen then the USD bull flag may take the lower probability option and break down towards a target in the 78-9 area, but until then this is a beautiful bullish setup and the odds favor at least a strong rally from this area.
If you like my analysis and would like to see more, please take a free subscription at my thebiggerpicture substack, where I publish these posts first and for members (from next week) also bi-weekly videos looking at equity indices, bonds, currencies and commodities. Those videos are posted on my Youtube channel after a four day delay. Links to all my posts from my charting substacks are also always posted on my twitter.
No comments:
Post a Comment