
In my post on the morning of September 3rd, just after the sharp decline on the first trading day of this month, I was noting buy signals on all six of the hourly equity index futures charts that I follow, and those all delivered over the remainder of that week. When four or more of these fix at once on the hourly futures they generally deliver.
In my the Bigger Picture video on Sunday 7th September I was noting the strongly bullish leaning historical stats for the coming week and was suggesting a target for QQQ at a retest of the August all time high at 583.32, and we saw that with a new all time high at 587.86, seeing also new all time highs on SPX and DIA, and IWM moving closer to the IHS target at a retest of the Nov 2024 all time high at 243.04.
In my post on Monday September 15th and my last post a week ago I was looking in detail at the historical stats suggesting that after Tuesday last week there was a short bearish window into the end of September, and looking at the limited pattern support for a modest retracement
That bearish window is not yet over, but the strongest part of it is over. The stats favor the bullish side today, are neutral to bullish on Monday, with a bearish leaning day on Tuesday, last day of the month and down on SPX 18 out of the last 27 years. That ends the bearish window, with bullish days on Wednesday and Friday next week and generally bullish leaning tape until the start of the last week in October.
Does that mean that equity indices can’t go down further? No, but the obvious window to do that is closing, and there isn’t much in terms of patterns or divergence to support much more downside.
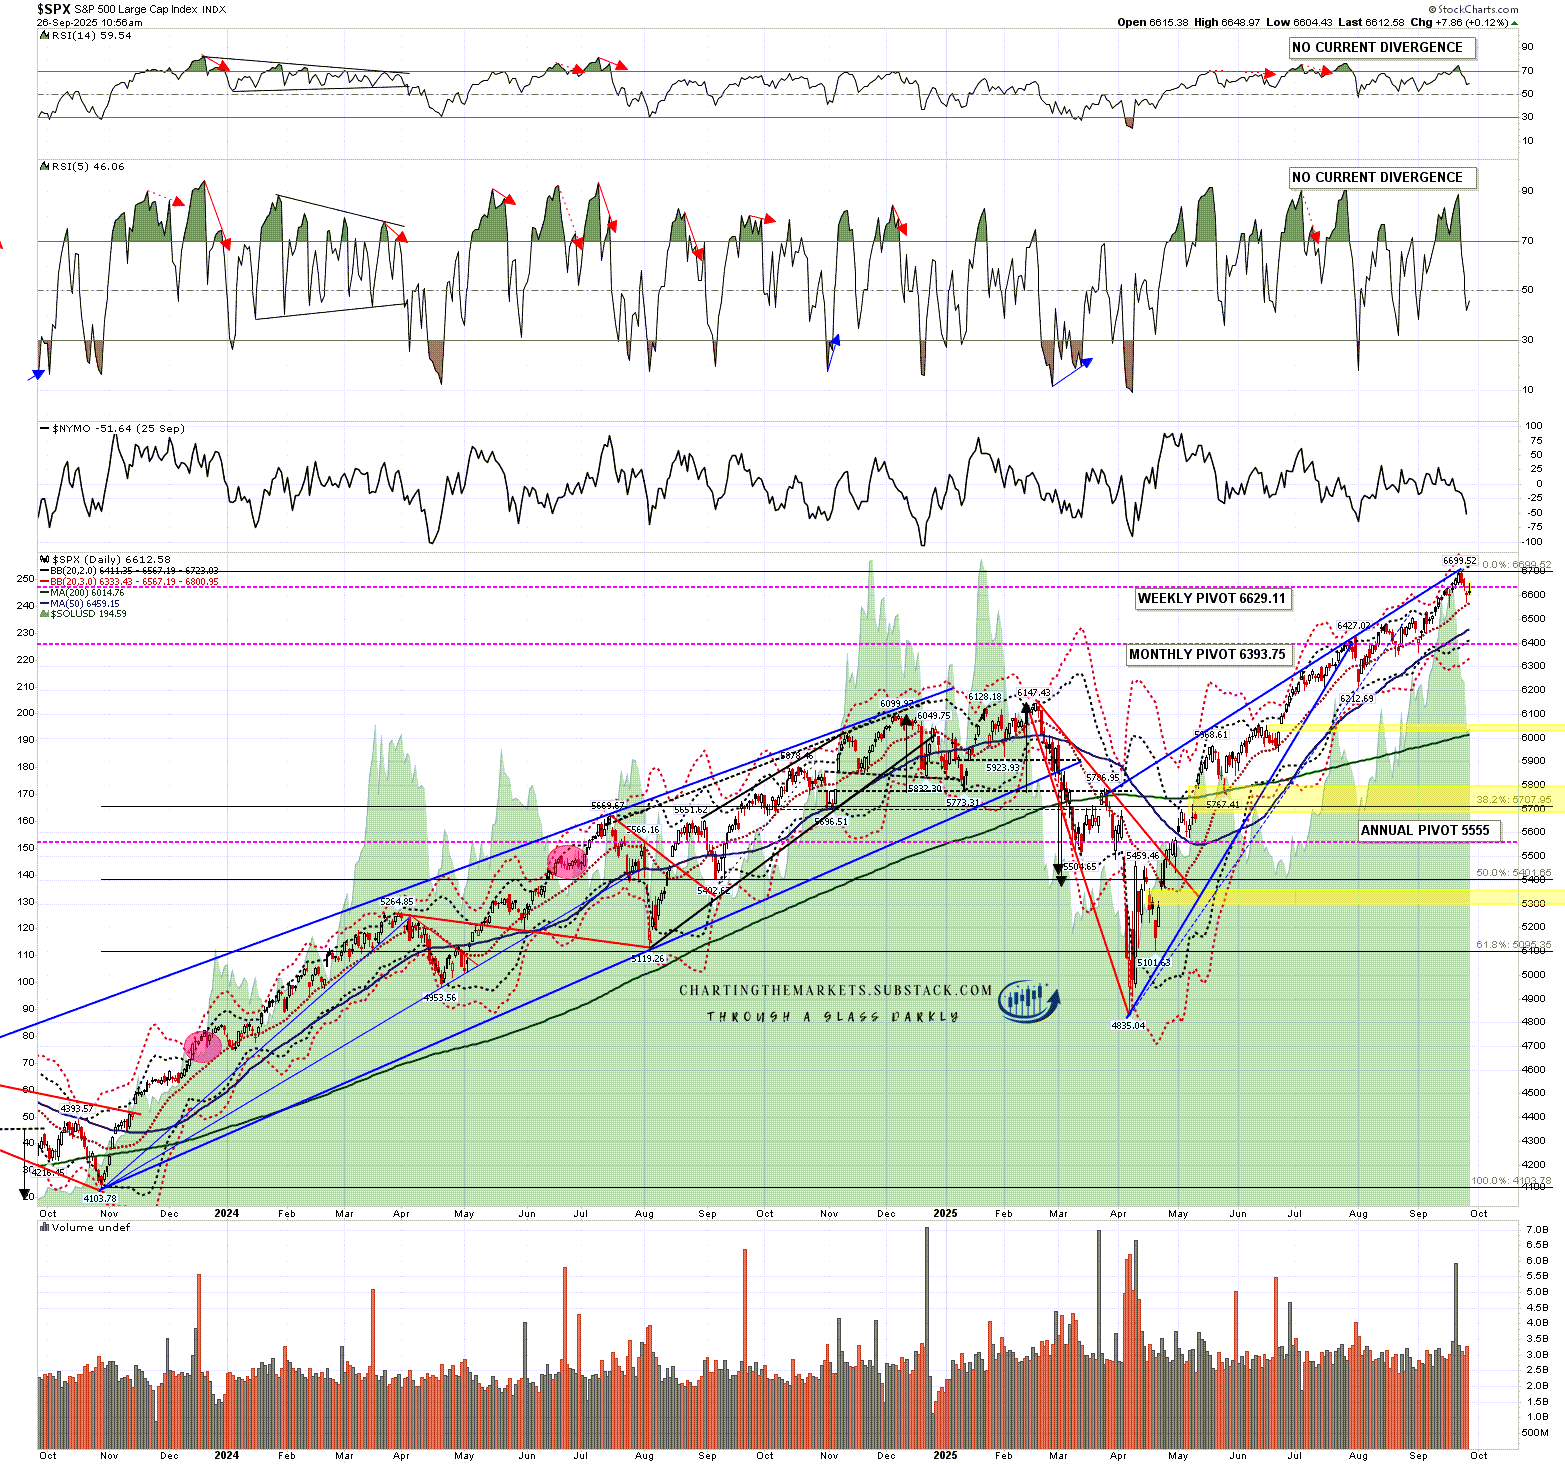
In the short term SPX has reached the obvious retracement target at a backtest of the daily middle band. This is the sixth backtest since SPX broke back over the daily middle band after the April low and on the last three backtests SPX went a bit lower and closed below the daily middle band for one day before rejecting higher. We could still see that on SPX here before the end of the month but only a sustained break below the daily middle band would suggest any real weakness.
SPX daily chart:
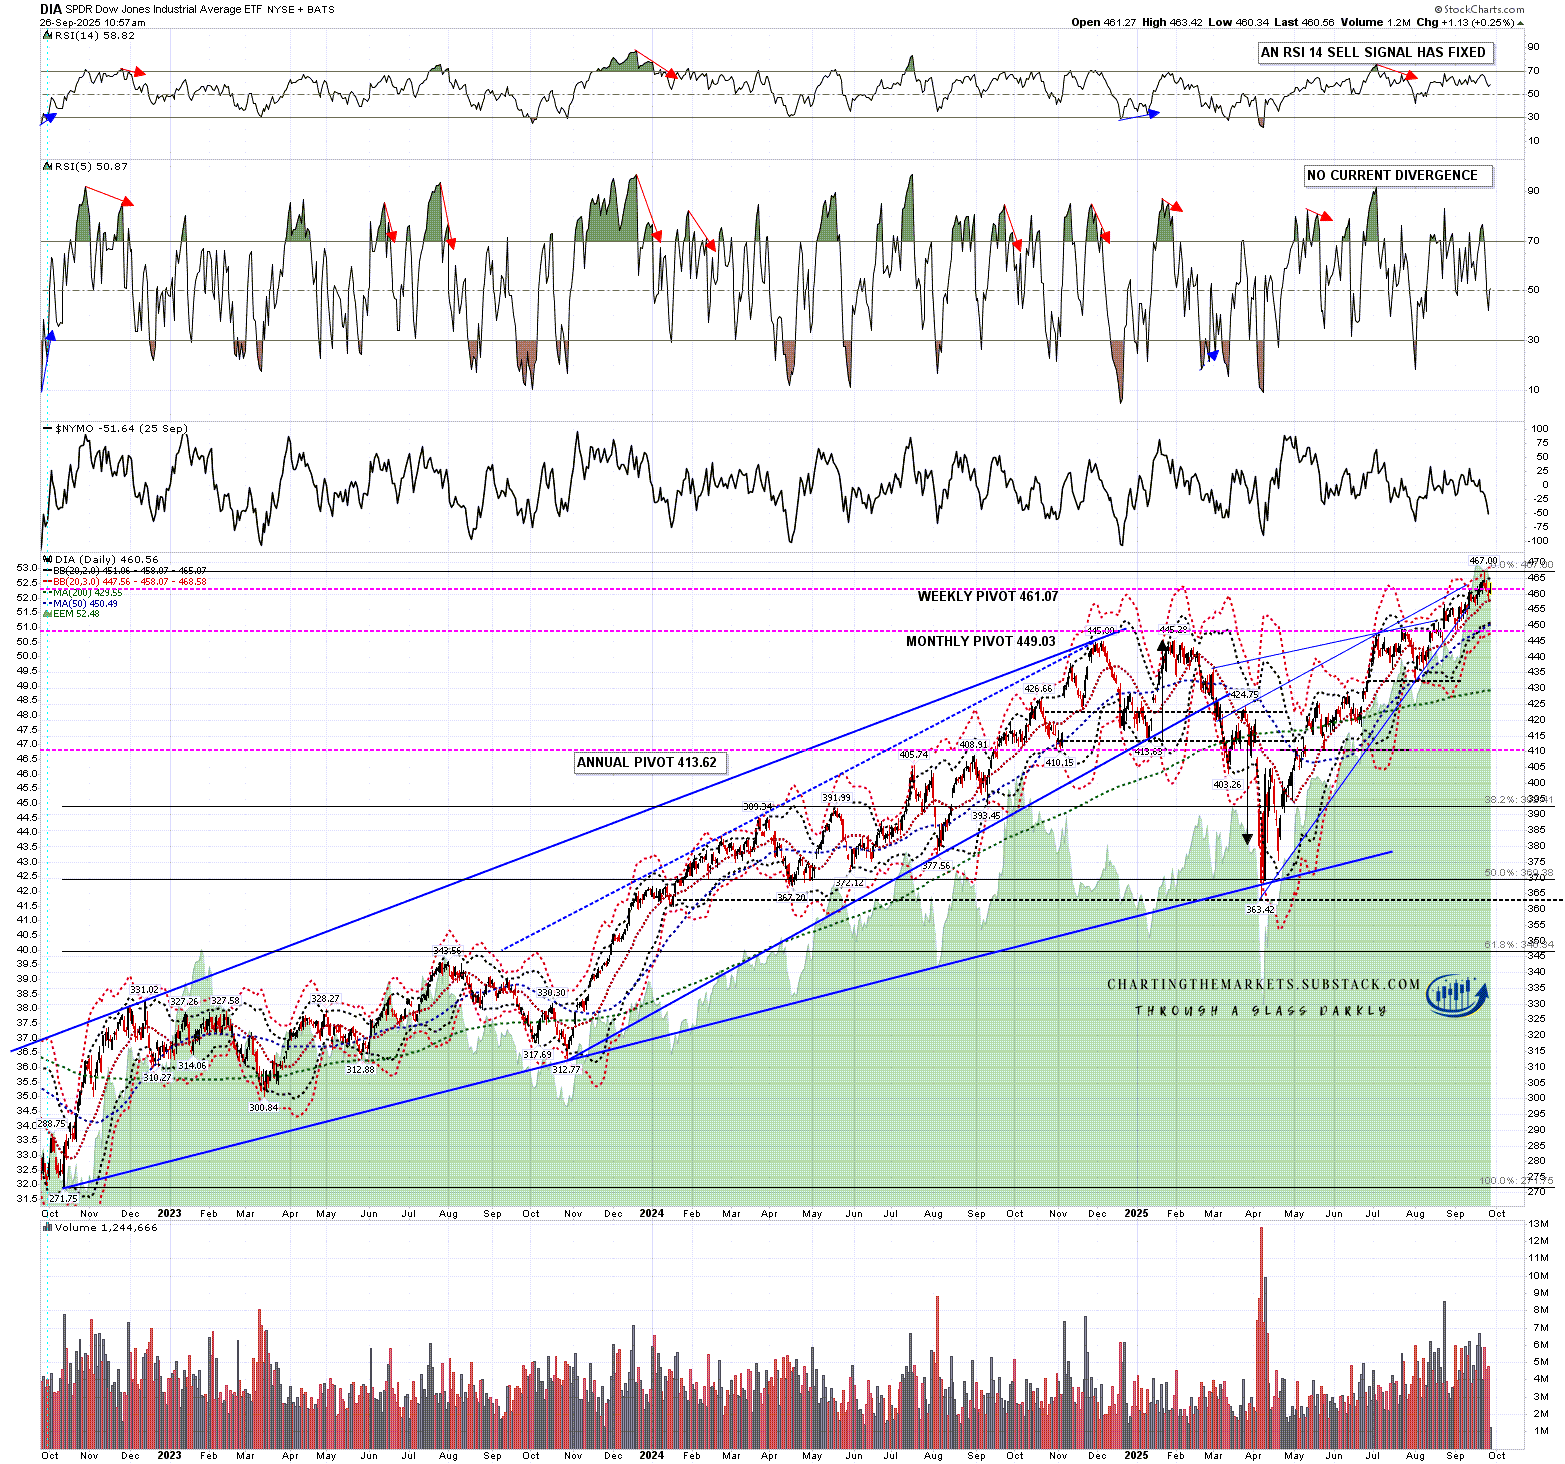
DIA has also backtested the daily middle band at the low yesterday. This hasn’t been as consistently strong support as on SPX, and there have been two multi-day moves back under the daily middle band since the break back above after the April low. There were another seven tests where the middle band was backtested as it was yesterday, and DIA went directly higher from there.
DIA daily chart:
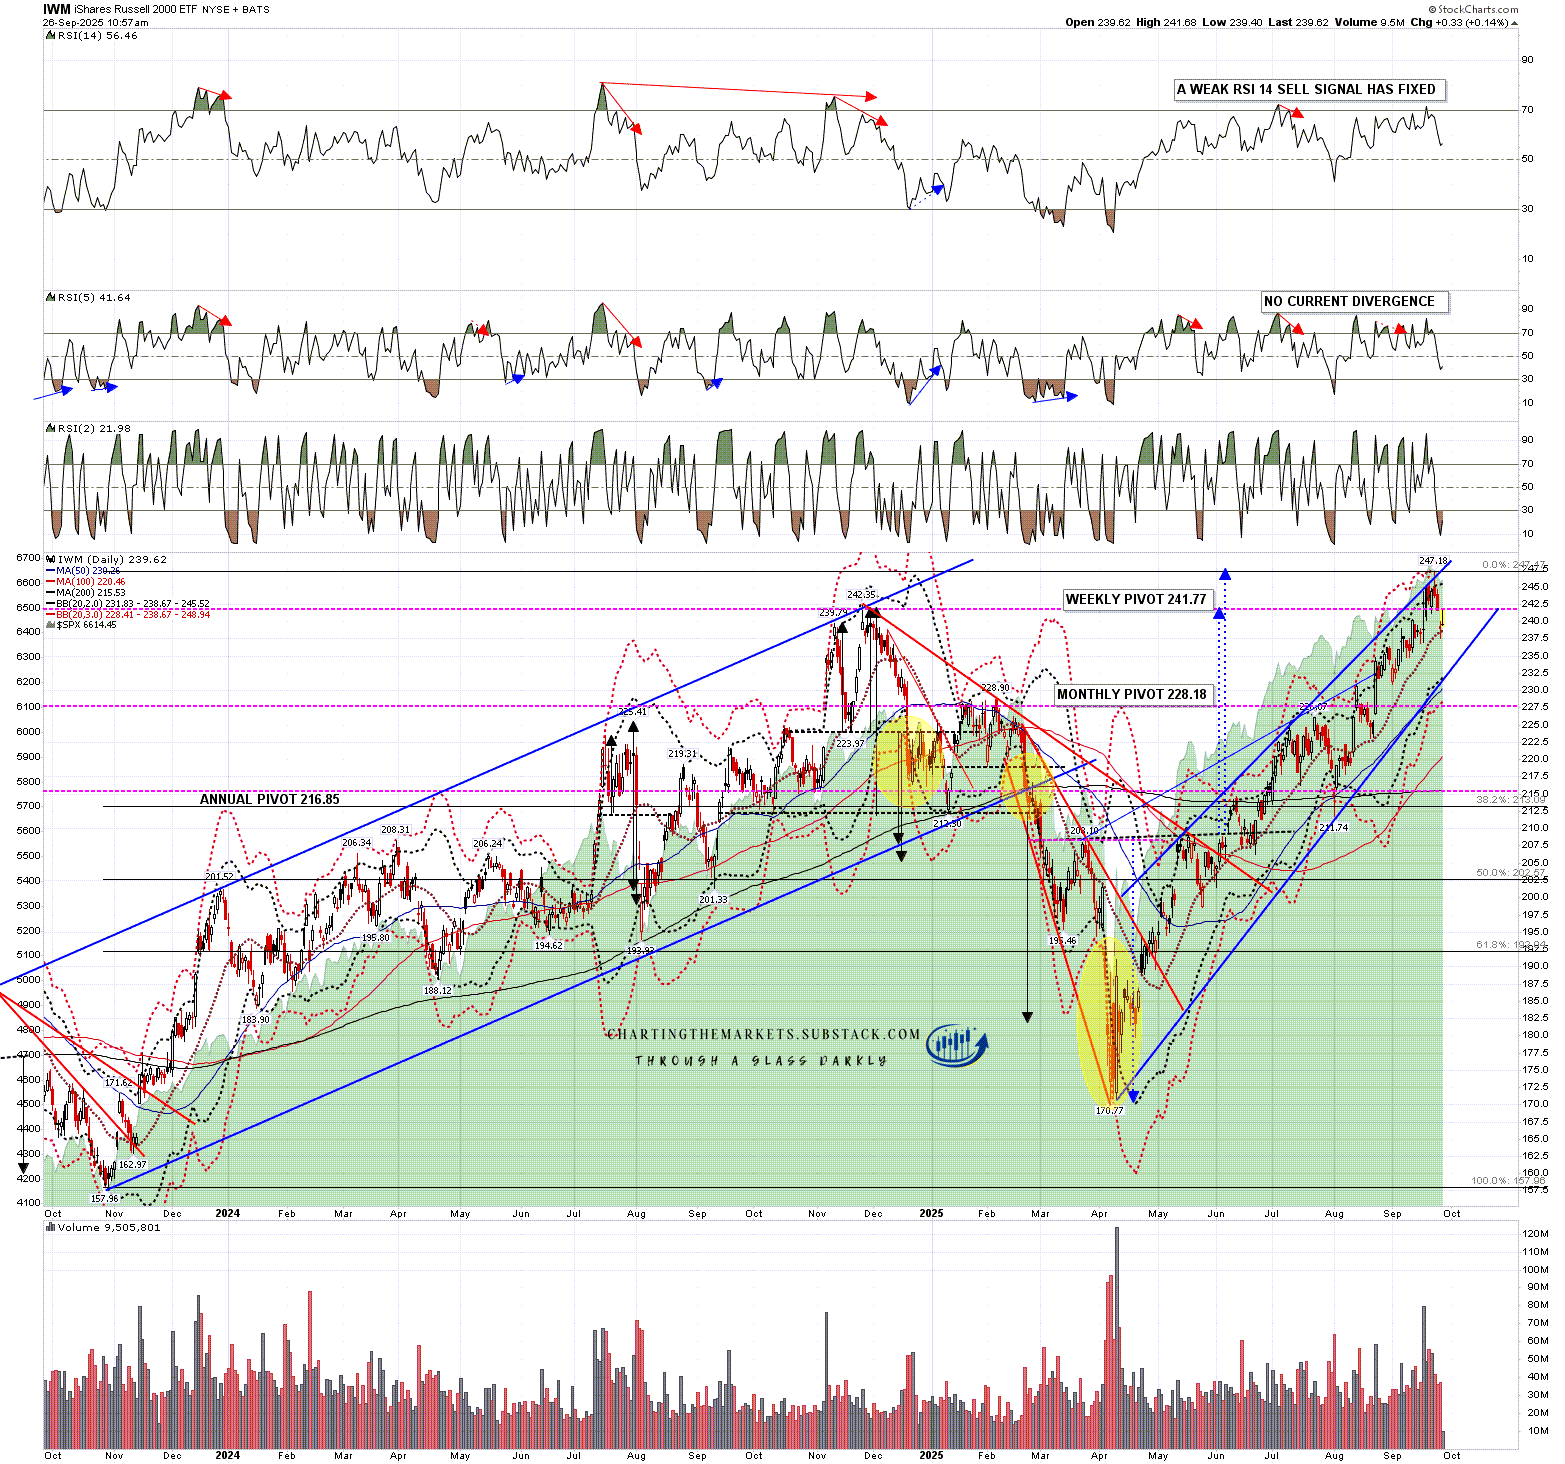
IWM also backtested the daily middle band at the low yesterday. On IWM there has been one multi-day move under the daily middle band since the break back above after the April low. There were further seven tests where the middle band was backtested as it was yesterday, and IWM went directly higher from there.
I would note though that this uptrend on indices was only supported by one major bottoming pattern from the April low, that I first laid out as a possible scenario in my post on 3rd June, which made target last week at a retest of the all time high on IWM made in Nov 2024. That doesn’t suggest a strong reversal here, but that pattern is no longer supporting more upside.
IWM daily chart:
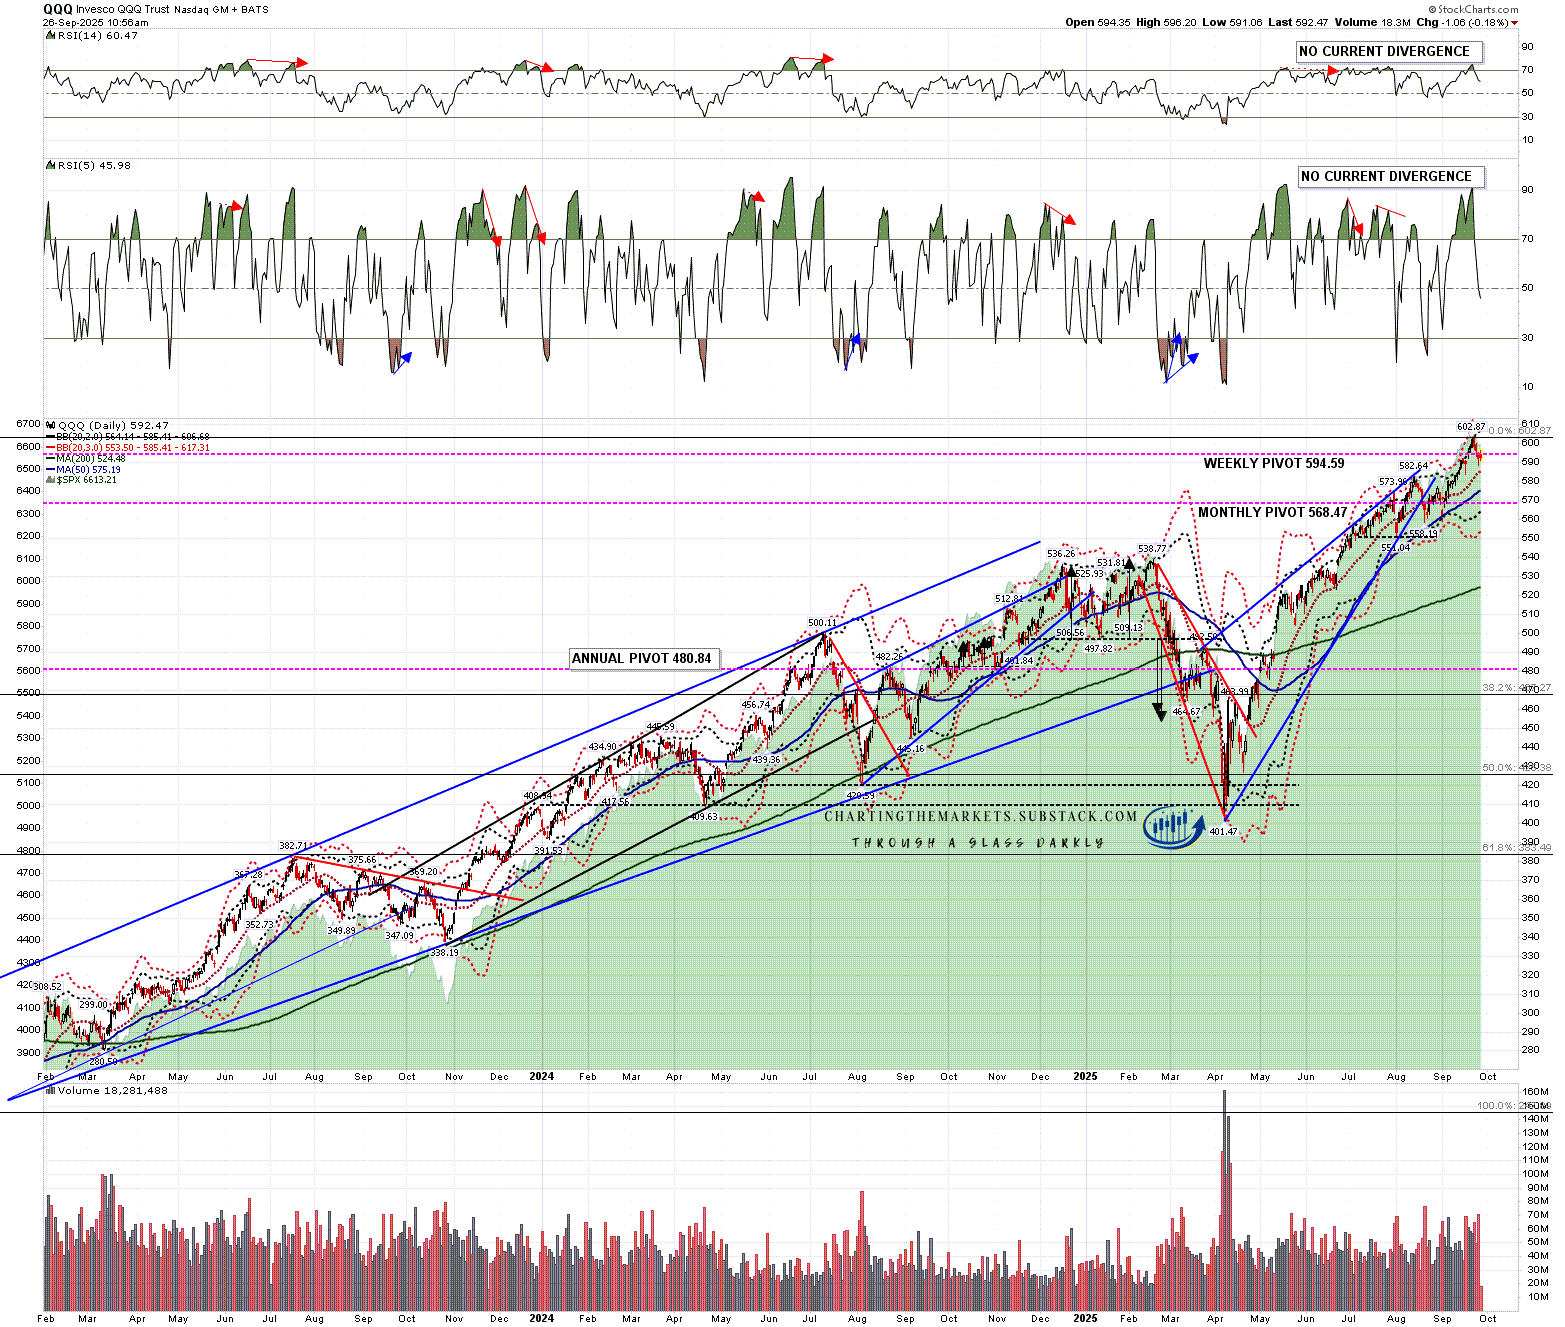
What has supported much of the rest of the upside is tech stocks, which have not been as consistently bullish as SPX since the April low, with two breaks since then below the daily middle band that lasted a couple of days and only one other full middle band backtest otherwise. That wasn’t yesterday as QQQ is the only one of these four indices that has not backtested the daily middle band on this retracement. There is no strong history of full backtests on the daily middle band on QQQ, and no obvious reason to expect one now.
QQQ daily chart:
In my last post I said that:
Is there anything so far suggesting a significant high being made here? No, though that could change. If so we might still see a decent retracement in October, which is a strong month for those historically. I’ll keep an open mind and call out any decent patterns that form.
Overall I am liking bearish leaning tape into the end of the month and a possible retracement of some of the decent gains made in September. We’ll see.
On the bigger picture since late 2024 I have been leaning towards seeing a possible much more serious high on equities made at the end of 2025 and I didn’t see anything to change that view this week.
We’ve seen that retracement, and we may see a bit more, but to see anything genuinely impressive we would now need to see multiple hard breaks of these daily middle bands, and there’s not much to suggest that may happen here. If that changes I’ll be looking at that, but until then I’m expecting a resumption of the overall uptrend soon.
Everyone have a great weekend. :-)
If you like my analysis and would like to see more, please take a free subscription at my chartingthemarkets substack, where I publish these posts first. I also do a premarket video every day on equity indices, bonds, currencies, energies, precious commodities and other commodities at 8.45am EST, but only for paying subscribers. Other places to find me are my twitter, and my Youtube channel.
No comments:
Post a Comment