
Back in my post on 11th April I called the likely start of a strong rally which we then saw.
Back in my post on 12th May I called for new all time highs on Bitcoin (BTCUSD) and laid out possible IHS scenarios on both Solana (SOLUSD) and Ethereum (ETHUSD), looking for ideal right shoulder lows on Solana in the 125.43 area and on Ethereum in the 2074.27 area. That hasn’t gone quite as I drew then but essentially Solana is still running that scenario, and Ethereum has already reached the IHS target.
Back in my post on 23rd June I called the likely lows on those right shoulders made on Solana at 126.09 and on Ethereum at 2113.65, and was looking for that IHS scenario on both to start to play out.
Back in my post on 18th July I was looking at the IHS that had since broken up on Ethereum and the progress made towards the IHS neckline on Solana.
In my post on 22nd July I was looking for some retracement after the IHS on Solana had broken up, and looking also at the possibility that a setup for a hard fail might form in that retracement.
In my post on 4th Aug I was looking at that retracement on Solana and looking for higher highs soon which we saw. I was expecting Ethereum to reach the IHS target at 4109.05 which we saw.
In my post on 19th August I was looking at a likely retracement starting on both equities and Crypto and we’ve seen that. There is now a clear inflection point here where Crypto could rally back into retests of the recent highs, or break down further into the next targets.
In my post on 25th August I was looking at a double top setup on Bitcoin, the weekly RSI 5 sell signal that had just fixed, and looking at the weekly middle band, currently at 110,115.55, as the key level that might prevent that double top reaching the target in the 99k to 100k area.
After that post the weekly RSI 5 sell signal reached the possible near miss target as Bitcoin closed slightly below the weekly middle band at the end of that week. That failed to follow through though afterwards and Bitcoin has continued to trade and close above it since.
In my last post on 9th September I was looking at the resistance levels that needed to be broken on Bitcoin and Solana to open the upside.
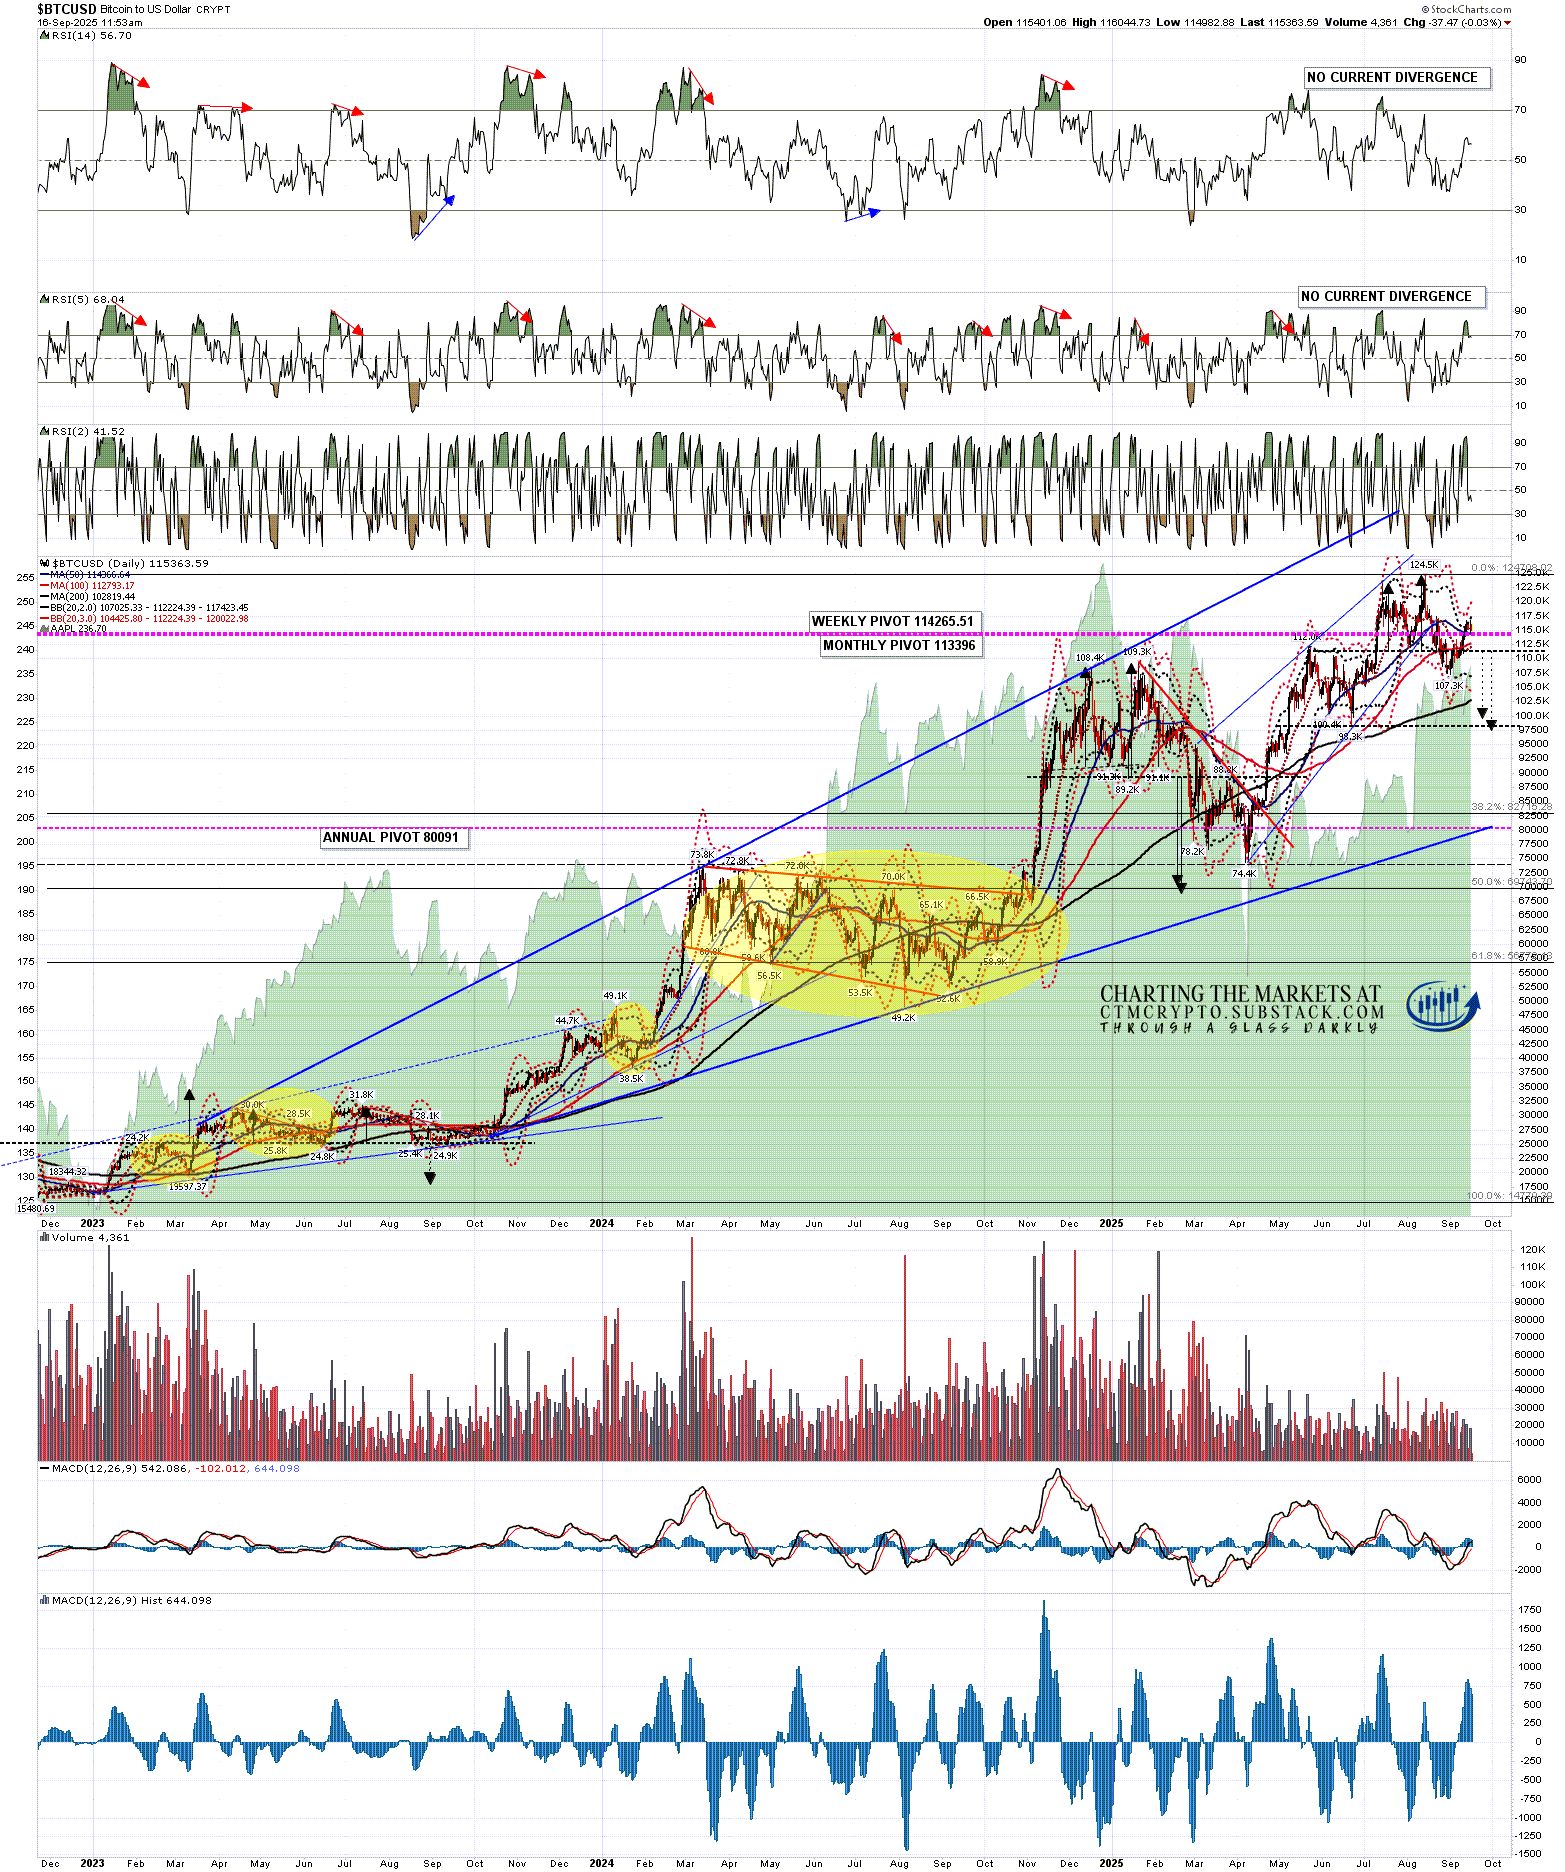
On Bitcoin the resistance levels were first at the daily middle band, currently at 112,225, and broken and converted to support last week, and second at the 50dma, currently at 114,367, broken at the weekend and currently backtesting as support.
BTCUSD daily chart:
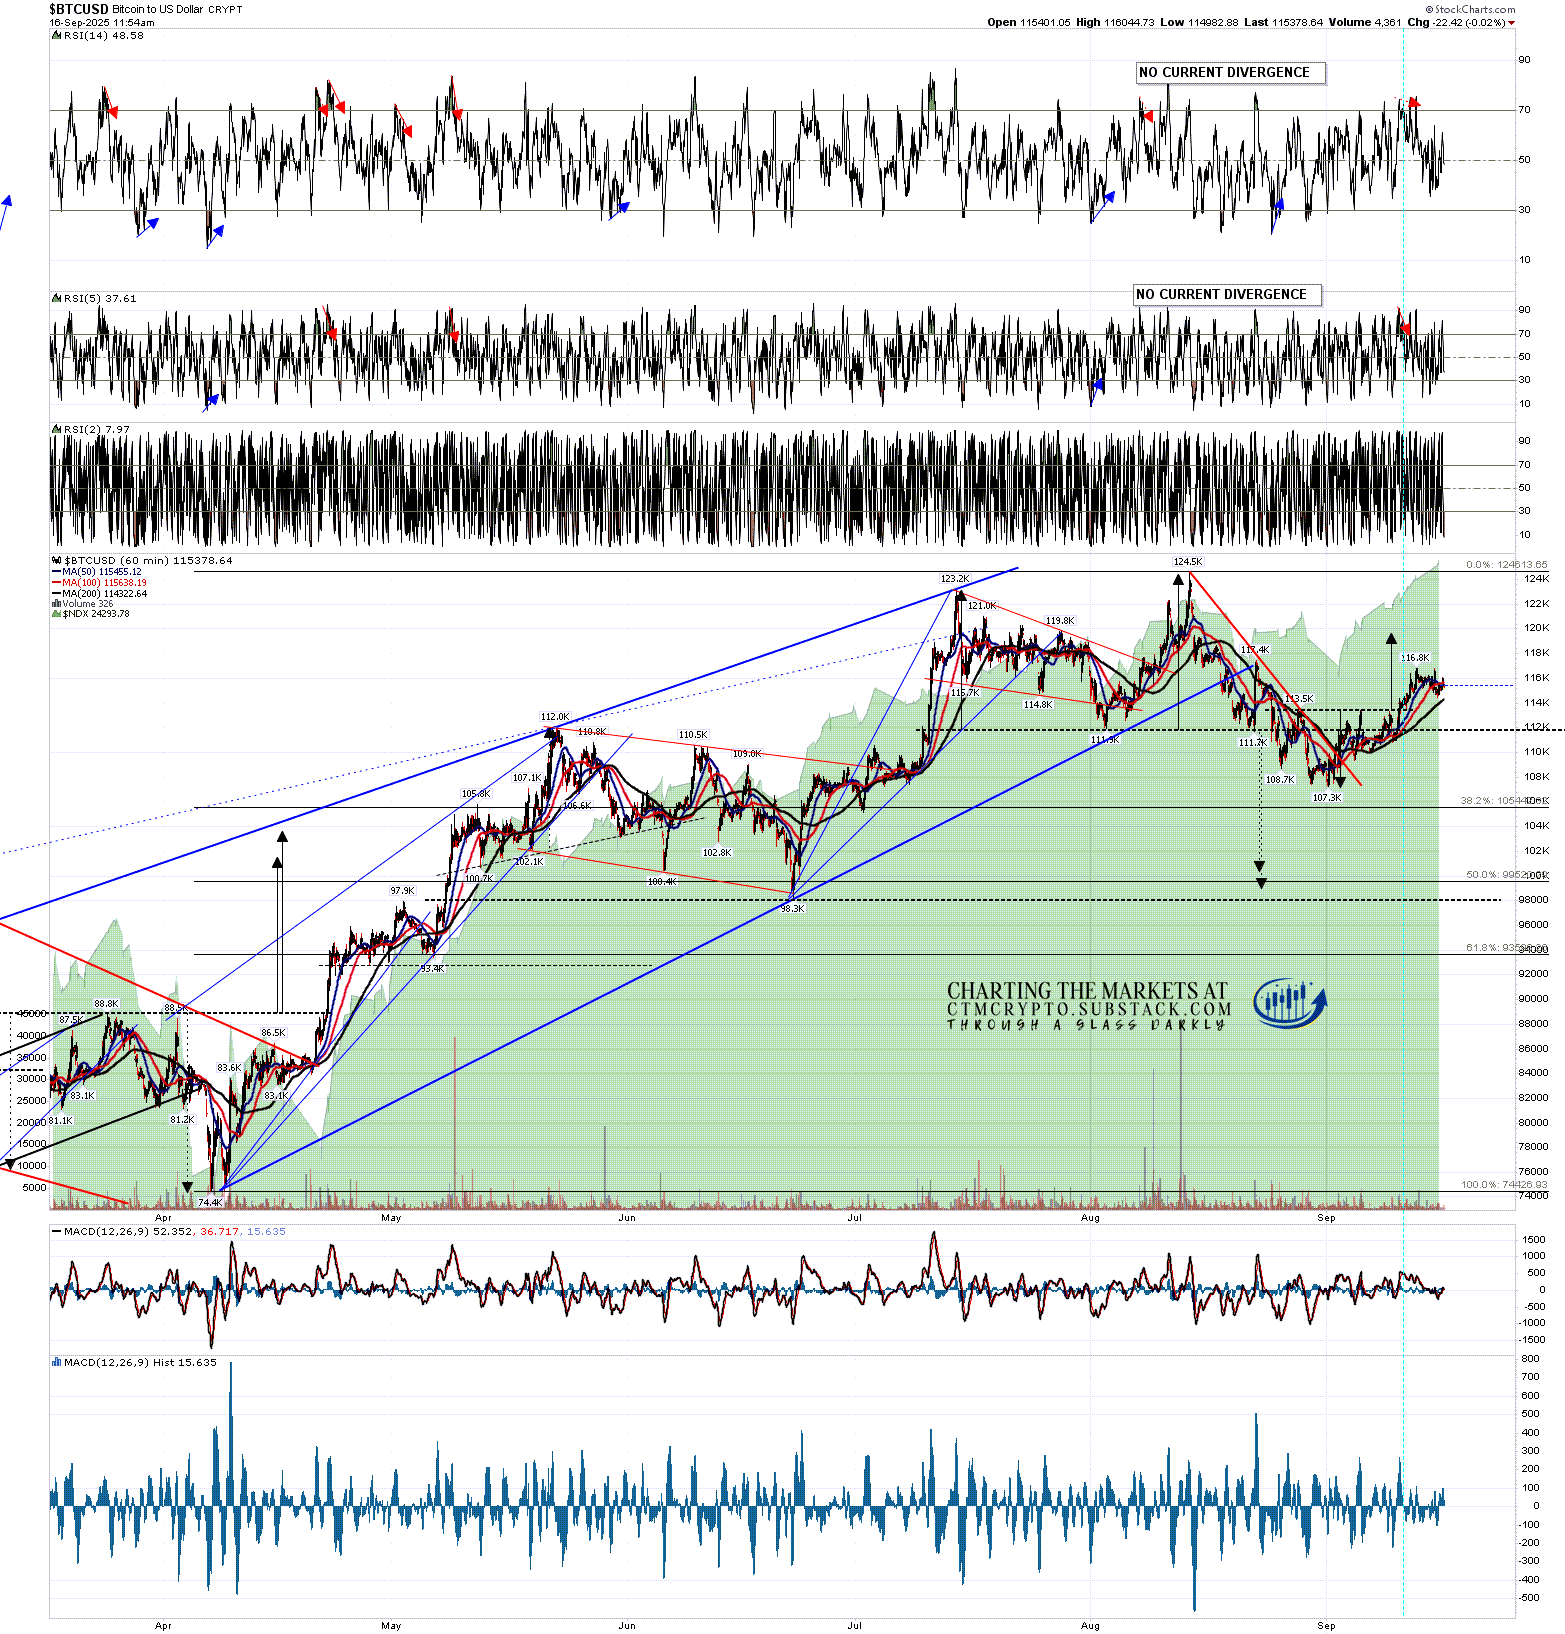
On the hourly chart Bitcoin has broken up from a small IHS with a target in the 119.7k area and that target is now in range. We might then see a direct retest of the current all time high or, if a bull flag is forming, a lower low below 107.3k to complete and ABC bull flag before that retest.
BTCUSD 60min chart:
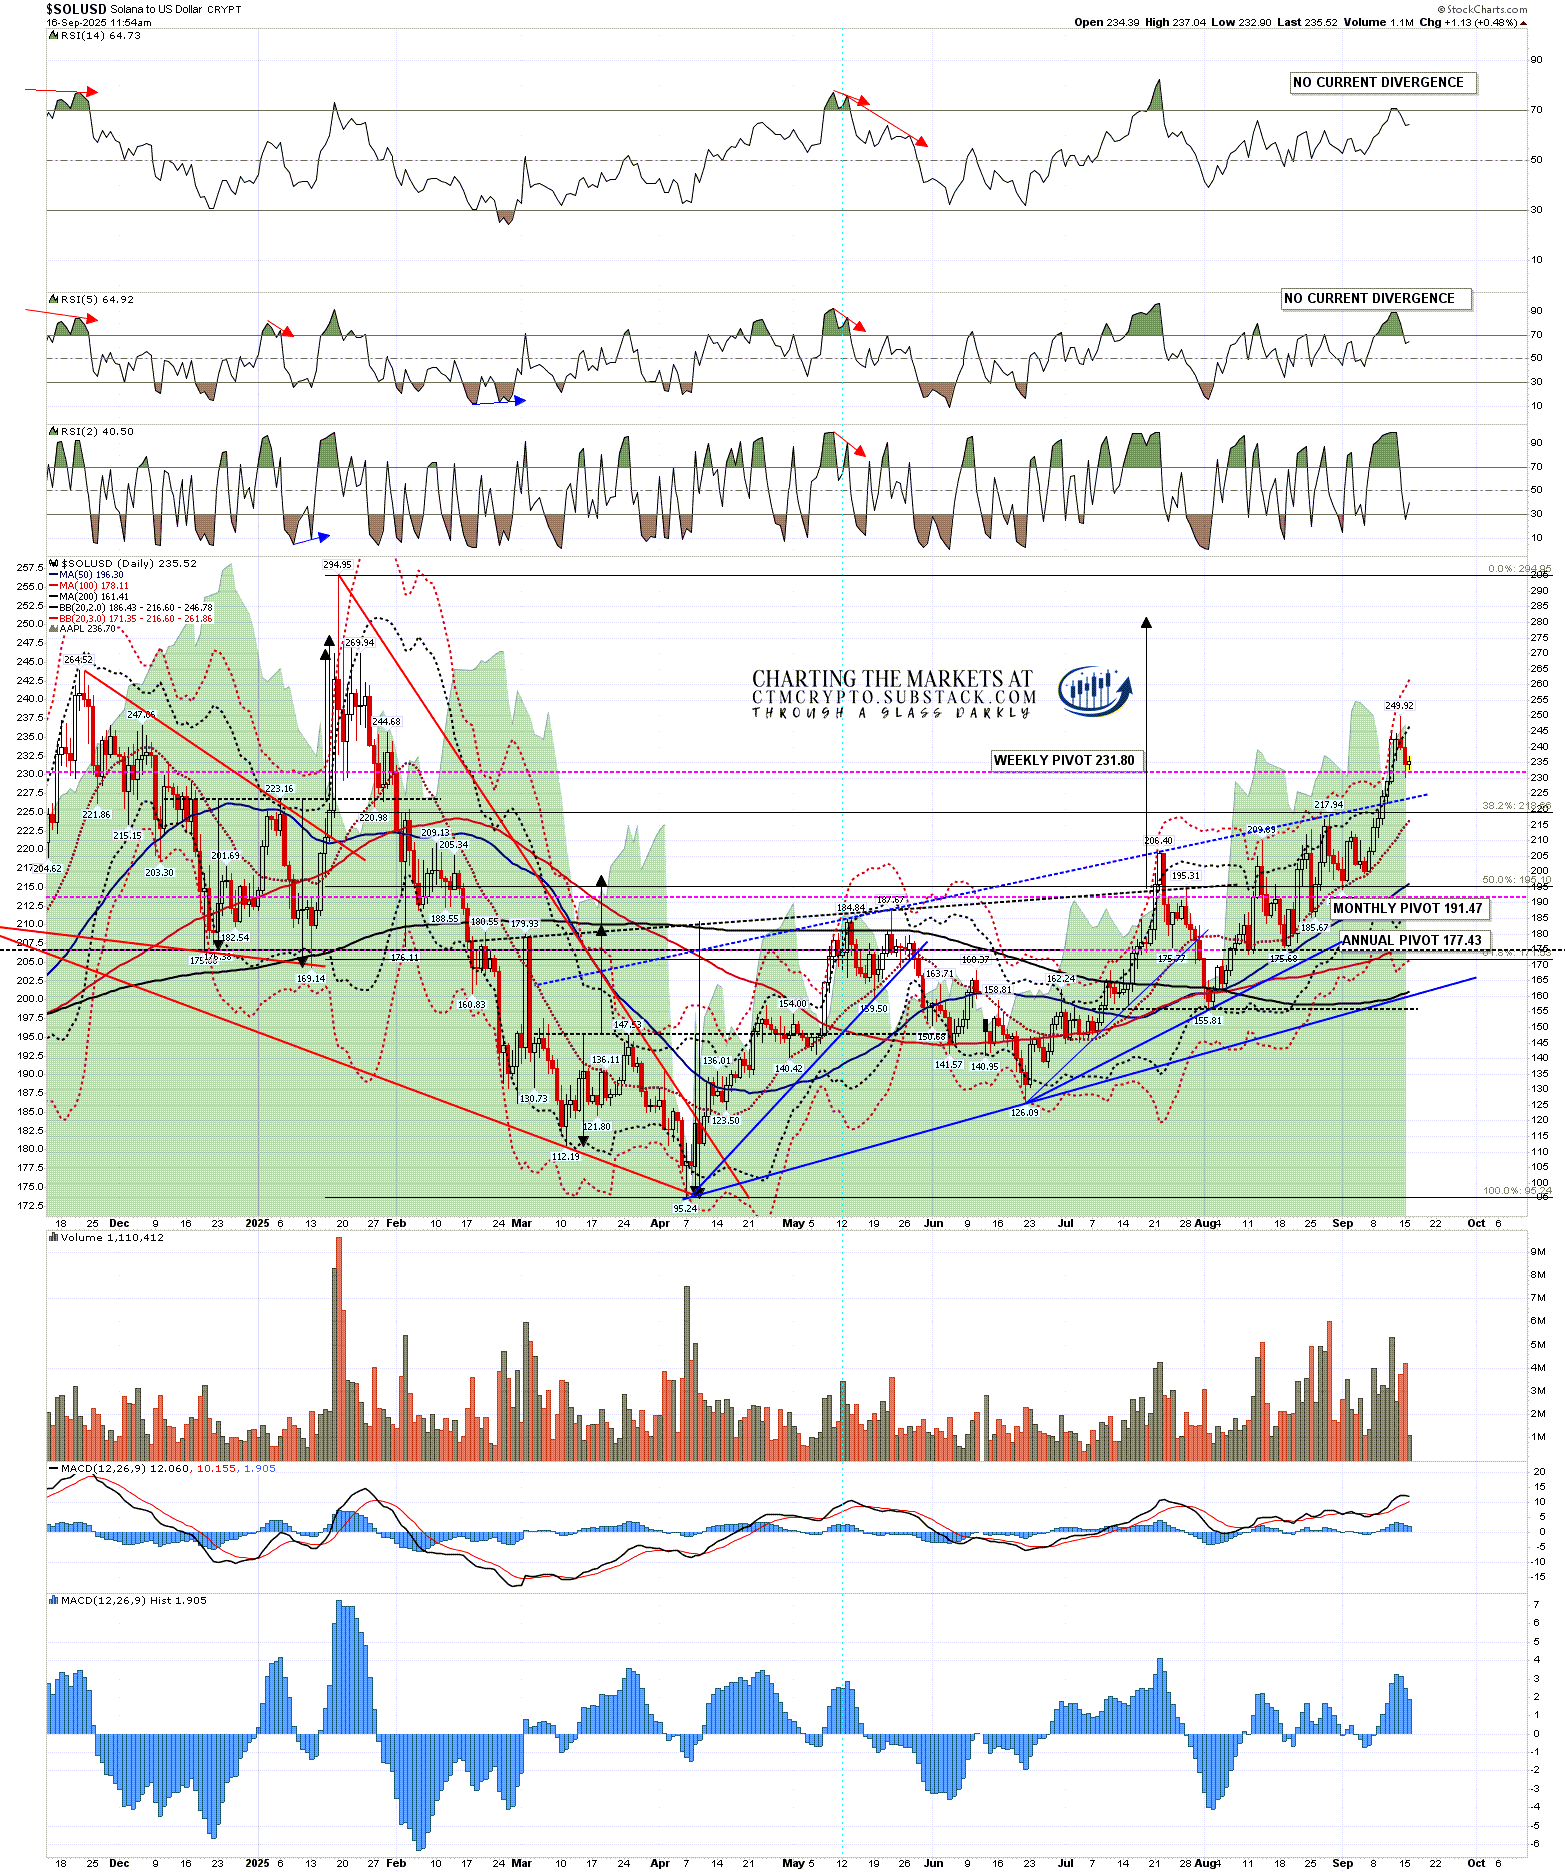
On the Solana daily chart I was looking at the possible resistance trendline marked in blue dotted line and saying that if Solana was to make a decent move towards the IHS target in the 282 area then that would need to be broken convincingly, and it now has been. Solana tested the 3sd upper band late last week and has since been consolidating.
SOLUSD daily chart:
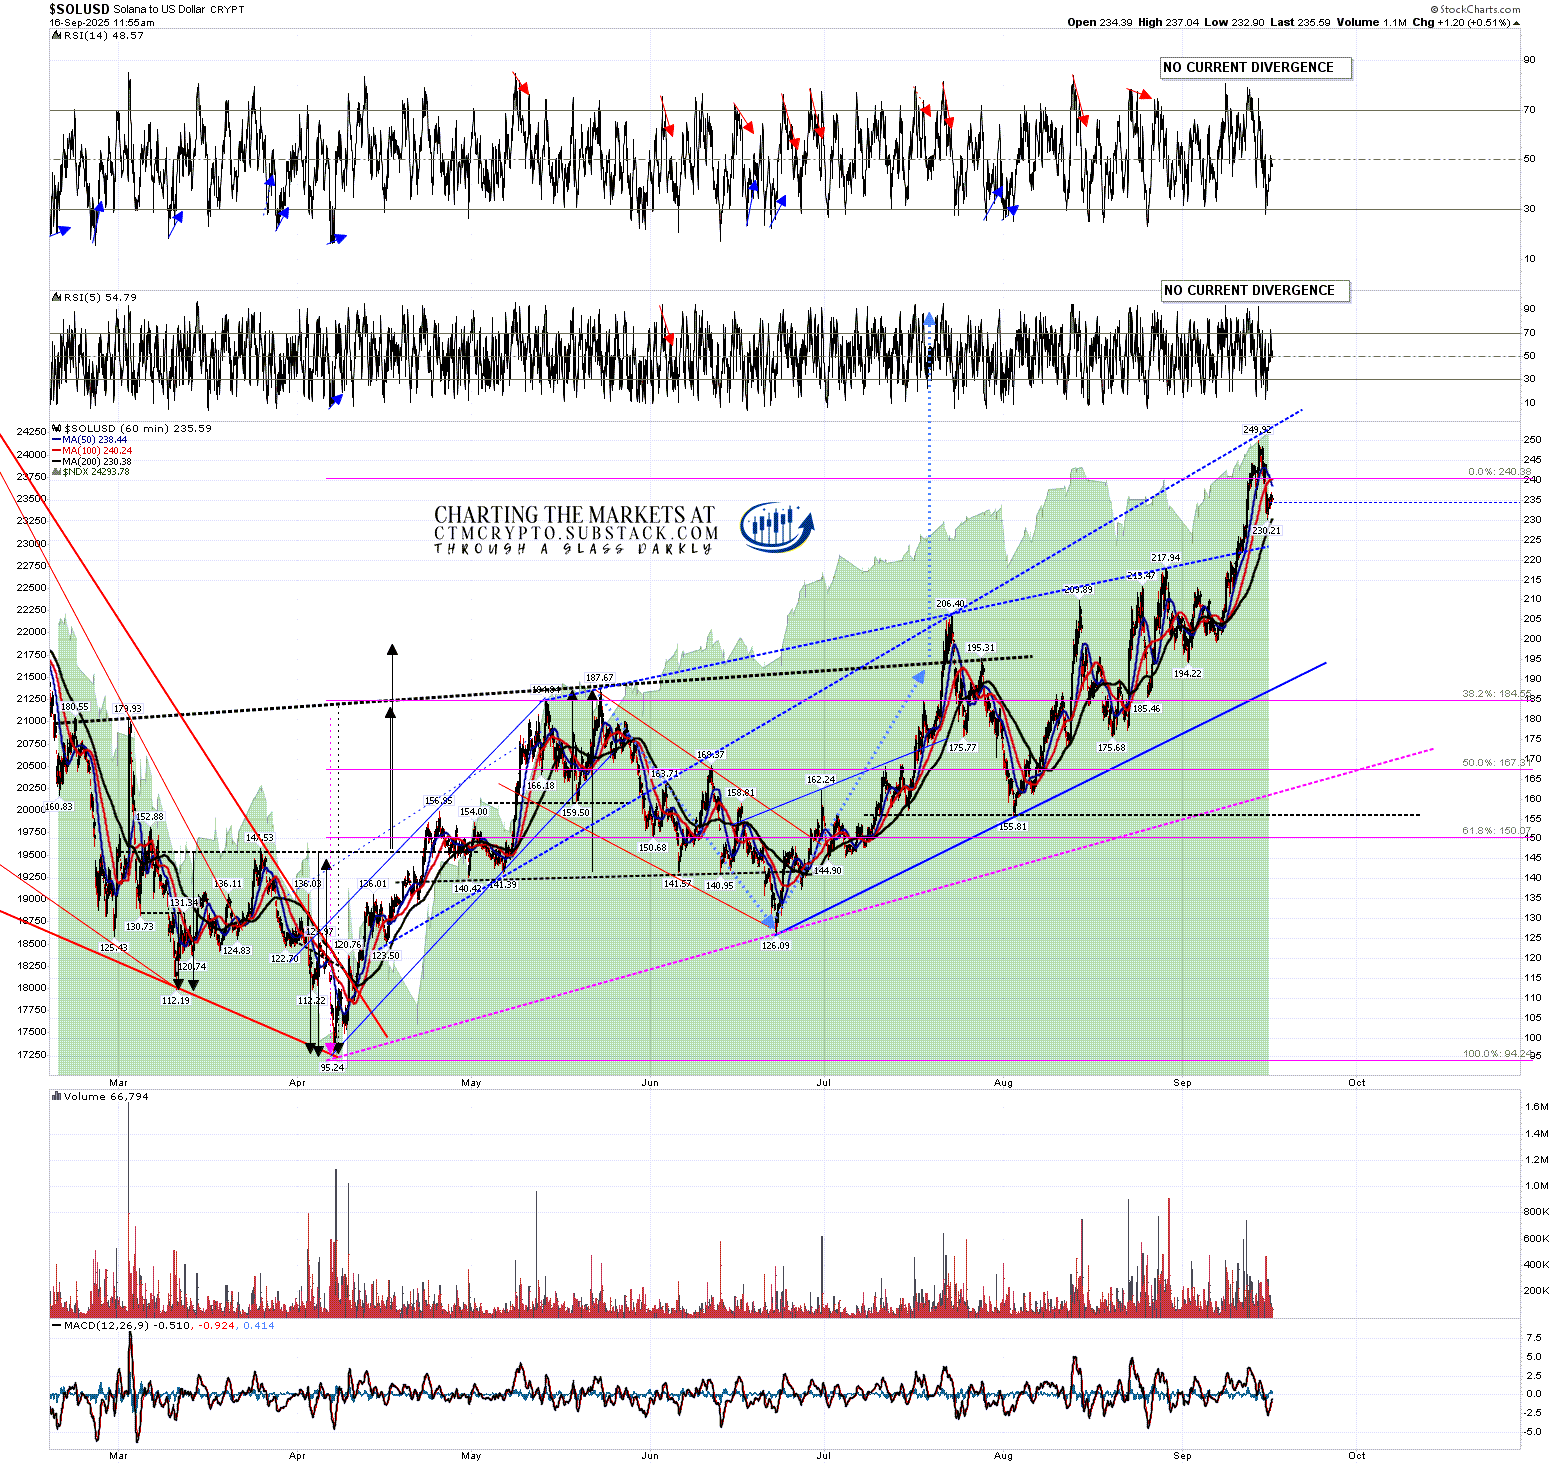
On the Solana hourly chart I marked in a possible shorter term resistance trendline, currently in the 252 area, that has not yet been hit and there is no obvious topping action at the current highs. We might see some retracement soon but I’m expecting to see the IHS target at 282 reached within weeks and then likely a follow through into a full retest of the all time high at 294.95 not long after that.
SOLUSD 60min chart:
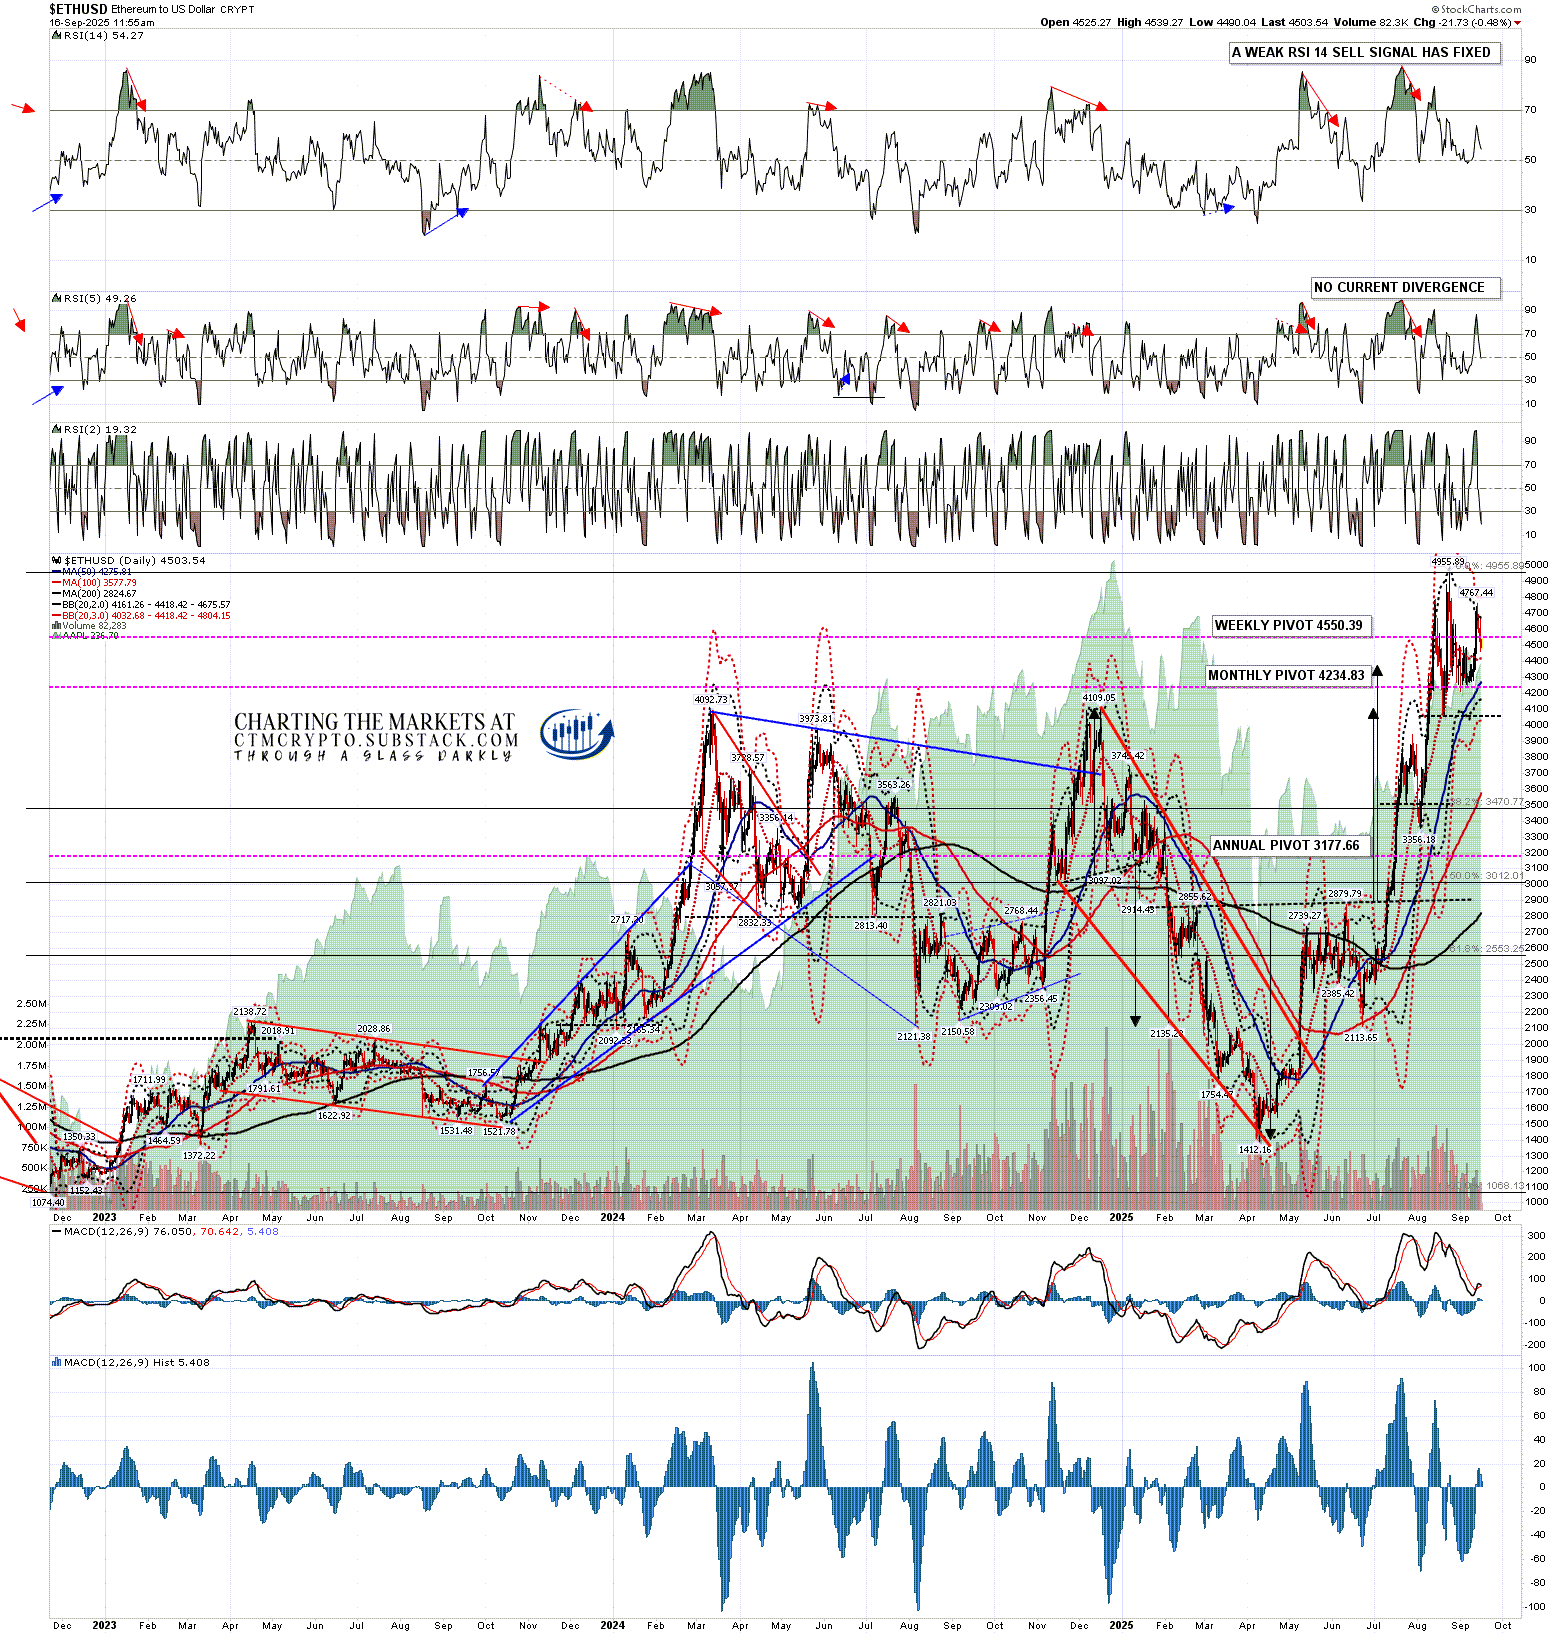
On the Ethereum daily chart we’ve been seeing some consolidation in recent weeks after the IHS target was hit and then a new all time high was made. As and when that consolidation ends I’m looking higher. As with Bitcoin there is a possibility that we may be looking at a part formed ABC bull flag here that may need a C wave down below 4212.31.
ETHUSD daily chart:
I’m keeping an open mind on short term direction here but historically the lean after today on equities is bearish into the end of September, and Crypto may well retrace somewhat with equities in that period.
I posted the following note at the end of my post on 13th Jan:
My preferred scenario here is that we see a bullish consolidation either now or soon on Crypto that takes a few months and sets up the next big leg up on Crypto into a possible bull market high in late 2025.
On this scenario we should soon start another leg up into a possible bull market high around December.
Since I started doing daily videos on Crypto early last year I’ve got Crypto direction right most of the time and more so than any other analyst anywhere that I’m aware of. I’m a very good analyst and all three of these instruments are very classical chartist friendly. I’m not much of a marketer though, and the free Crypto substack I set up last August still has less than 200 readers. I’d like to increase that readership and invite any suggestions on how I could do that.
I am thinking about setting up a second YouTube Crypto channel and recording videos giving likely market direction without requiring the viewers to have some knowledge of technical analysis to understand the videos. Comments on that and other suggestions very welcome. I’ll likely start publishing videos on that project before the end of the month.
If you’d like to see more of these posts and the other Crypto videos and information I post, please subscribe for free to my Crypto substack. I also do a premarket video every day on Crypto at 9.05am EST. If you’d like to see those I post the links every morning on my twitter, and the videos are posted shortly afterwards on my Youtube channel.
No comments:
Post a Comment