
In my last post on the morning of September 3rd, just after the sharp decline on the first trading day of this month, I was noting buy signals on all six of the hourly equity index futures charts that I follow, and those all delivered over the remainder of that week. When four or more of these fix at once on the hourly futures they generally deliver.
In my the Bigger Picture video on Sunday 7th September I was noting the strongly bullish leaning historical stats for the coming week and was suggesting a target for QQQ at a retest of the August all time high at 583.32, and we saw that with a new all time high at 587.86, seeing also new all time highs on SPX and DIA, and IWM moving closer to the IHS target at a retest of the Nov 2024 all time high at 243.04.
I’m still expecting that all time high retest on IWM in coming weeks and there is a chance that we might see that this week, but the historical stats from tomorrow’s close through to the end of September lean strongly bearish, so I’m thinking that we will likely see at least a few days of retracement or consolidation then.
Today the historical stats lean neutral, though I’d note that at the time of writing there are hourly sell signals fixed on both ES and NQ, so I’m leaning towards seeing at least some weakness today. If that can persist into a clear red close on most of the US equity indices today that would be ideal because …….
Tomorrow the historical stats lean strongly bullish, and if we see a red close today, then a retest of the current highs tomorrow could set up some daily RSI 5 sell signals, which would be a nice clear signpost for impending weakness.
Over the rest of October there are then clearly bearish leaning days on Friday 19th, Monday 22nd, Tuesday 23rd, Thursday 25th, with a single bullish leaning day on Friday 26th before a last clearly bearish leaning day on Tuesday 30th September, also the last trading day of September. This is the last strong series of bearish leaning days this year.
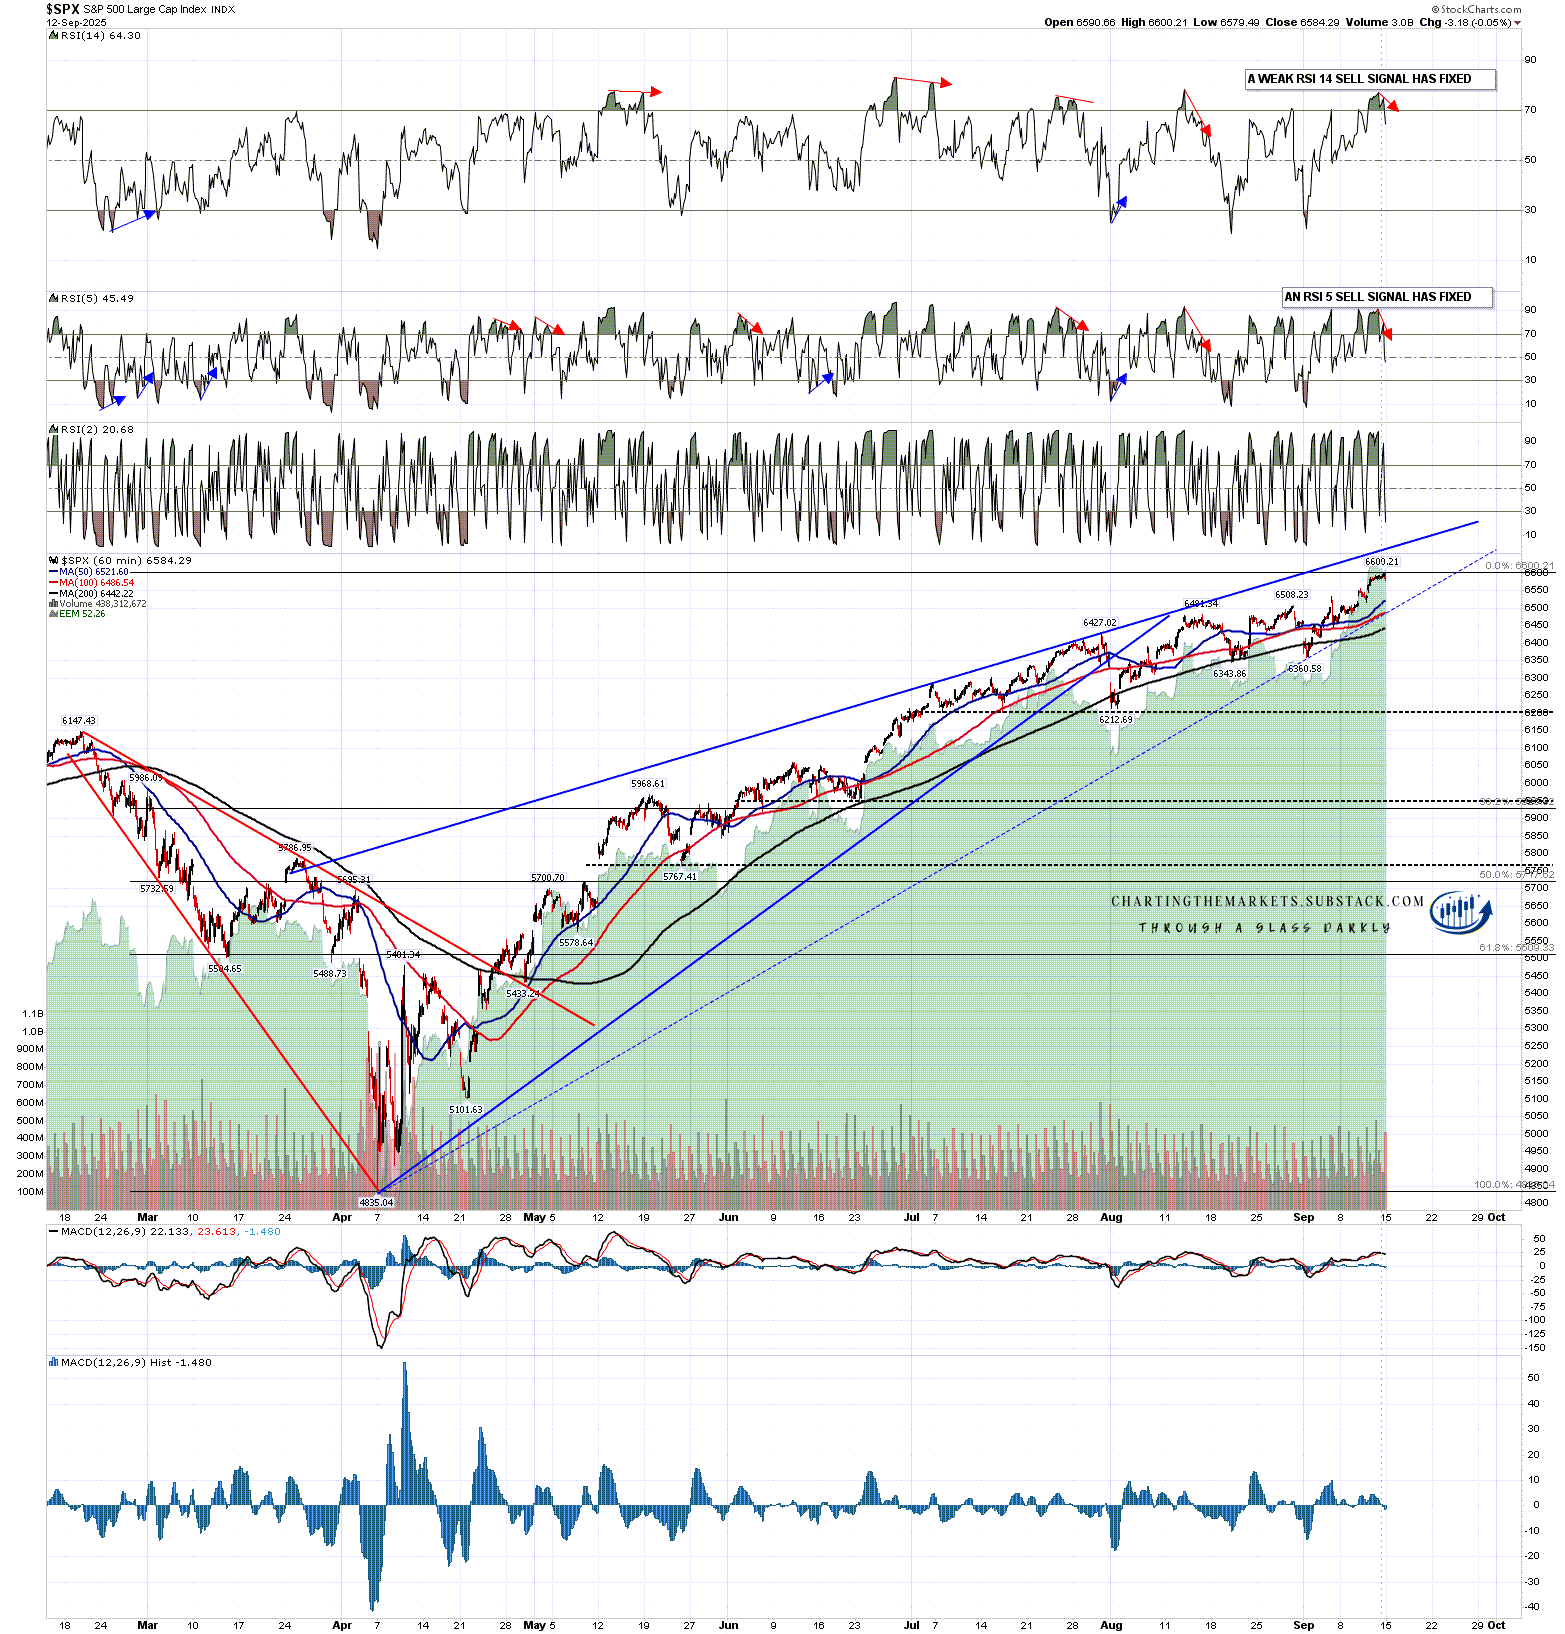
Looking at the US indices SPX is still under my main resistance trendline, which I currently have in the 6660-70 area. That looks like a long shot to reach by tomorrow’s close but if we do see that then I’d be looking for resistance there. No obvious reversal pattern and hourly sell signals have fixed on both RSI 14 and RSI 5 that may deliver today.
SPX 60min chart:
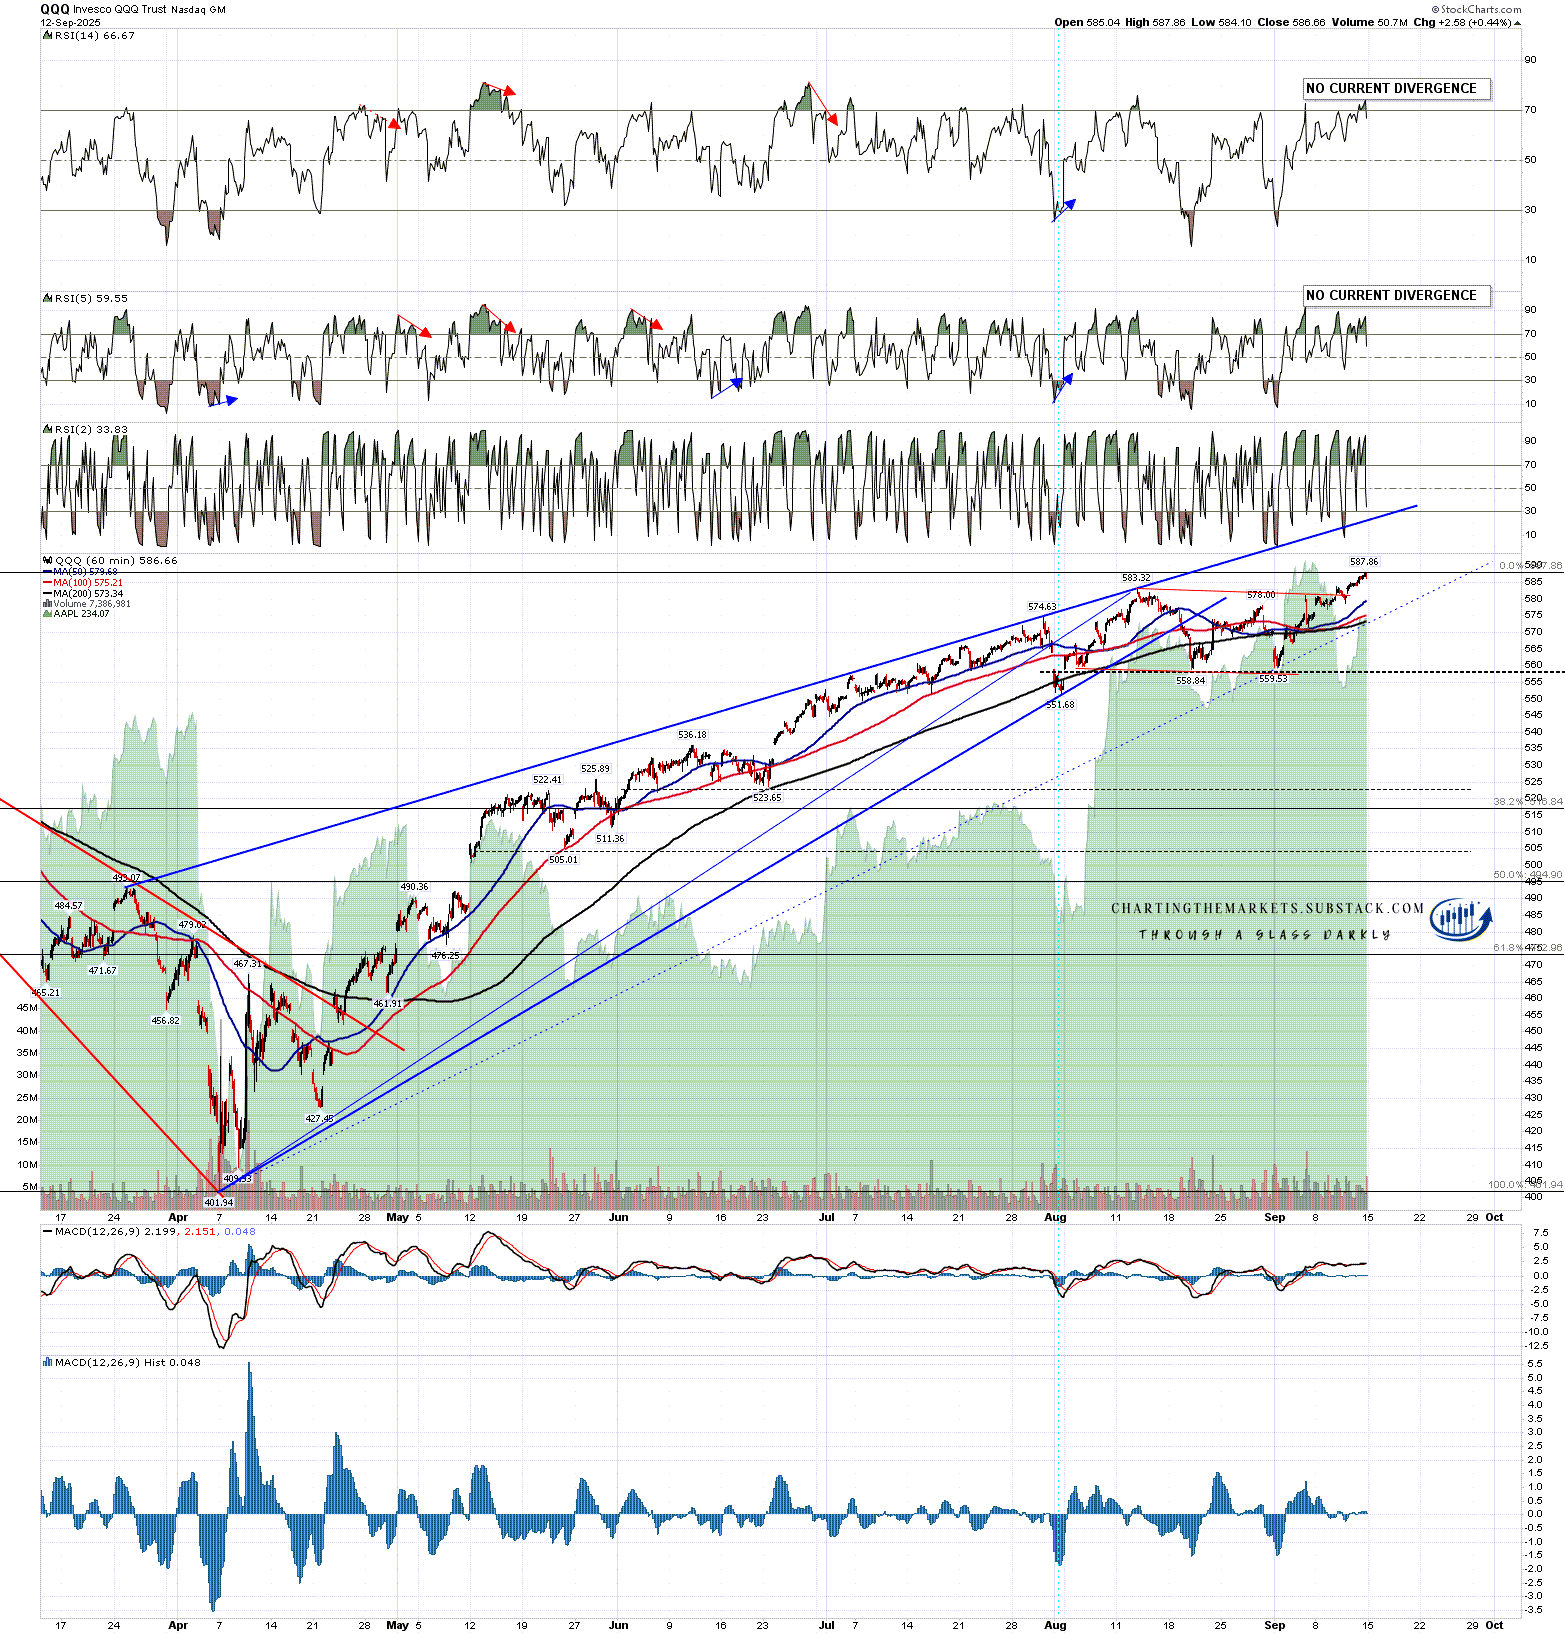
QQQ finally reached the retest of the August high after breaking up from the bull flag channel last week and there is currently a decent quality double top in place. I’m not currently seeing main trendline resistance as a viable target for this week but currently have that in the 603 area.
QQQ 60min chart:
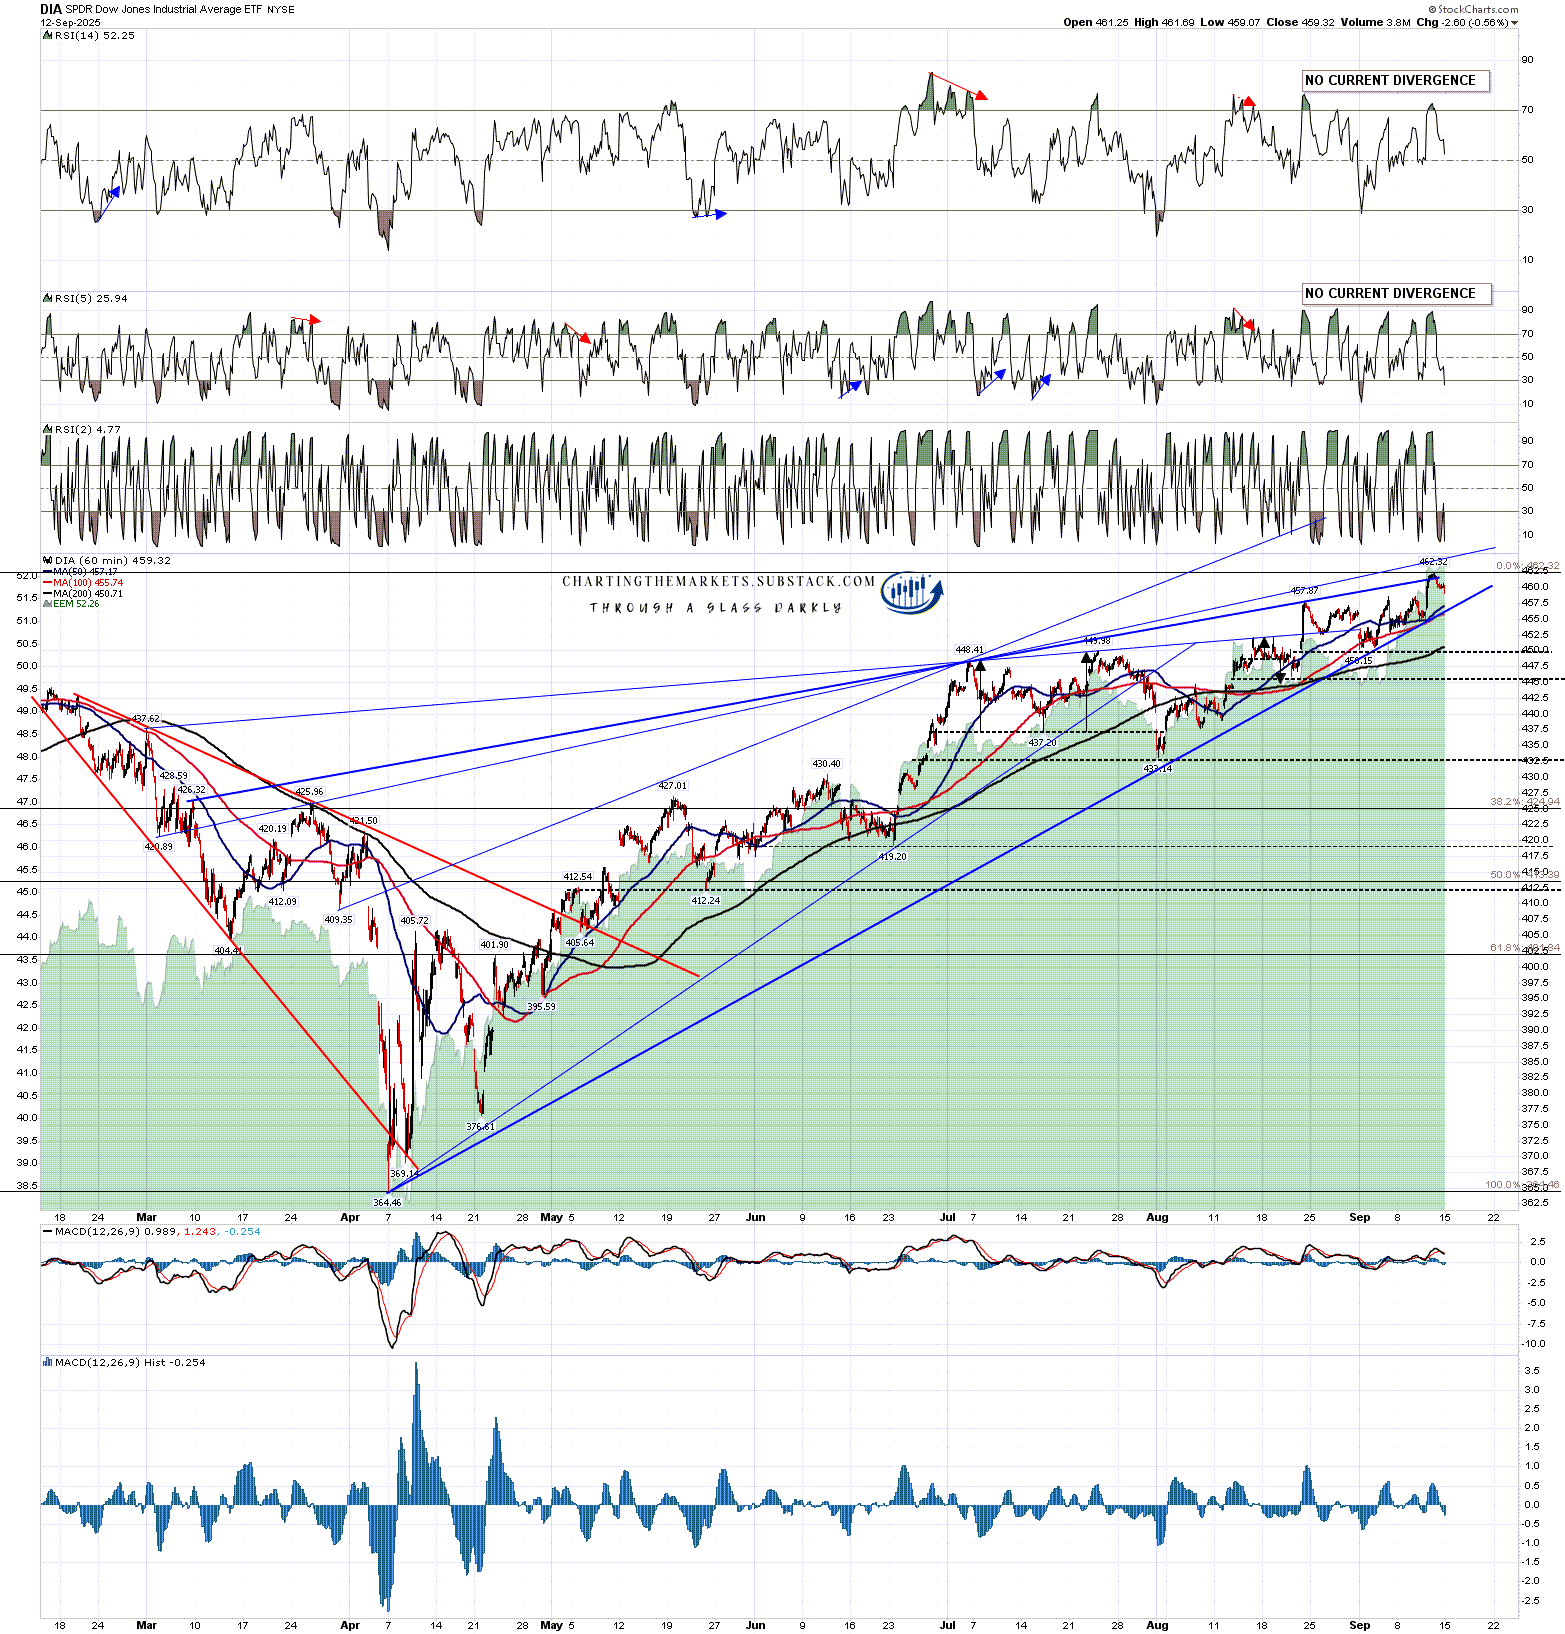
DIA slightly broke over the main resistance trendline there at the high last week but I have an alternate and slightly higher quality alternative now in the 465 area that I’m thinking may replace that in coming weeks.
DIA 60min chart:
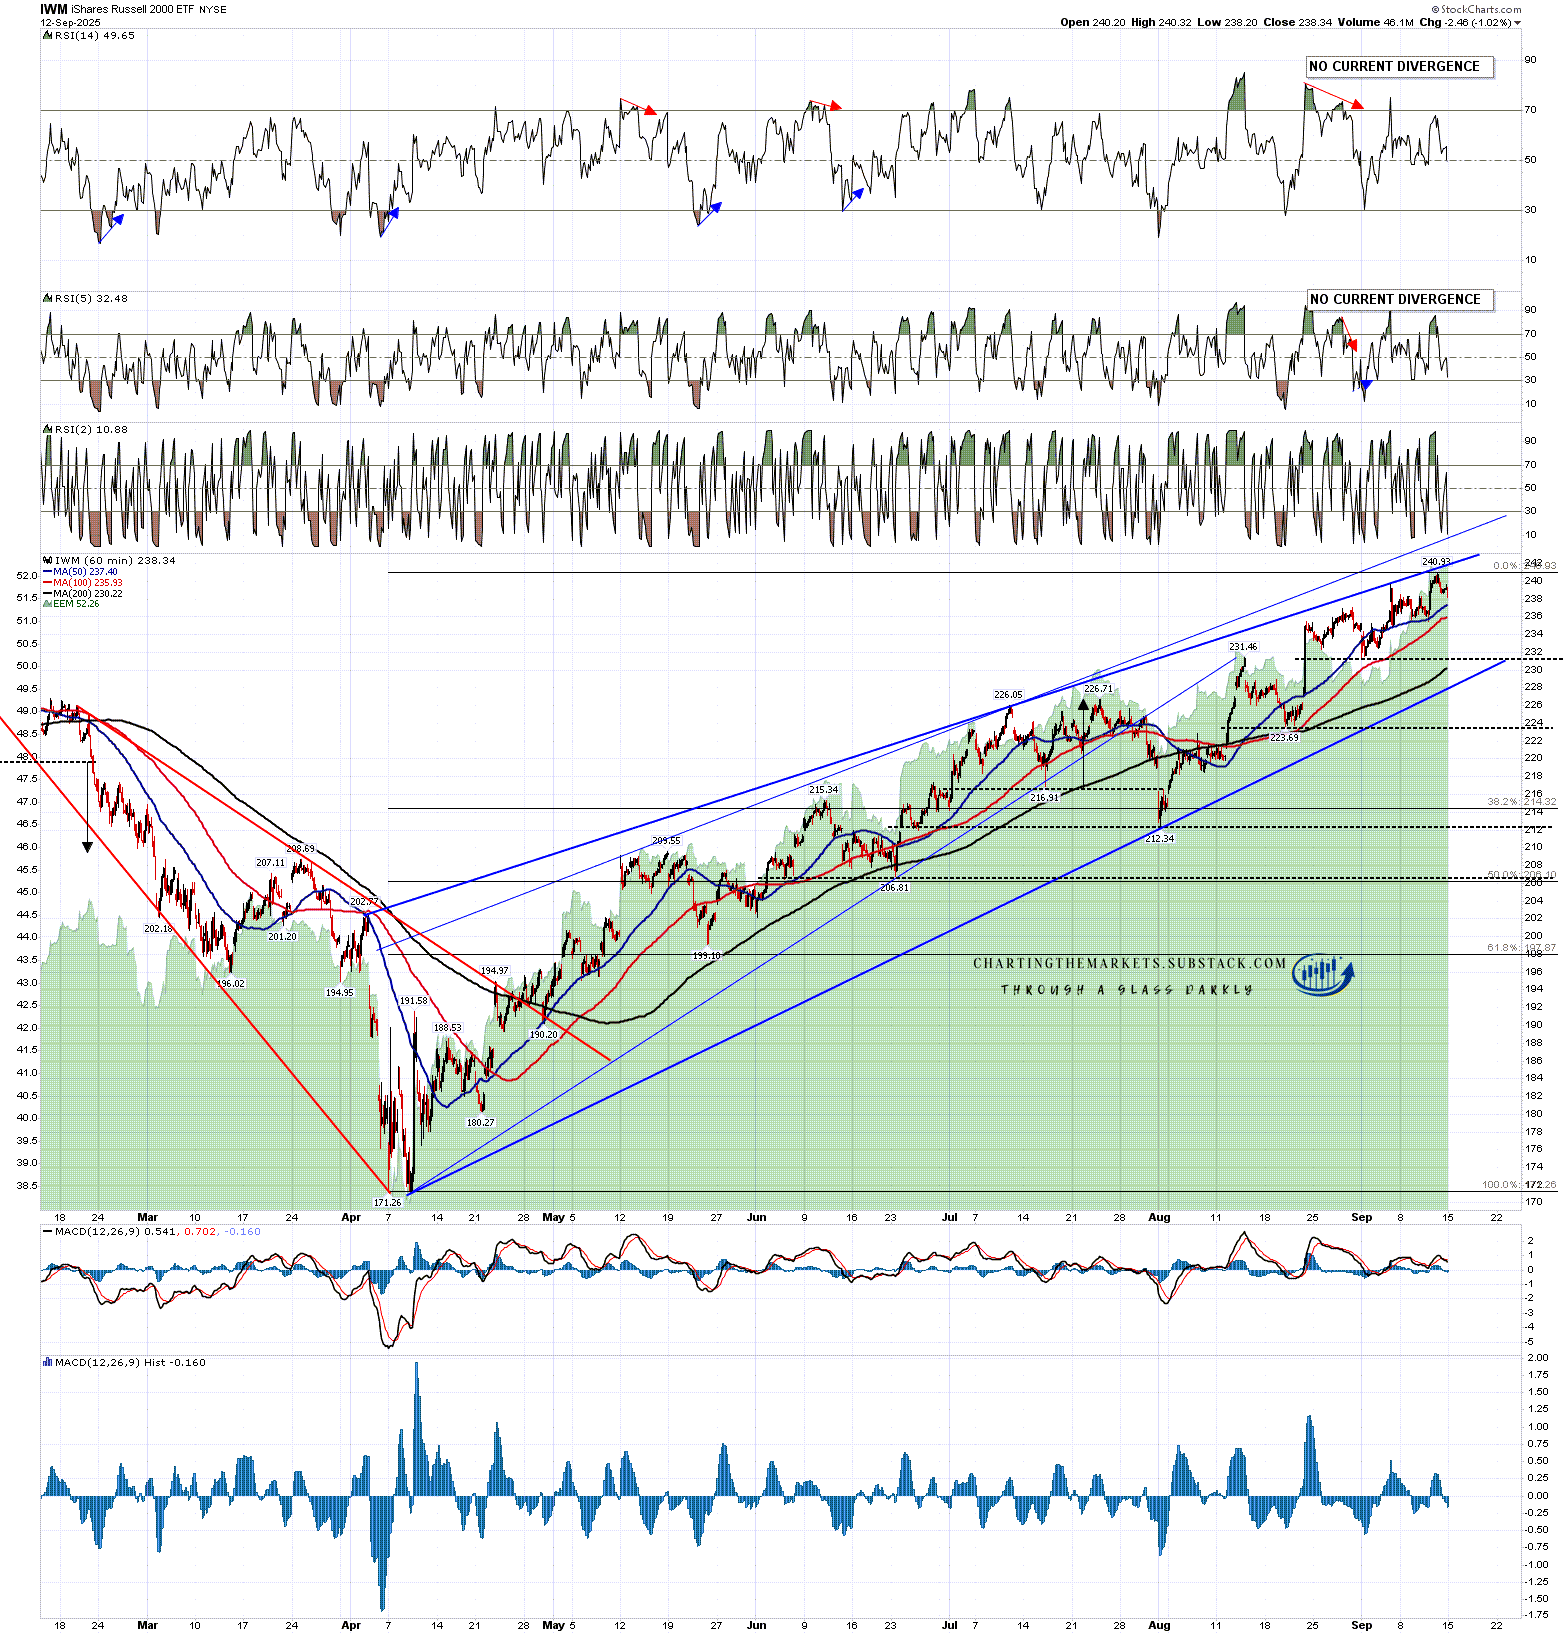
IWM is only slightly below the main resistance trendline there, currently in the 242 area. I have a possible alternate resistance trendline drawn not far above, but that’s of lower quality.
IWM 60min chart:
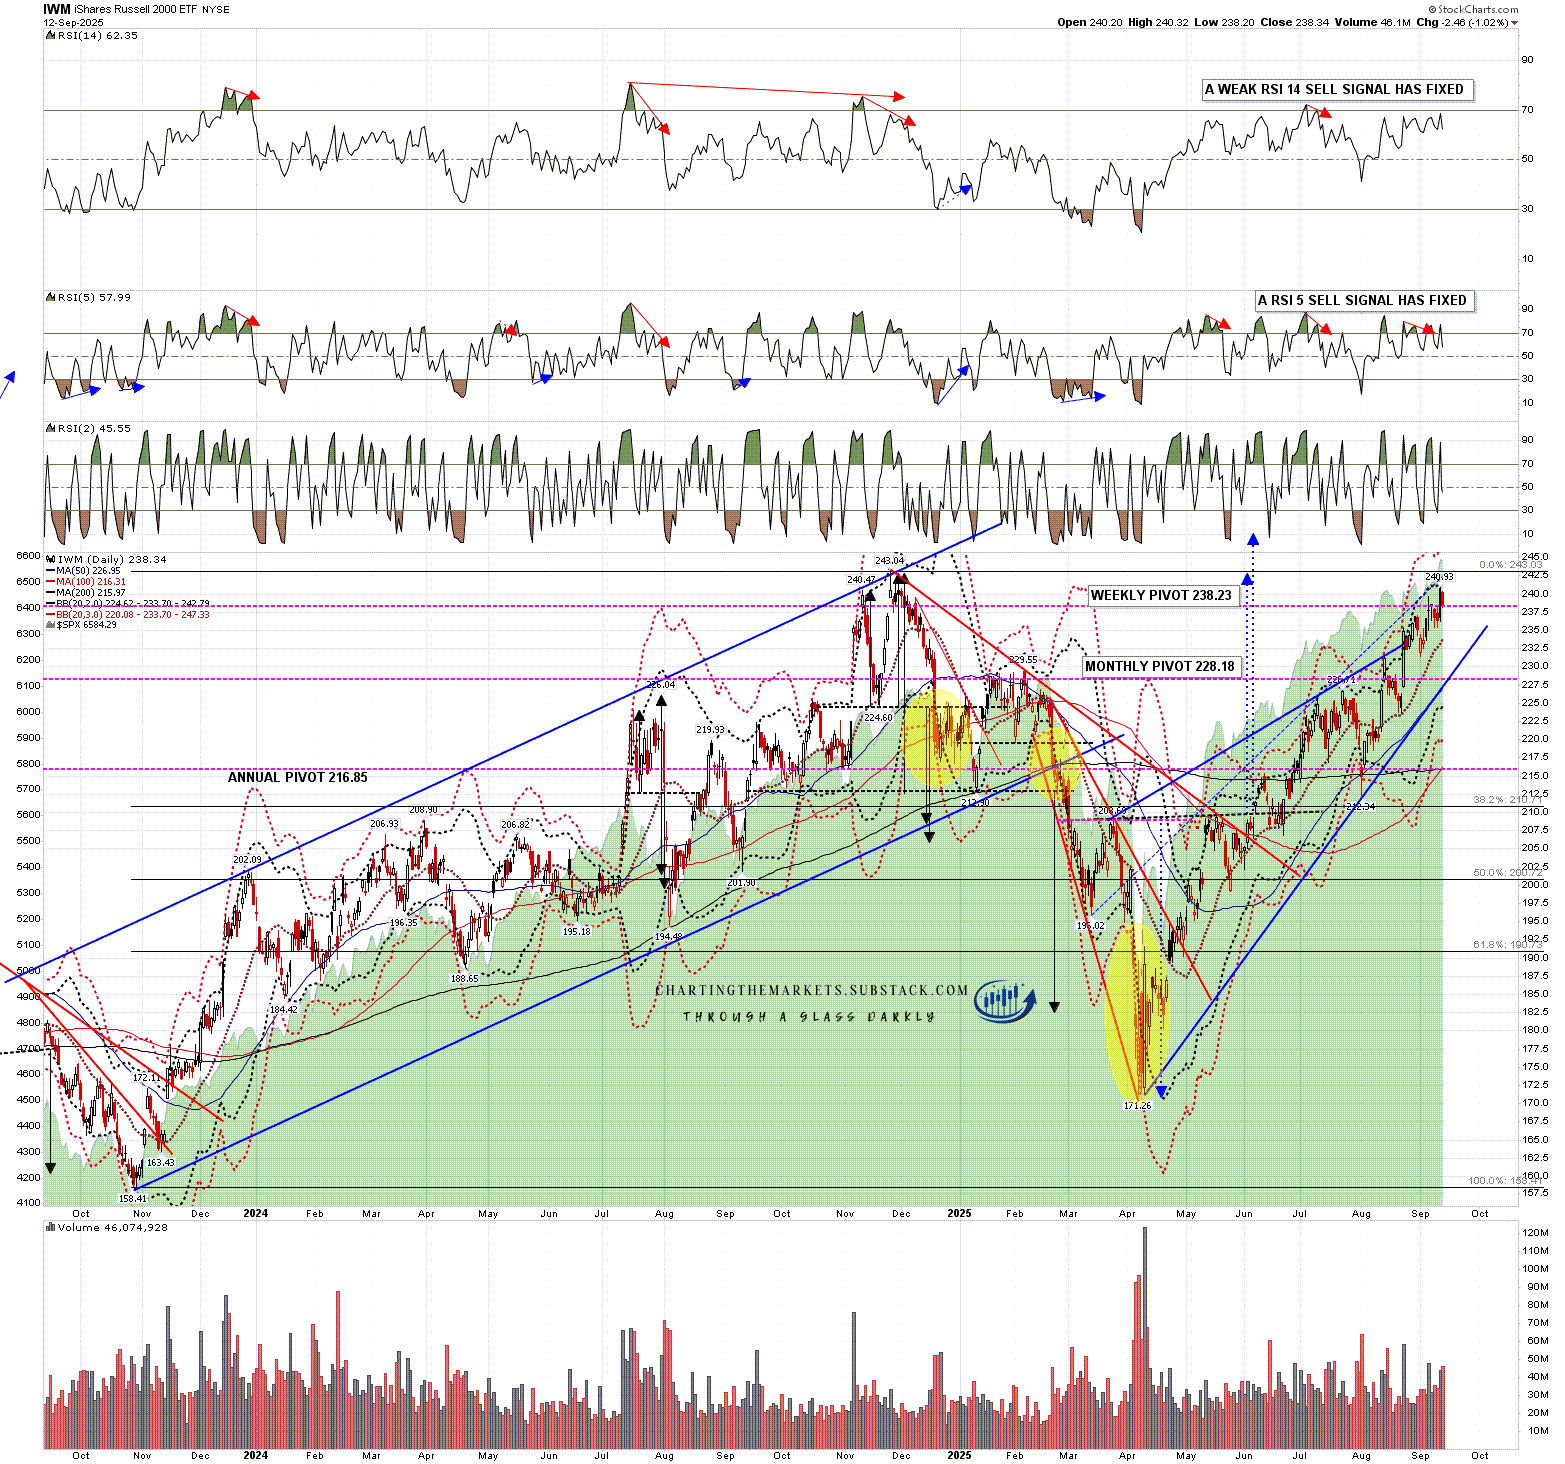
Over three months ago on 3rd June I wrote a post laying out a bullish scenario on US indices that might play out over the remainder of the year and on IWM I showed a possible IHS scenario that could take IWM back up into a retest of the all time high.
That IHS broke up soon after and came close to reaching the target at the retest of the November 2024 all time high at 243.03 last week. I’m expecting that to make target over the next few weeks and it is possible that could be reached tomorrow if the historically bullish stats deliver hard.
IWM daily chart:
In my post on 18th August I said that:
What are the odds that all four of these indices are topping out for that overdue decent retracement here? Pretty good in my view, and at minimum a period of consolidation is likely here to create some space between price and these rising resistance trendlines.
Obviously we saw the minimum period of consolidation after that with a modest break higher last week. I’d still like to see a larger retracement but the setup to see that directly from here is weak. We’ll see what happens over the next few days, and it may be that we will start to see a stronger topping setup develop. If so we might still see a decent retracement in October, which is a strong month for those historically. I’ll keep an open mind and call out any decent patterns that form.
If you like my analysis and would like to see more, please take a free subscription at my chartingthemarkets substack, where I publish these posts first. I also do a premarket video every day on equity indices, bonds, currencies, energies, precious commodities and other commodities at 8.45am EST, but only for paying subscribers. Other places to find me are my twitter, and my Youtube channel.
No comments:
Post a Comment