
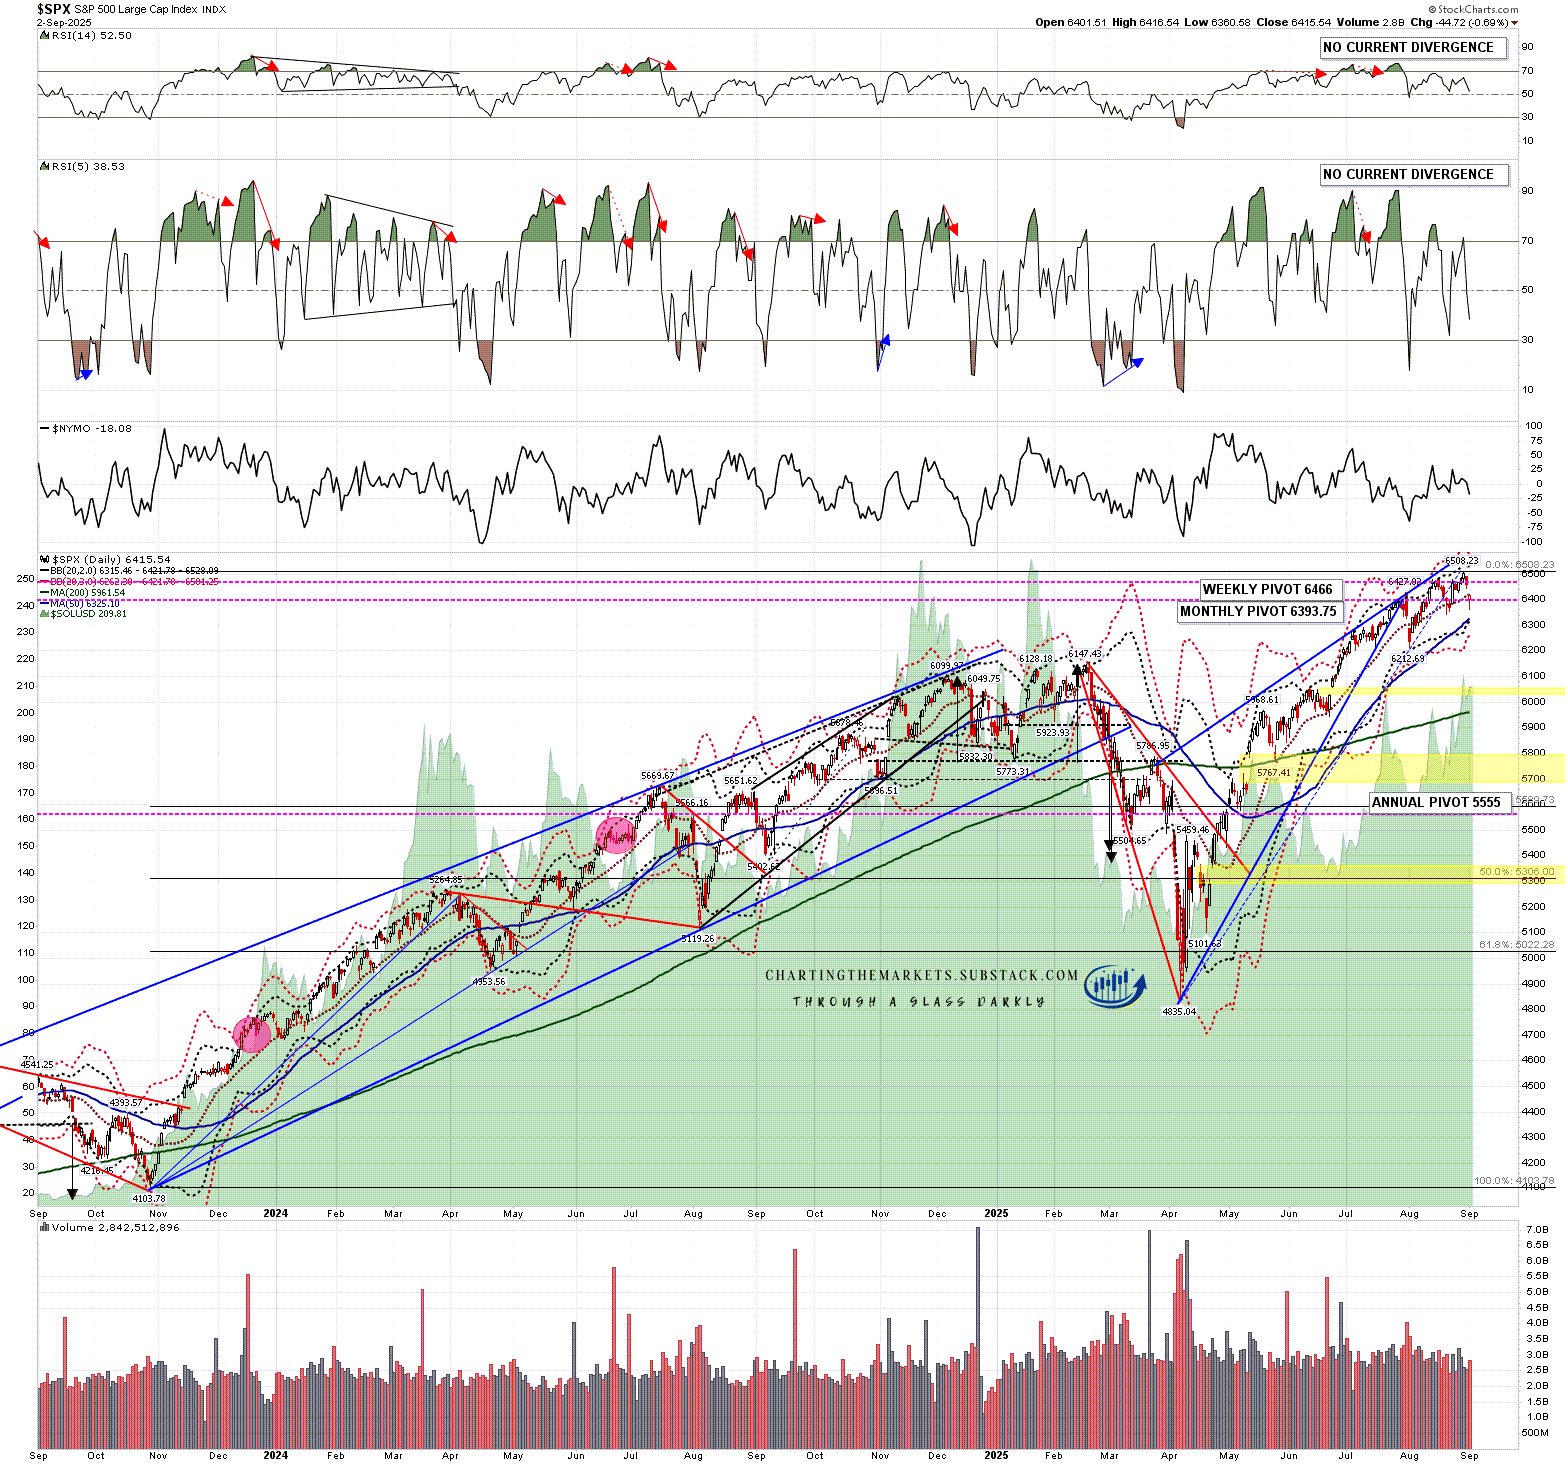
September is the weakest month of the year historically on SPX, and started yesterday with a significant show of weakness, with SPX gapping below the daily middle band and closing below it. This is the third close below the daily middle band in the last few weeks and, as with the other two, we may see a rejection back up into another marginal higher high, but these are significant signs that SPX may be topping out for at least a larger retracement here.
SPX daily chart:
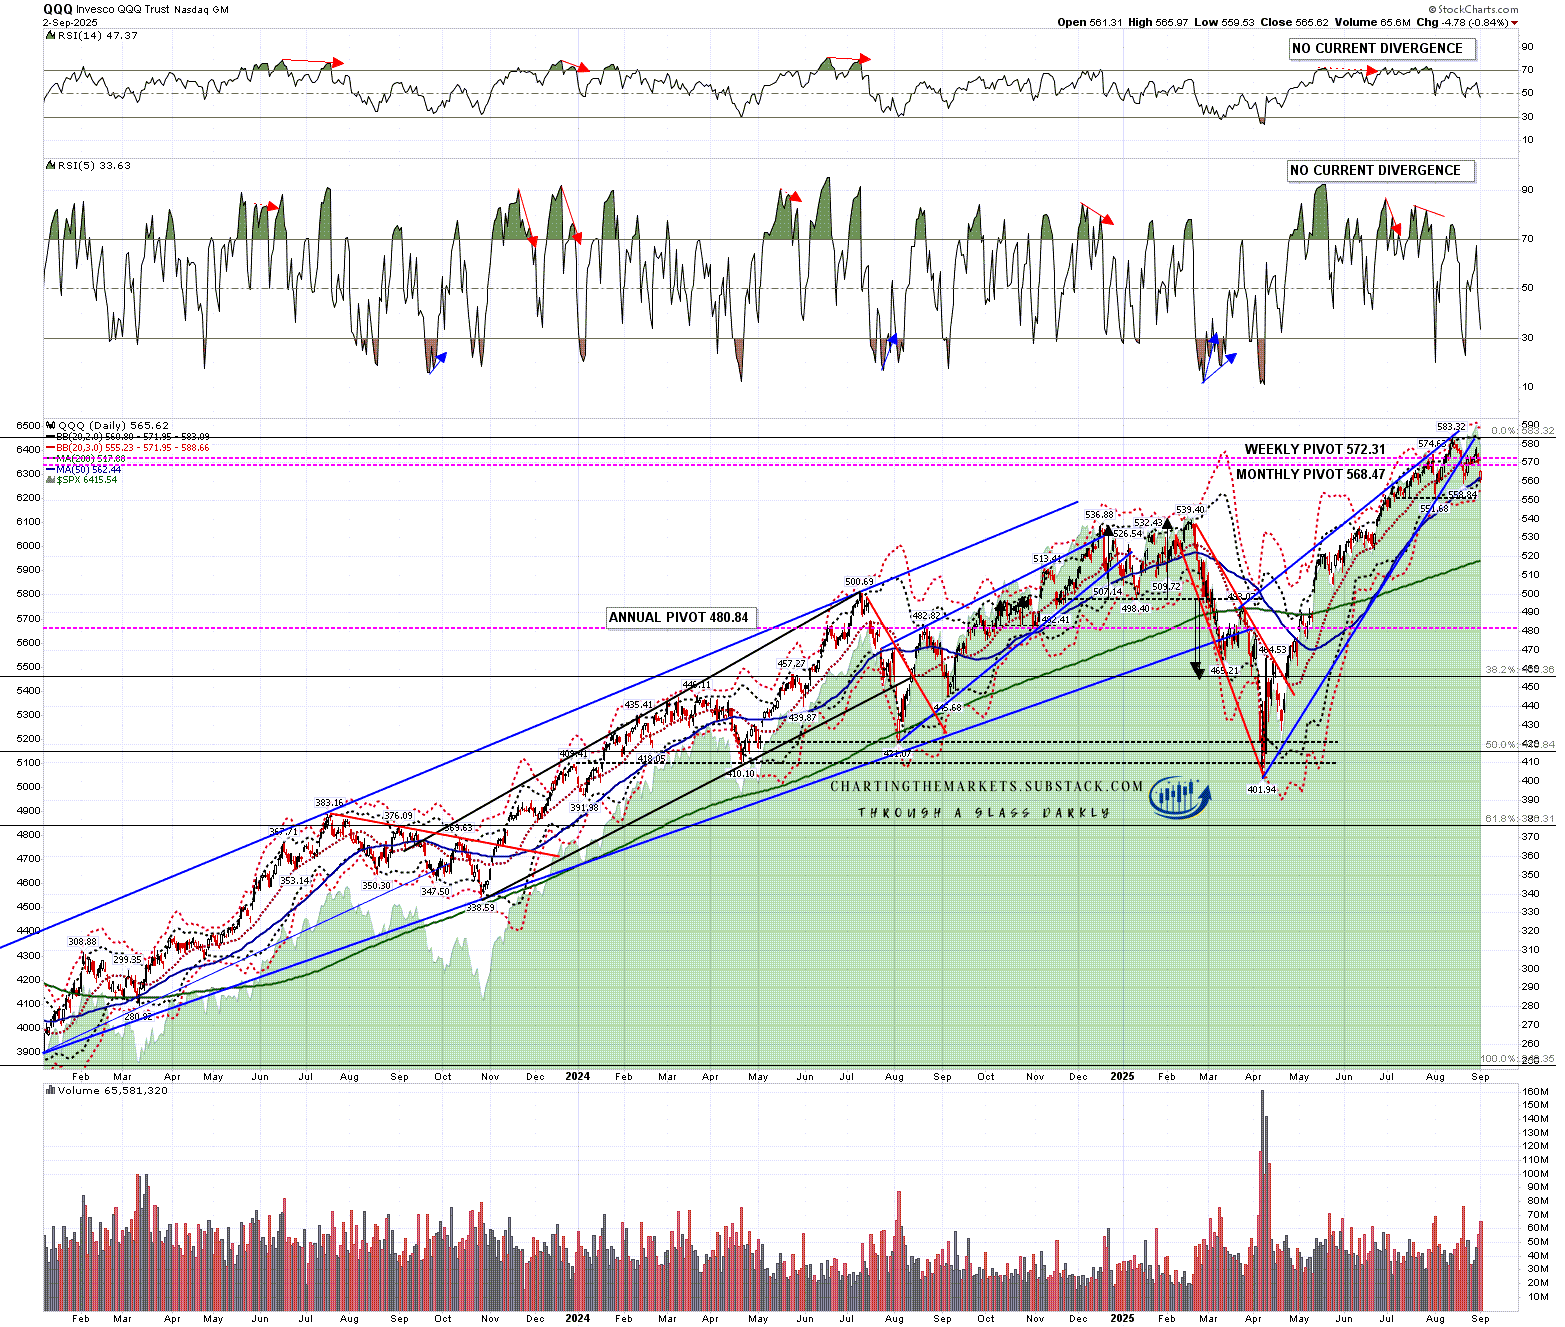
I was noting in my The Bigger Picture video on Monday that QQQ was testing the daily middle band as support all of last week and mentioned that a trading friend had mentioned to me many years ago that the more often an index knocked on a support or resistance door, the more likely that door was to open, and yesterday QQQ broke down hard through the middle band and tested the 50dma for the first time since the break above after the April low.
QQQ daily chart:
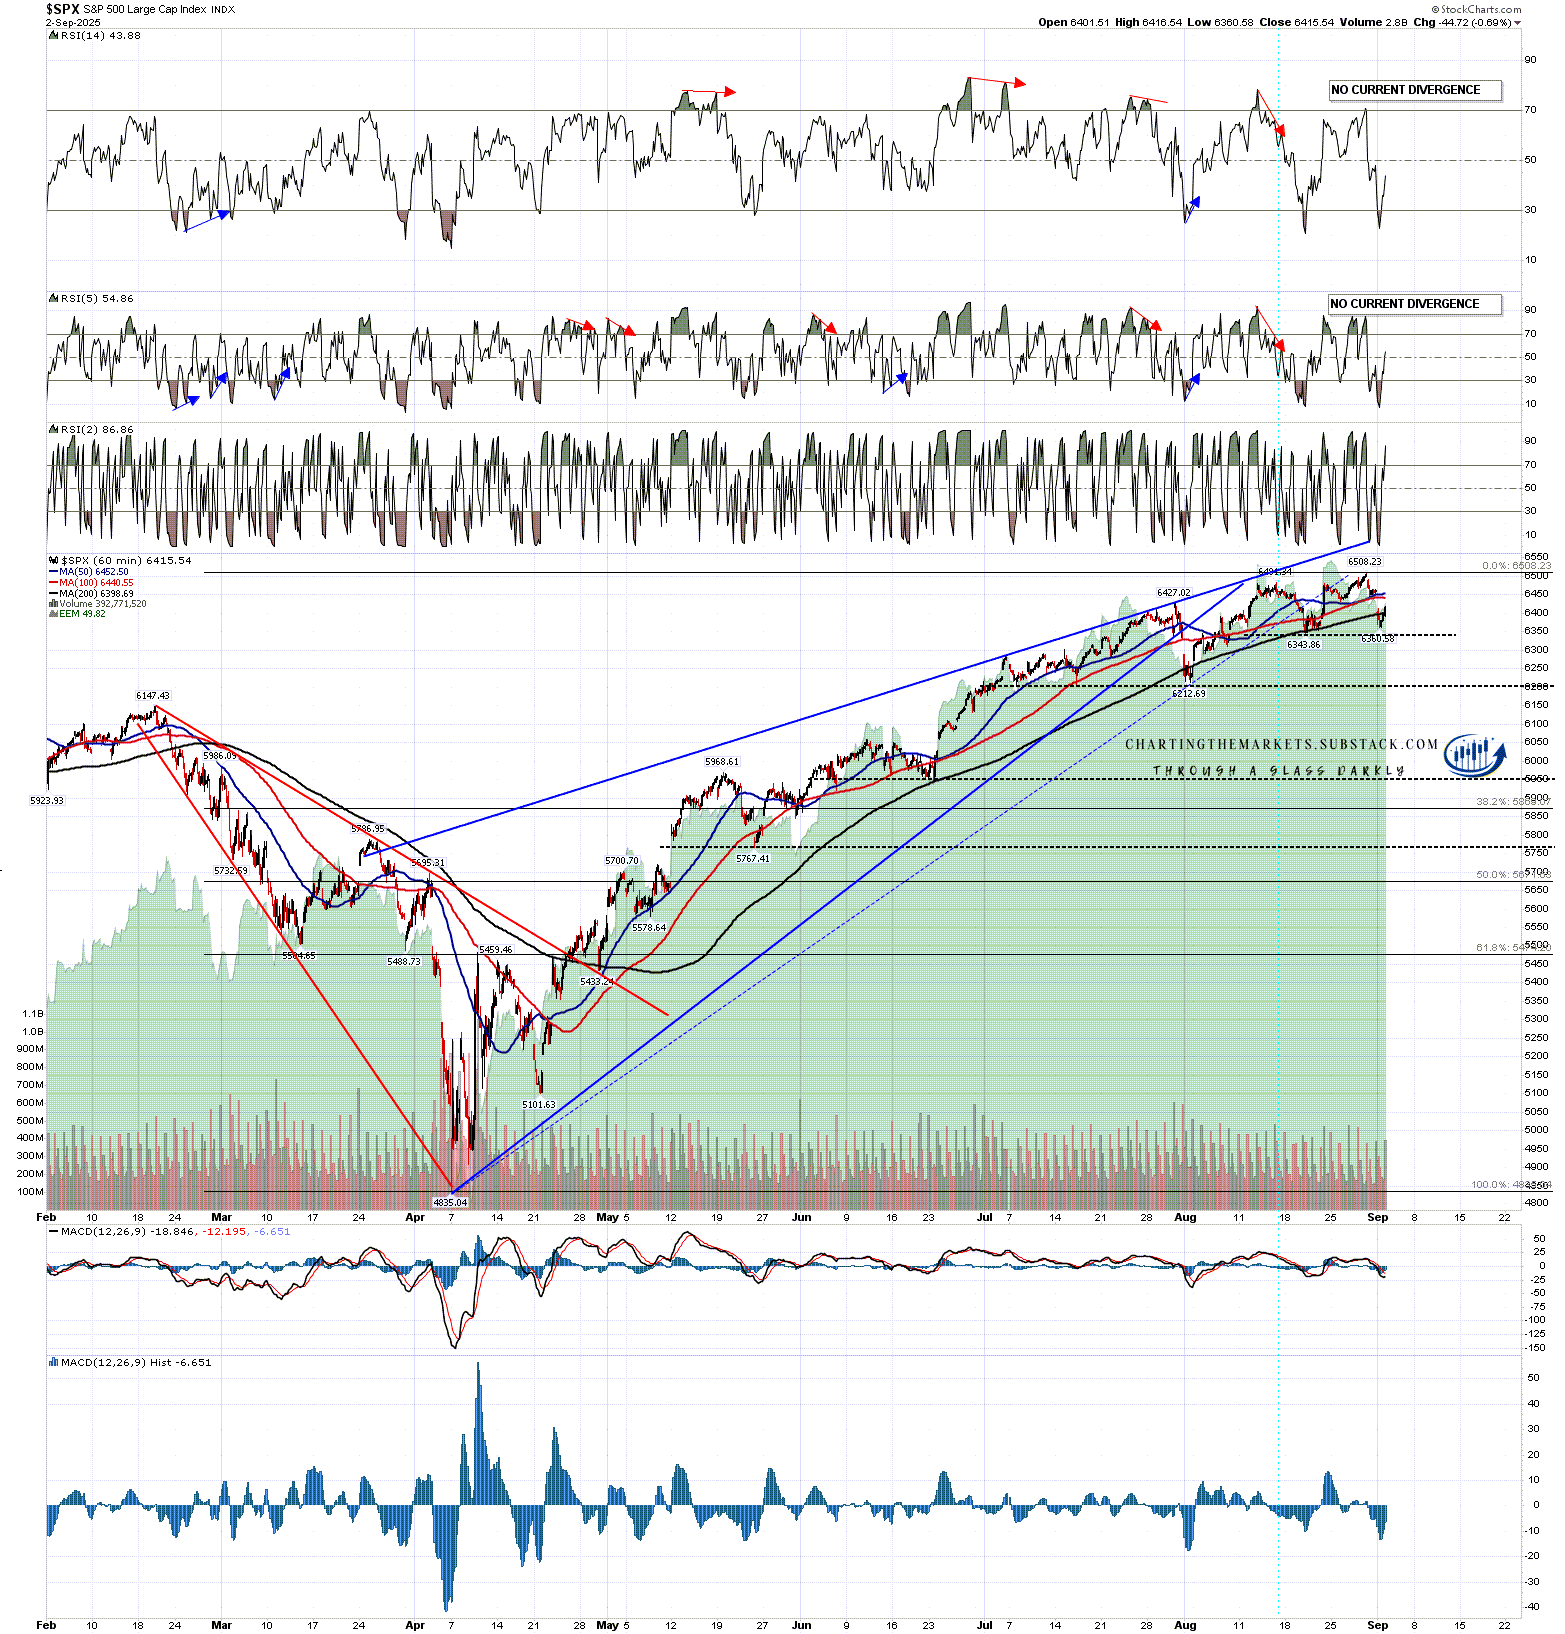
In my post on Thursday 7th August I was looking at the rising wedge resistance trendlines on SPX, QQQ and DIA, and that resistance trendline on SPX hasn’t been broken since. That rising wedge has broken down and there is a very nice looking little double top setup that didn’t break down yesterday.
There is a possible larger H&S forming here with the neckline in the 6212.69 area.
SPX 60min chart:
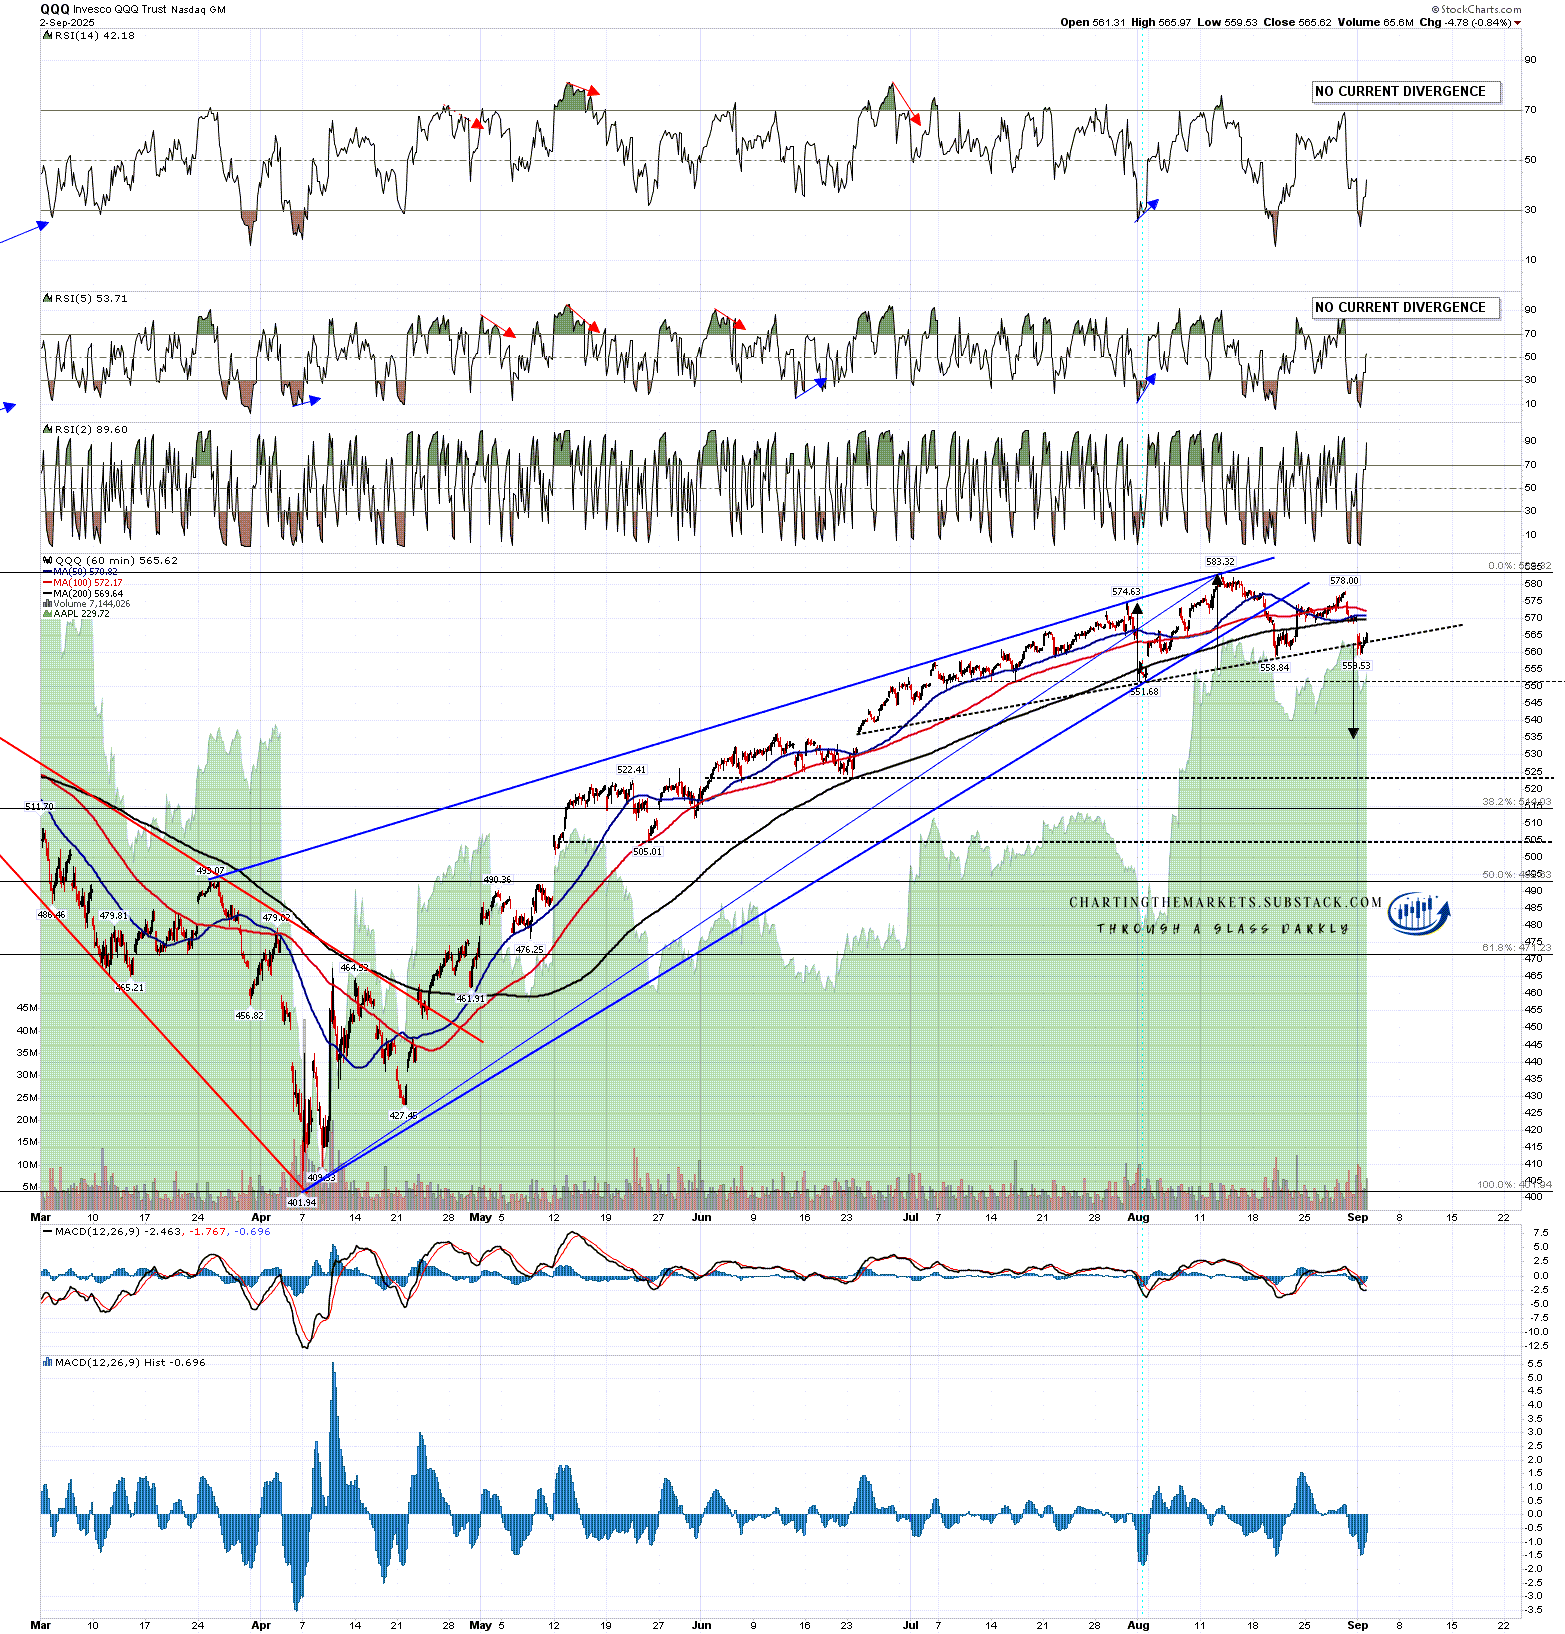
The rising wedge resistance I showed on QQQ has also held since and that rising wedge has also broken down. I’ve been watching a possible little H&S over the last few days and that broke down yesterday with a target in the 535 area.
QQQ 60min chart:
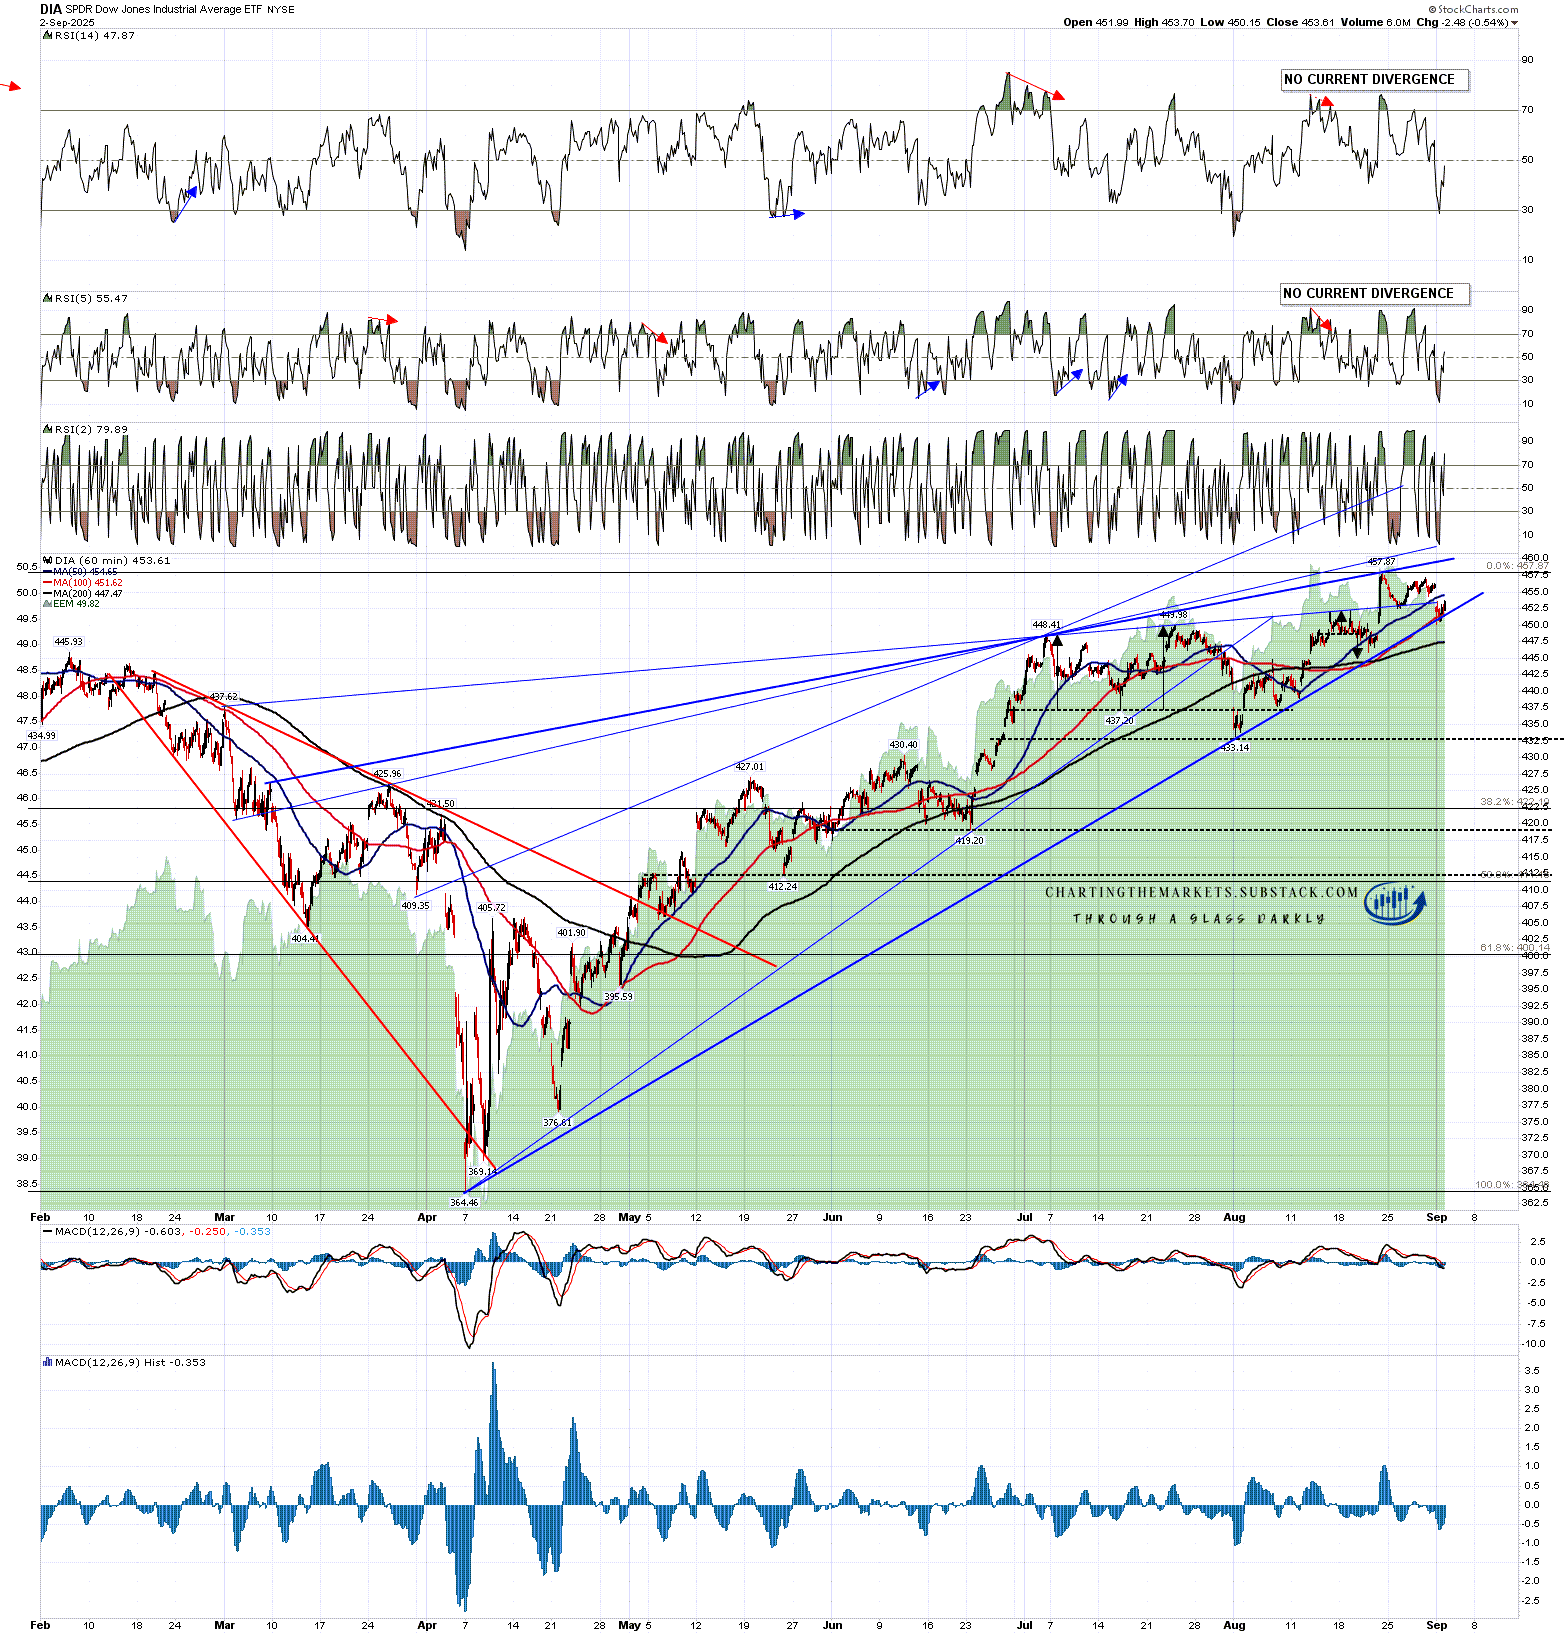
On DIA that rising wedge broke up into an alternate resistance trendline, and that updated rising wedge broke down yesterday. There is no short term topping pattern here but there is a possible larger H&S pattern forming with the neckline in the 432.50 area.
DIA 60min chart:
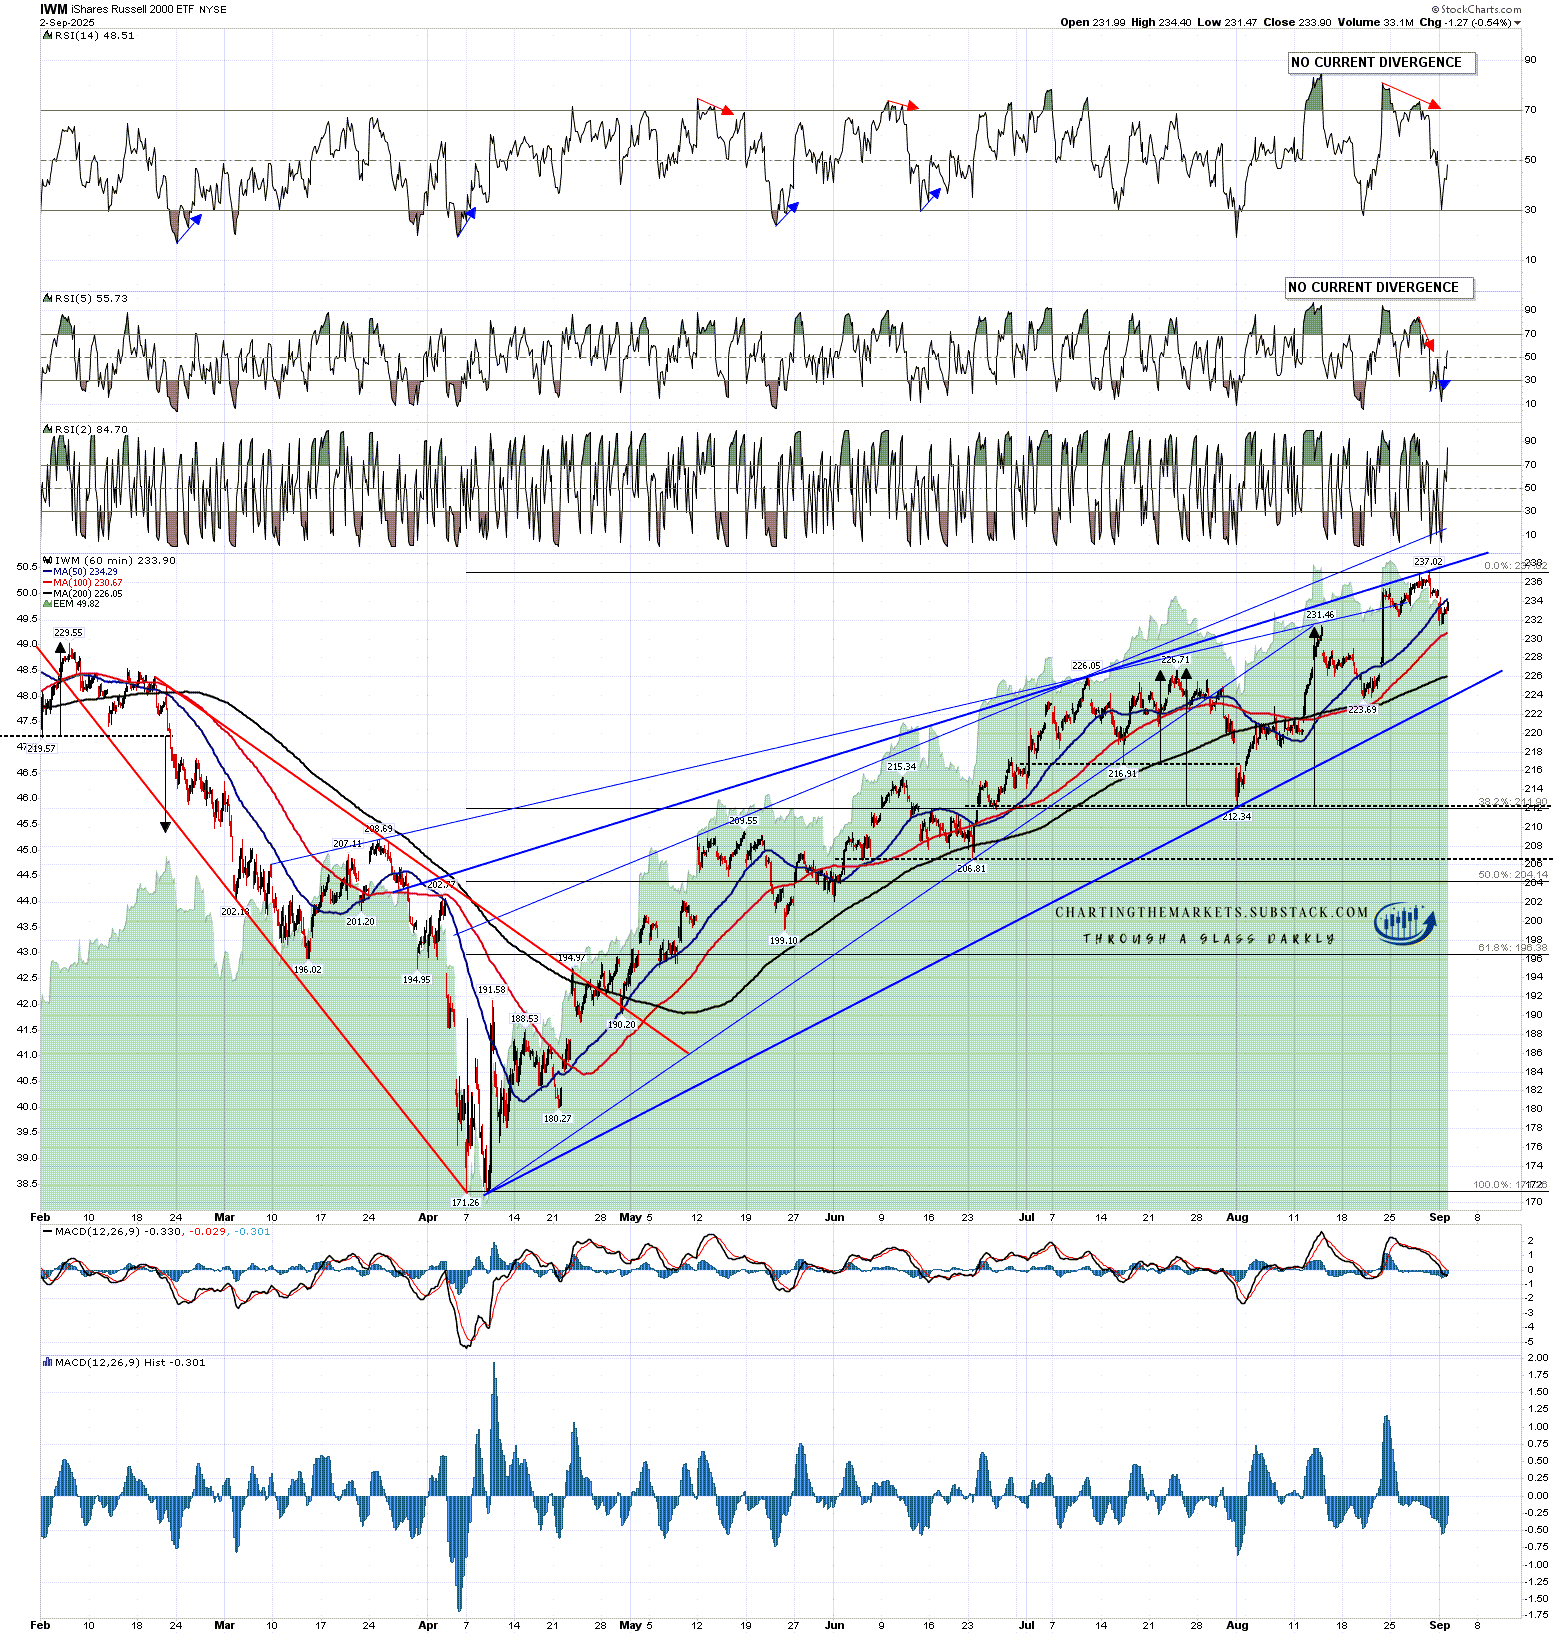
On IWM the rising wedge resistance that I was looking at in my post on Wednesday 13th August also broke up into an alternate rising wedge resistance trendline and that updated rising wedge has not yet broken down. There are possible larger H&S patterns forming with possible necklines in the 223.69 and 212.34 areas. A daily RSI 5 sell signal fixed on IWM yesterday.
IWM 60min chart:
Overall all four of these US equity indices still look like they are topping out for a retracement, and the timing from here through October looks ideal for that.
Short term though I’d note that the current topping setup may need more high retests to set up retracement patterns and that hourly buy signals fixed on all of ES, NQ, RTY, YM, DAX and ESTX50 at the lows yesterday and, with ES up 29 at the time of writing from the close yesterday, none of those buy signals have yet reached their possible near miss targets. A small IHS has broken up overnight on ES with a target close to a retest of the all time high and a perfect bull flag channel has formed on YM that is strongly suggesting a high retest there.
In my post on 18th August I said that:
What are the odds that all four of these indices are topping out for that overdue decent retracement here? Pretty good in my view, and at minimum a period of consolidation is likely here to create some space between price and these rising resistance trendlines.
Obviously we’ve been seeing that minimum period of consolidation and I’m still very much liking the setup for a decent retracement here. If this does happen I’m thinking this would likely last four to eight weeks and resolve into another leg up on equities into the end of the year. If we do see that retracement here I’ll be watching to see whether bullish patterns form to support that.
I’m also watching for patterns and divergence suggesting immediate continuation higher. So far I’m not seeing anything significant but that is always a possibility of course.
If you like my analysis and would like to see more, please take a free subscription at my chartingthemarkets substack, where I publish these posts first. I also do a premarket video every day on equity indices, bonds, currencies, energies, precious commodities and other commodities at 8.45am EST, but only for paying subscribers. Other places to find me are my twitter, and my Youtube channel.
No comments:
Post a Comment