In my premarket video yesterday morning I was looking at the large number of short term sell signs across the equity indices and making the case for a modest retracement before going higher. We’ve seen that modest retracement and might go a bit lower, but a reversal back up directly from here may be seen instead.
There were three short term patterns on US indices that I was looking at yesterday morning, including double tops on SPX and Dow.
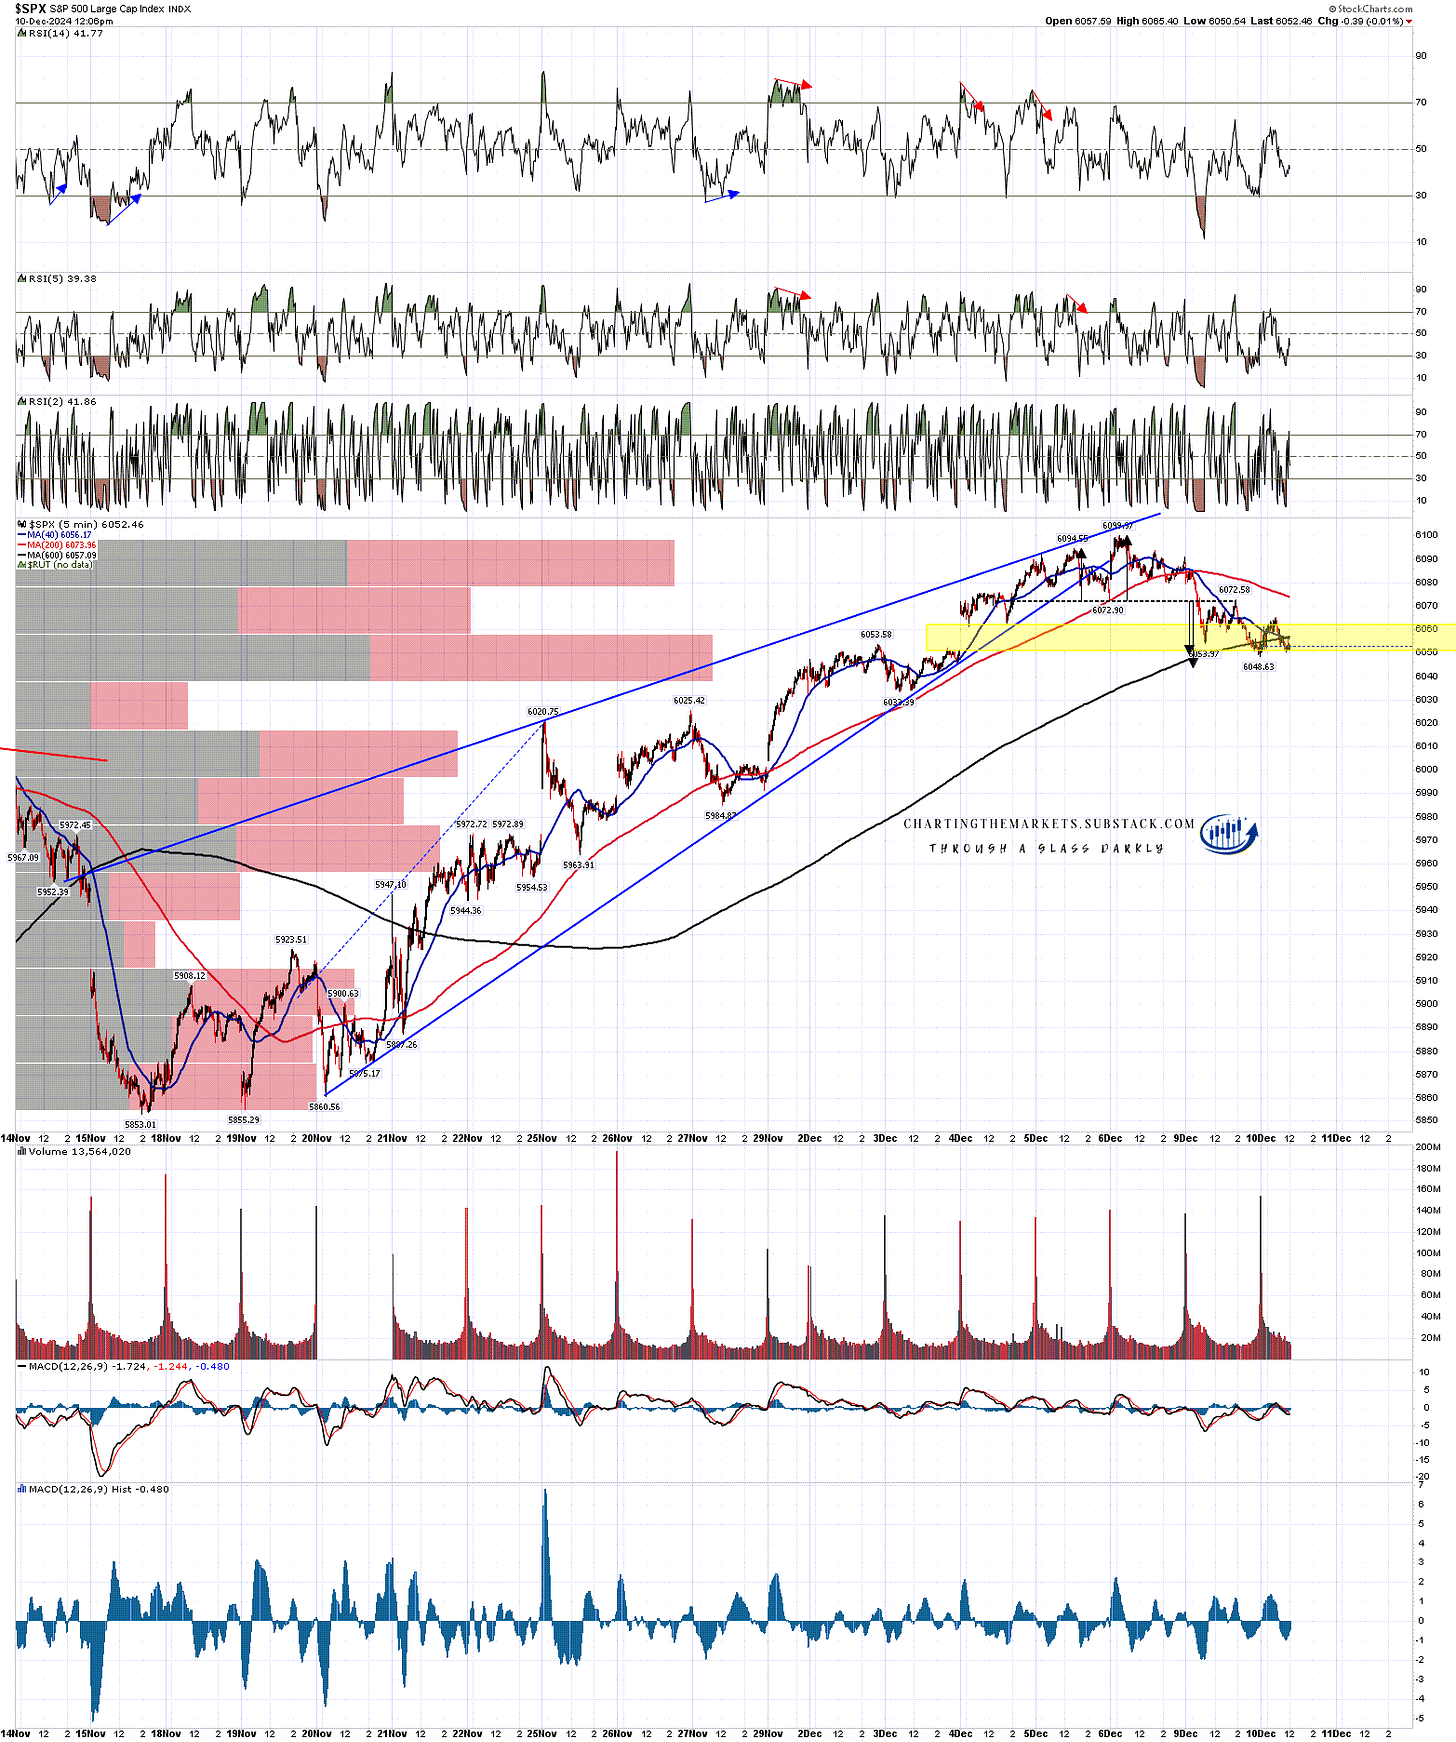
On SPX the double top has reached the minimum target, with the extended target a little lower at 6044.
SPX 5min chart:
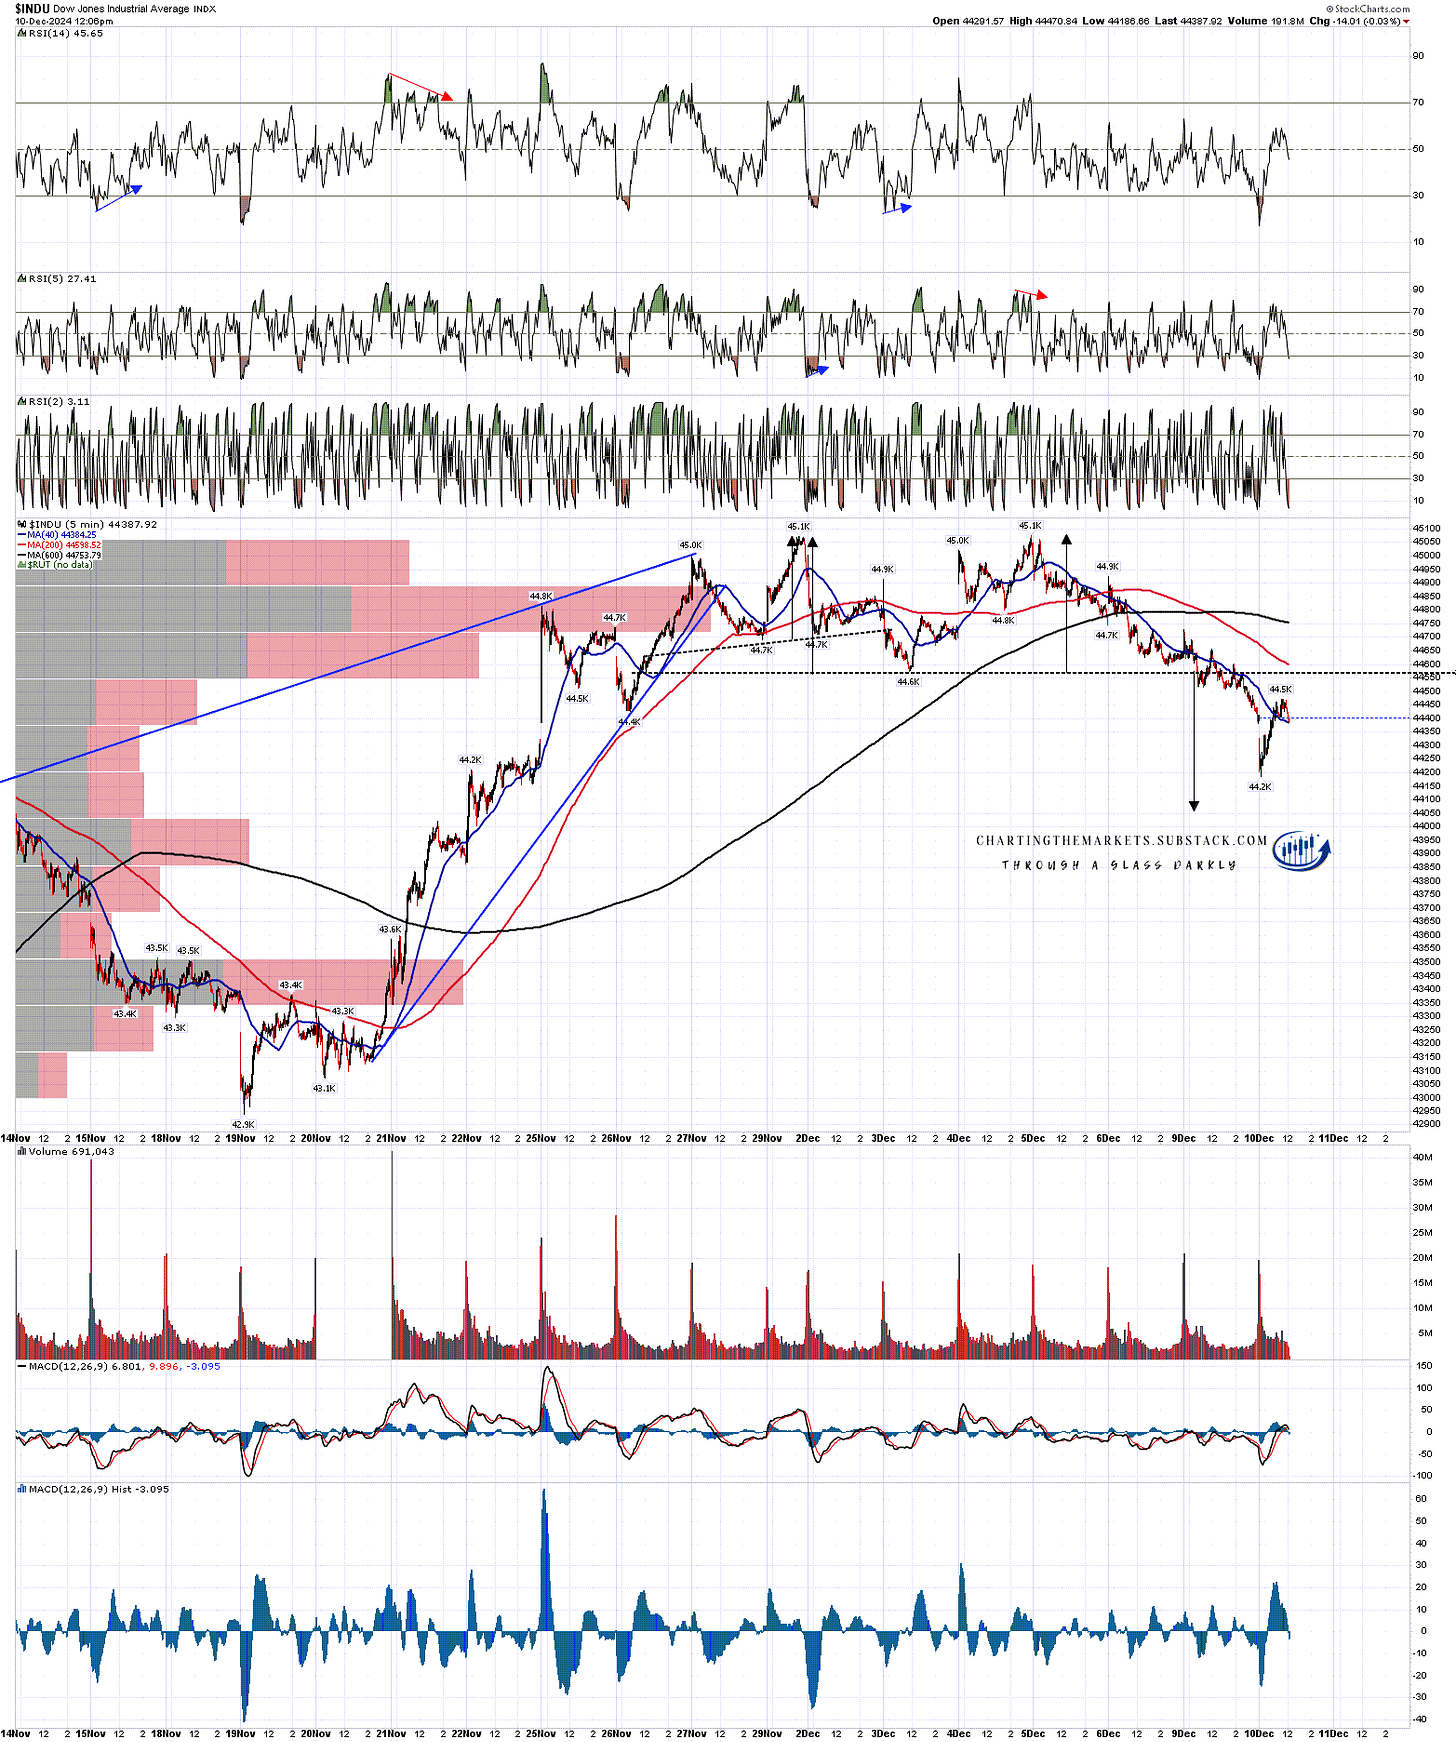
On Dow the double top target is in the 44050 area, not quite reached at the morning low but possibly close enough.
INDU 5min chart:
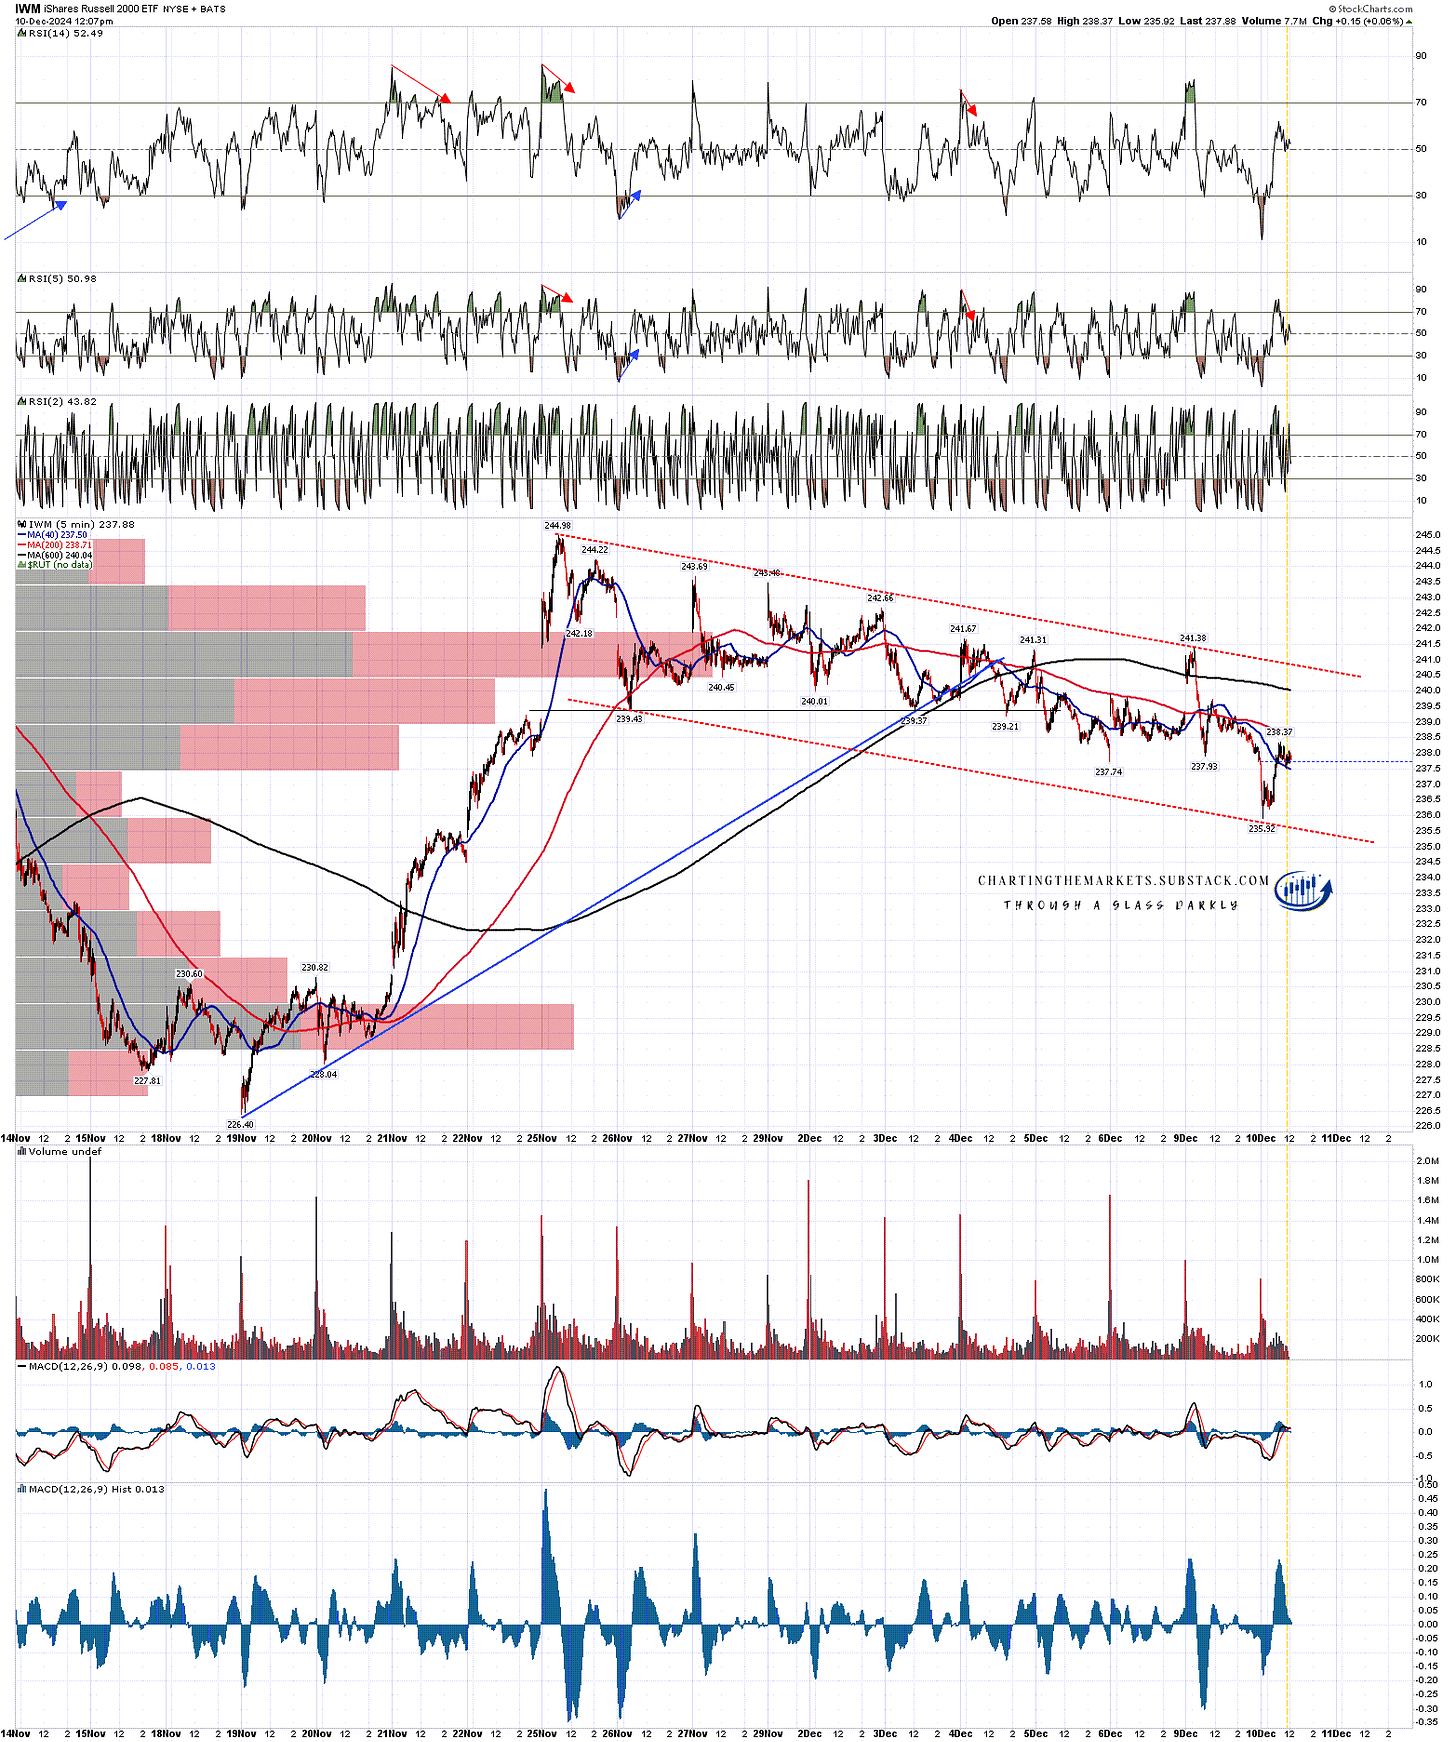
I was looking at the very nice bull flag on RTY yesterday morning as there wasn’t much to see on IWM, but we now have a pretty decent looking bull flag on IWM as well.
This is one reason I’m thinking indices may turn directly back up from here or not far below. A break down on the perfect RTY bull flag channel would open further downside and possible tests of the daily middle bands.
IWM 5min chart:
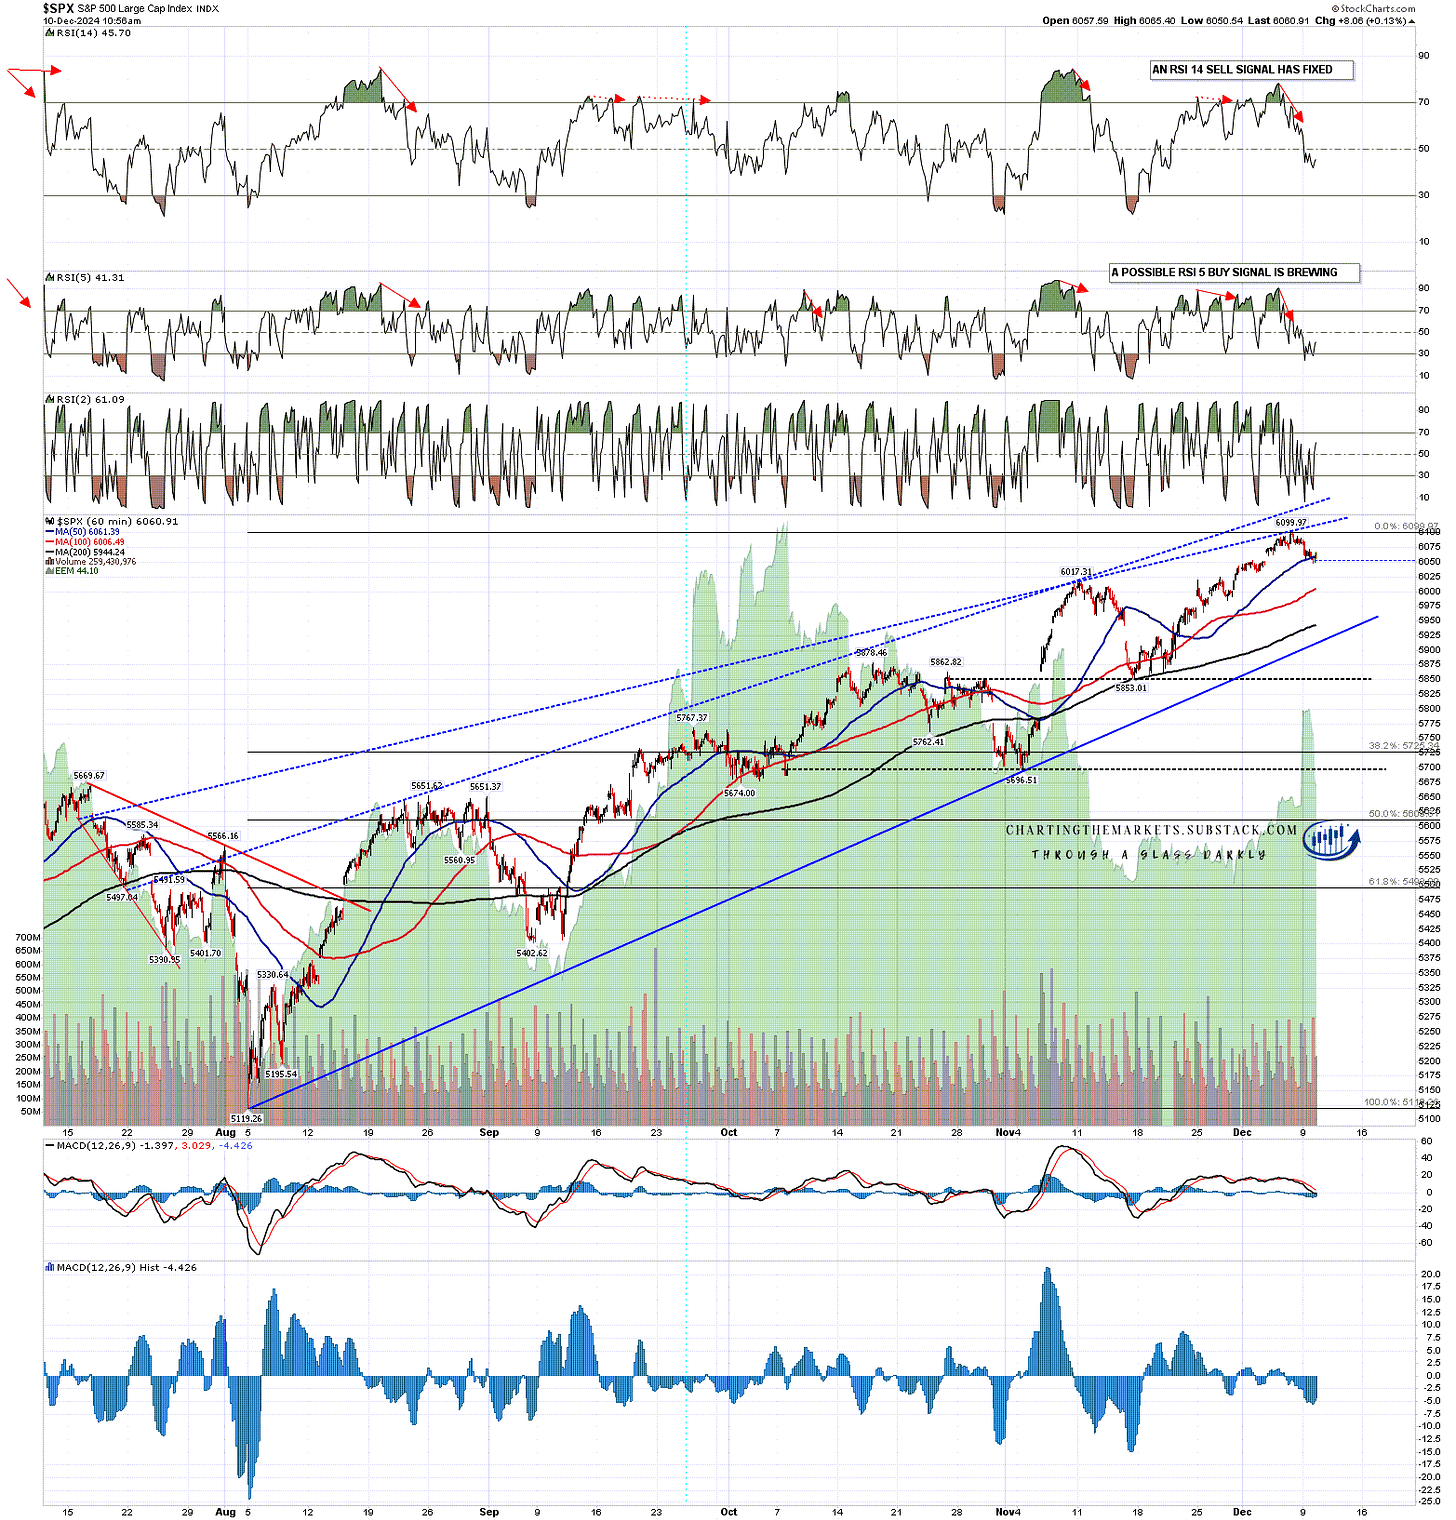
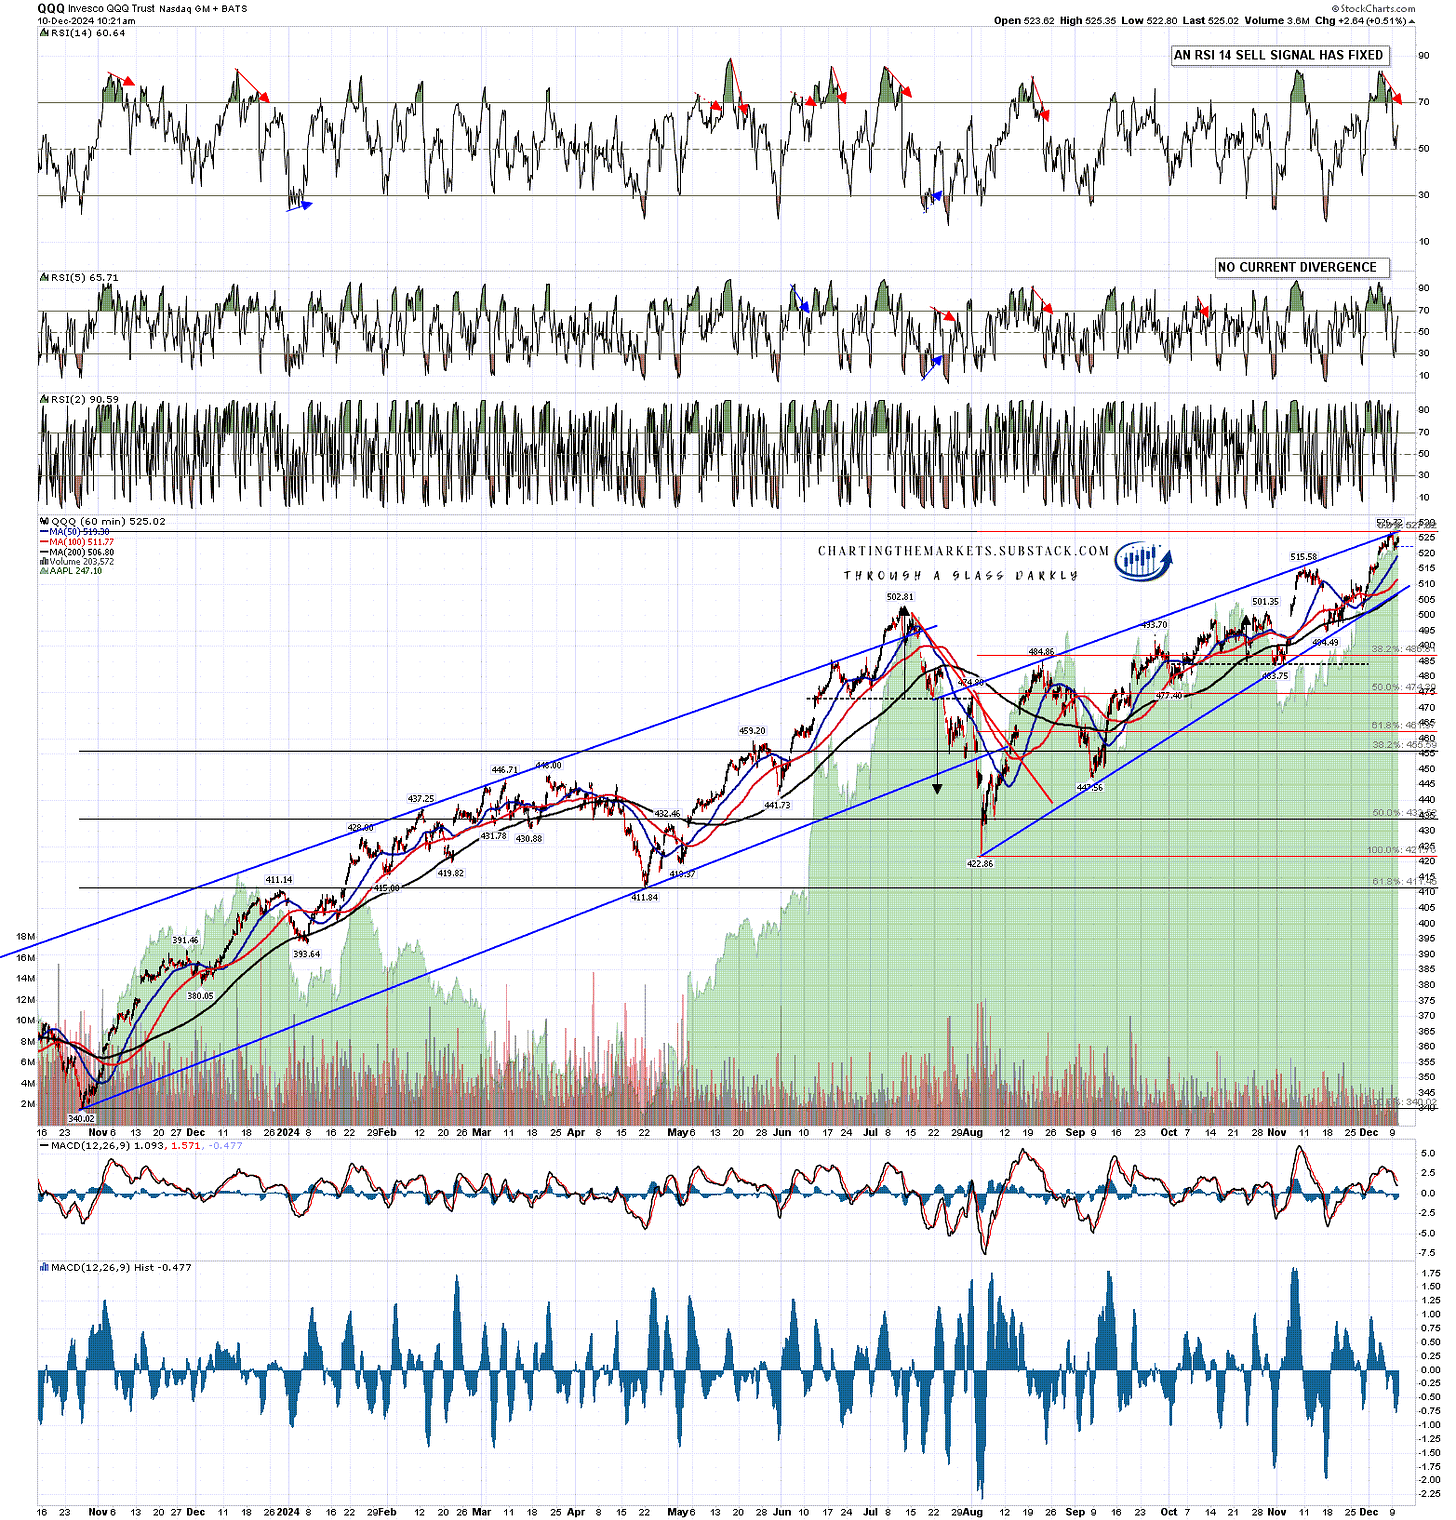
Is there a case for going lower short term? Well there are still fixed RSI 14 sell signals on the SPX and QQQ hourly charts and we could see some more downside, but this is already the largest retracement at 41 points on SPX since the 57 point decline on 25th November and the largest retracements since this move started at the 15th November low at 5853.01 were the two 63 point declines on 19/20 and 21 November as this move up was starting.
Unless this is a larger consolidation, I would therefore be expecting this move to stay above the 6026 level unless this is a larger retracement looking for either a test of the daily middle band, currently at 5996, or a test of rising support from the Aug 2024 low, currently in the 5920 area.
My lean is that I would expect to see at least a retest of the current all time high before we might see a retracement of that size.
SPX 60min chart:
Here is the fixed sell signal on the NDX hourly chart, and the same applies to NDX.
QQQ 60min chart:
The US equity indices have finally had a decent run from the 15th November low and in the absence of strong evidence to the contrary, I’m expecting more upside into Xmas, and likely into January, though there should be a larger retracement in that period somewhere.
The closer we come to inauguration the more I’m also going to be looking at the incoming administration and the policies that are being talked about for the first 100 days of the new administration. Tariffs, Ukraine and others may make this one of the most interesting years on the markets that anyone can remember.
If you like my analysis and would like to see more, please take a free subscription at my chartingthemarkets substack, where I publish these posts first.
I also do a premarket video every day on equity indices, bonds, currencies, energies, precious commodities and other commodities at 8.45am EST. If you’d like to see those I post the links every morning on my twitter, and the videos are posted shortly afterwards on my Youtube channel.

No comments:
Post a Comment