
In my last post on Friday 20th December I was looking at the very likely rally that I called that day in my video before the open and that we saw start that day on equity indices and Crypto, and I said the following then about that:
‘How long might this rally last? Well given that today is 20th December I’m thinking this rally may well take us into Xmas and fairly shortly thereafter into lower lows. We shall see. ‘
Obviously today is now 30th December, tomorrow is the last trading day of the year, and as I was saying on Friday 20th December, I was expecting the rally to fail into lower lows shortly after Xmas. That may well be in progress now.
In my premarket video on Friday morning I was looking at a small double top on ES/SPX that I thought might well play out, and that delivered too. The question here is whether there is anything more to come in this rally, or whether we are going to see lower lows directly.
Let’s have a look at the rally.
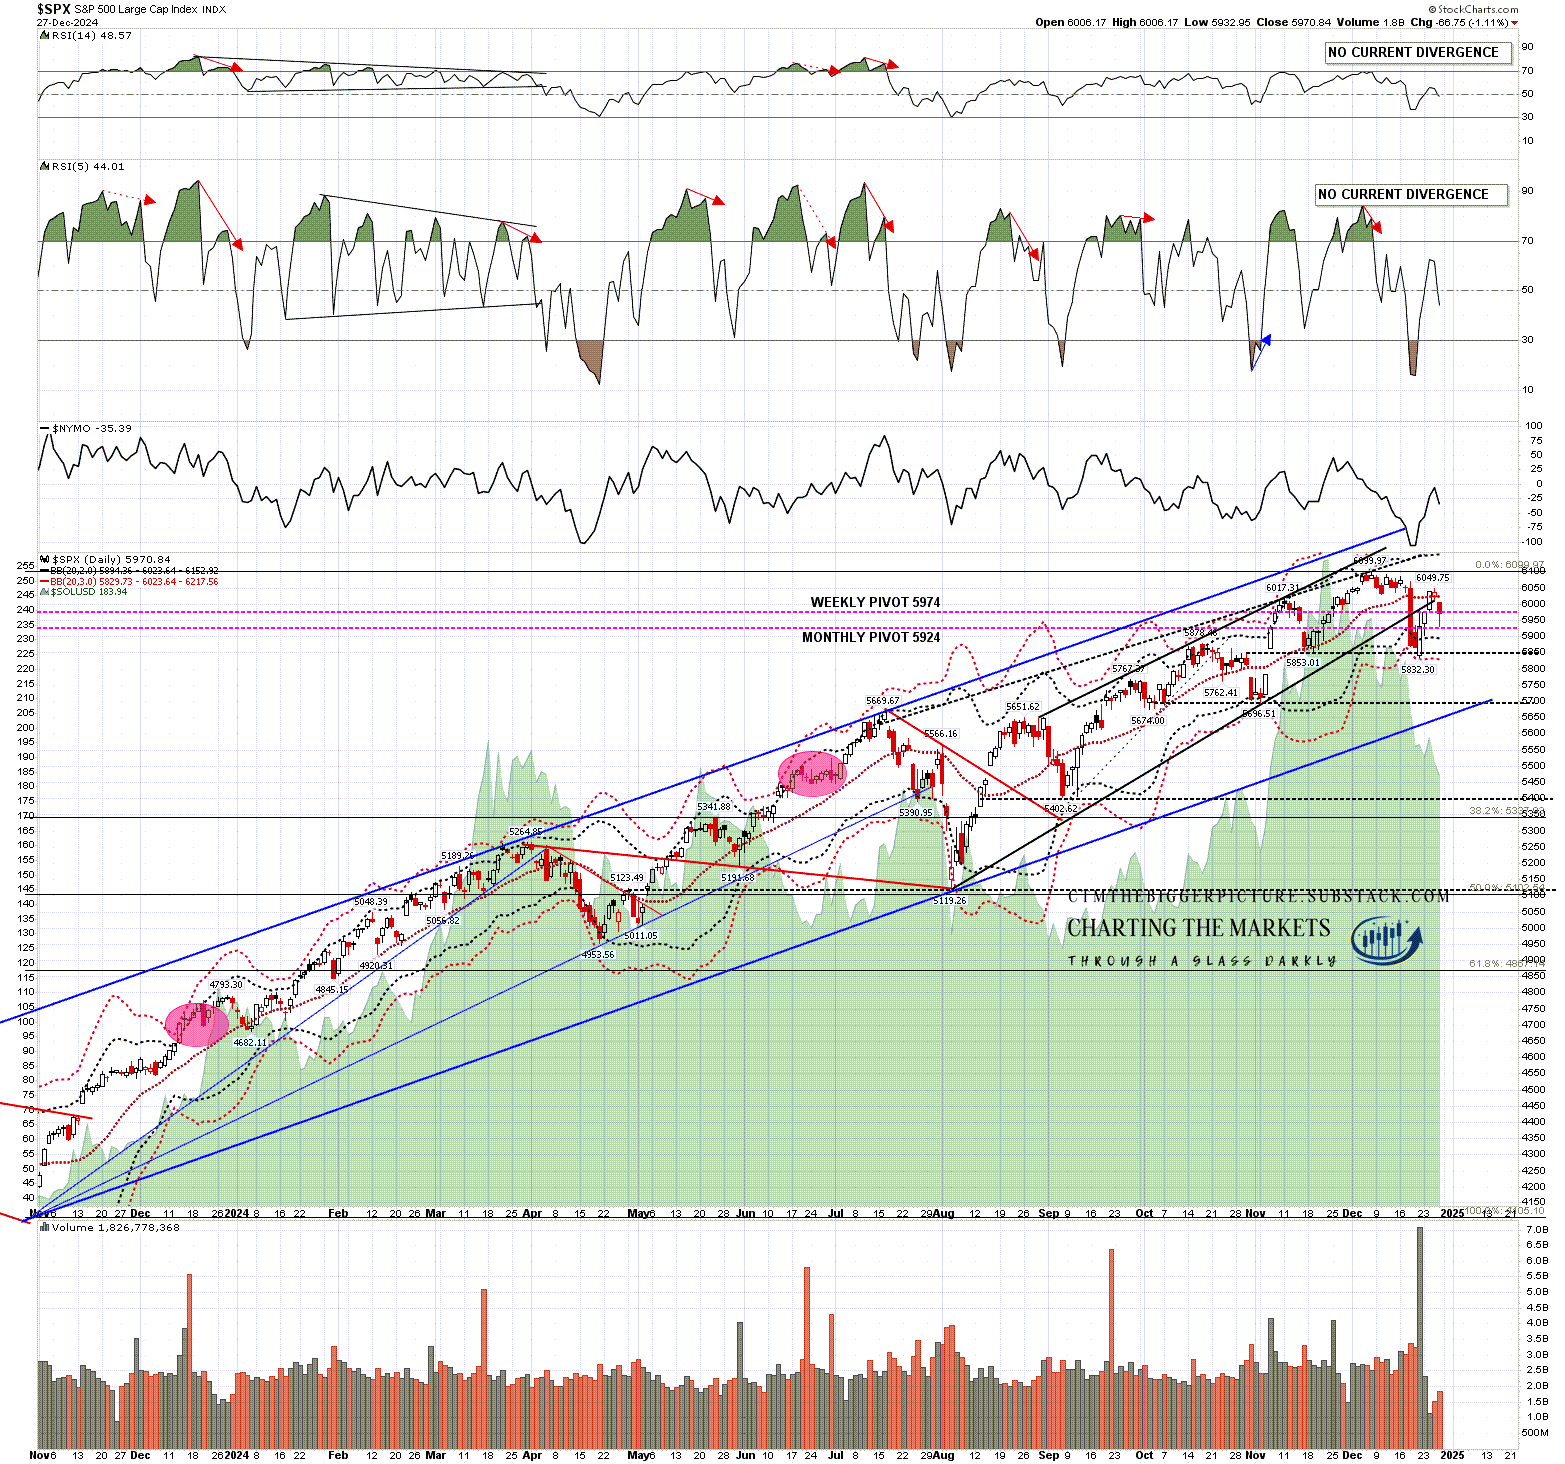
The rising wedge from the August low broke down on the move after FOMC, and I’m looking for a topping pattern before lower lows. The two obvious options were either to form the right shoulder on an H&S or to retest the all time high to make the second high of a double top.
For now, SPX has backtested broken rising wedge support and the daily middle band and formed a decent quality right shoulder. This is a nice topping setup and SPX may well just fail here, though there is still a chance that we might see a break back over the daily middle band that could set up a retest of the all time high.
SPX daily chart:
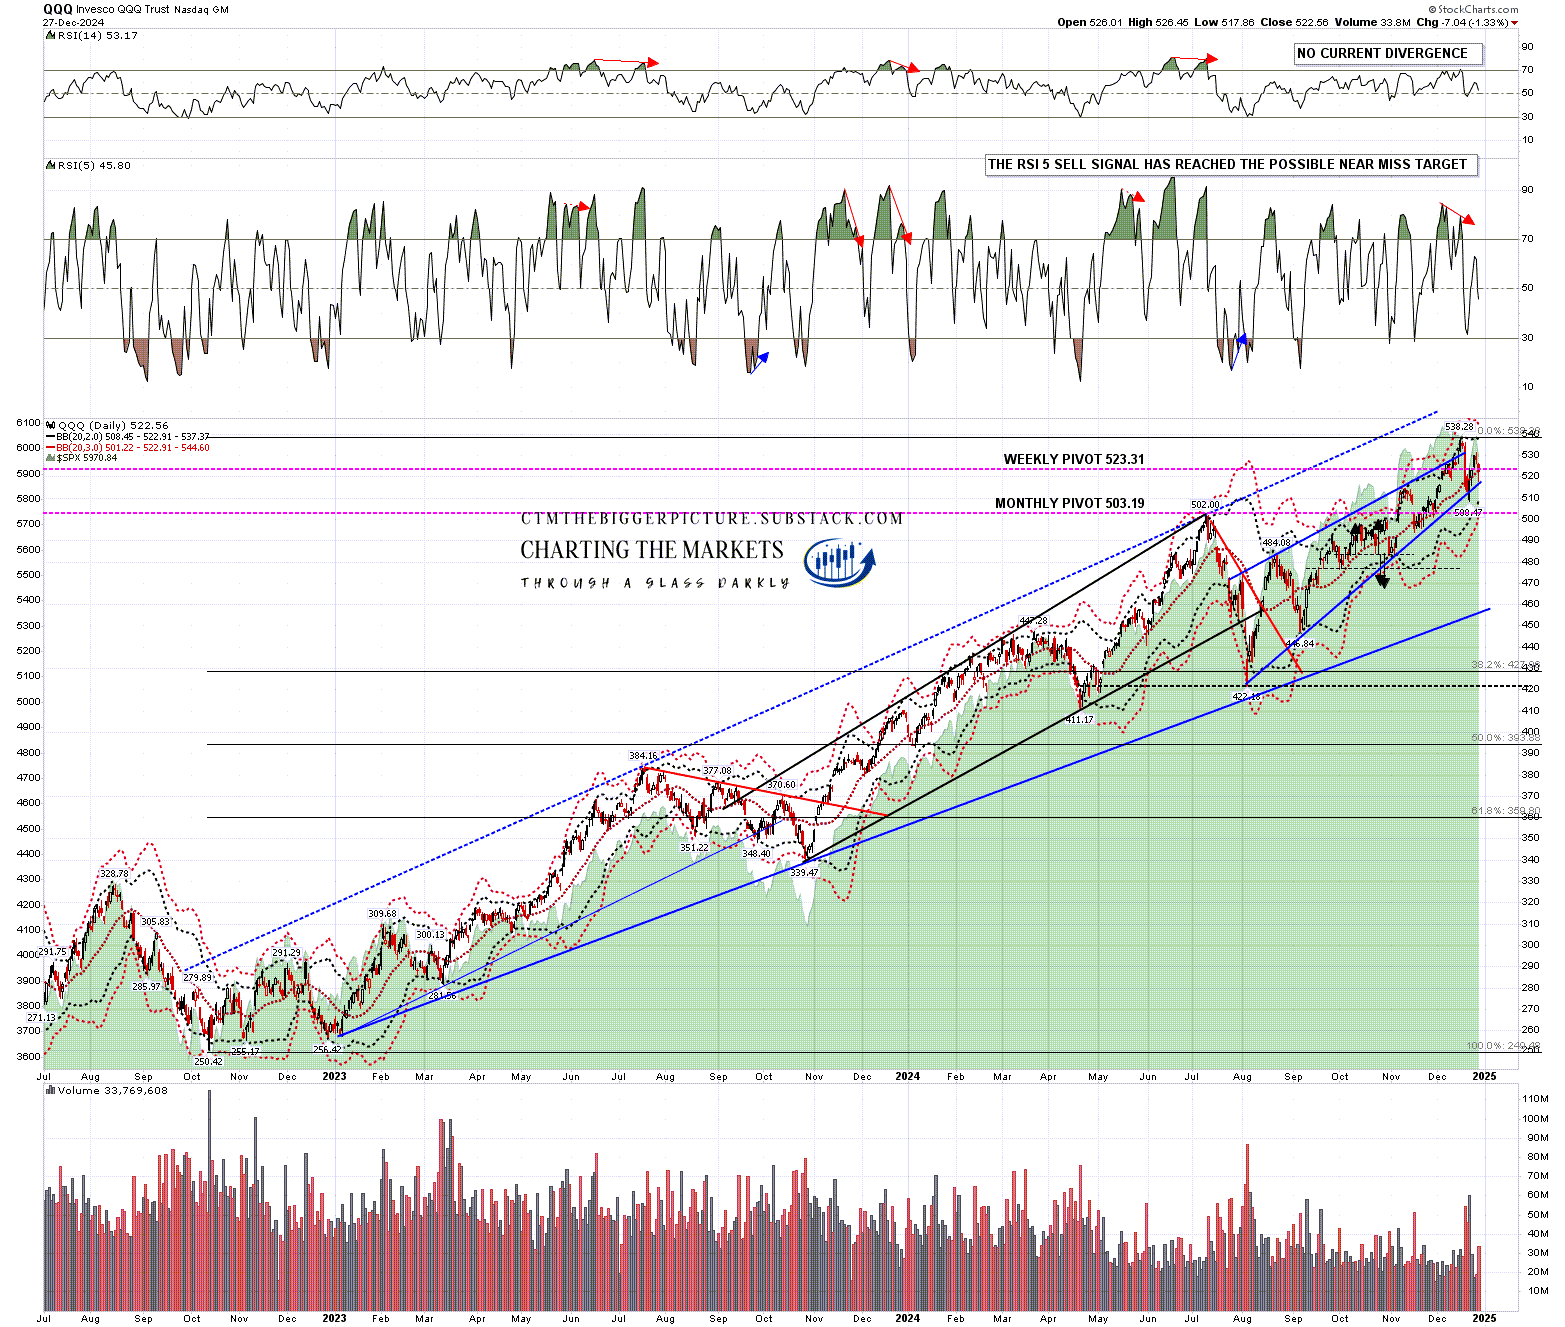
QQQ, which led the last move up, was the strongest on the decline after FOMC, and recovered back over the daily middle band quickly. On Friday QQQ closed back on the daily middle band and on an obvious inflection point. There is no obvious reversal pattern formed here, but if a lower low from here is just forming an overall bull flag, that doesn’t matter too much.
QQQ daily chart:
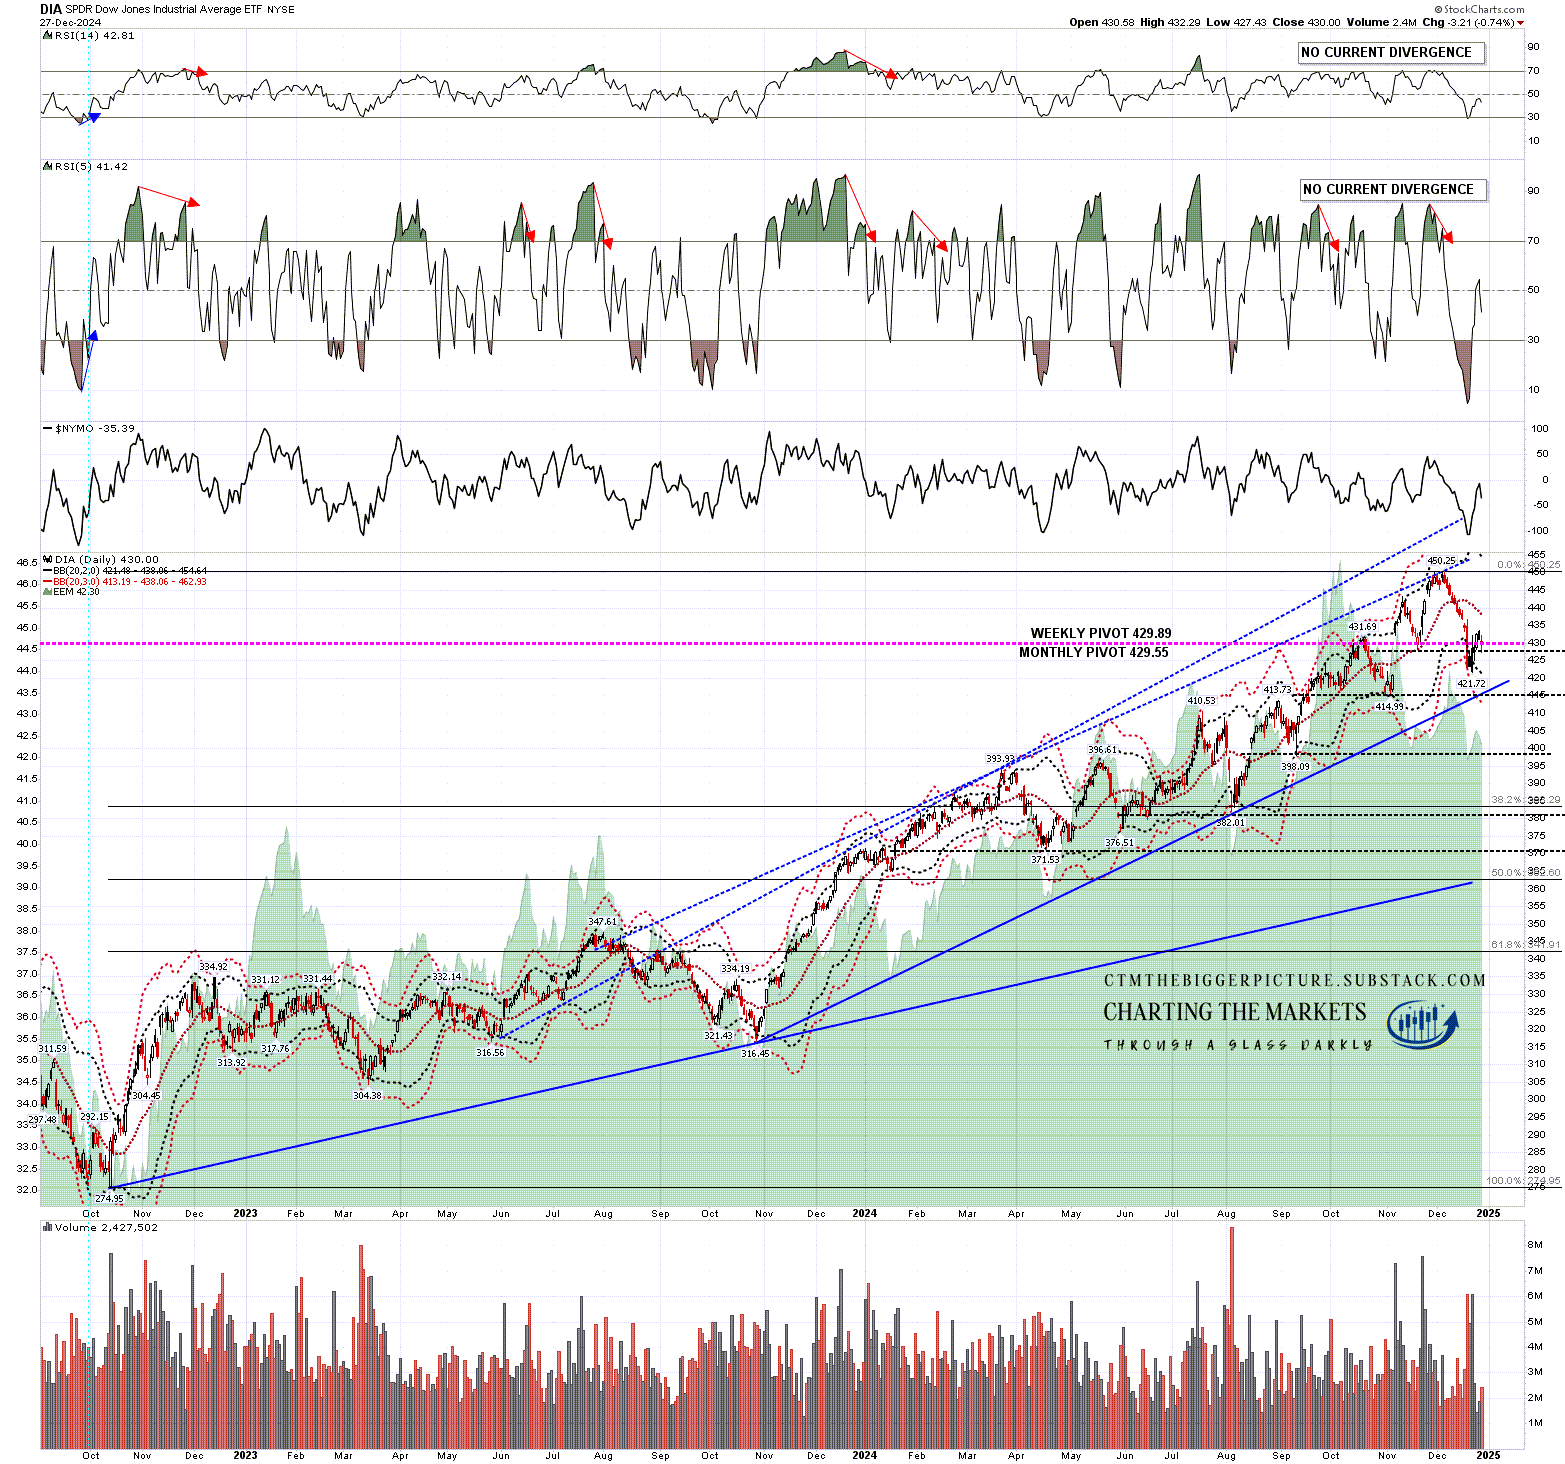
One thing that has been very obvious on this rally is that it has mostly been on Tech, with DIA, IWM, DAX & ESTX50 just building what look like modest bear flags from the low. DIA has not come anywhere close to a backtest of the daily middle band and unless we see all time high retests on SPX and QQQ a backtest of the daily middle band looks ambitious.
There is no obvious reversal pattern here though it we were to see a failure directly from here there would be a valid (though ugly) H&S setup that on a sustained break below the 425 area would look for the 393 area. The pattern is not a pretty one though and in my experience that makes it less likely to make that target.
DIA daily chart:
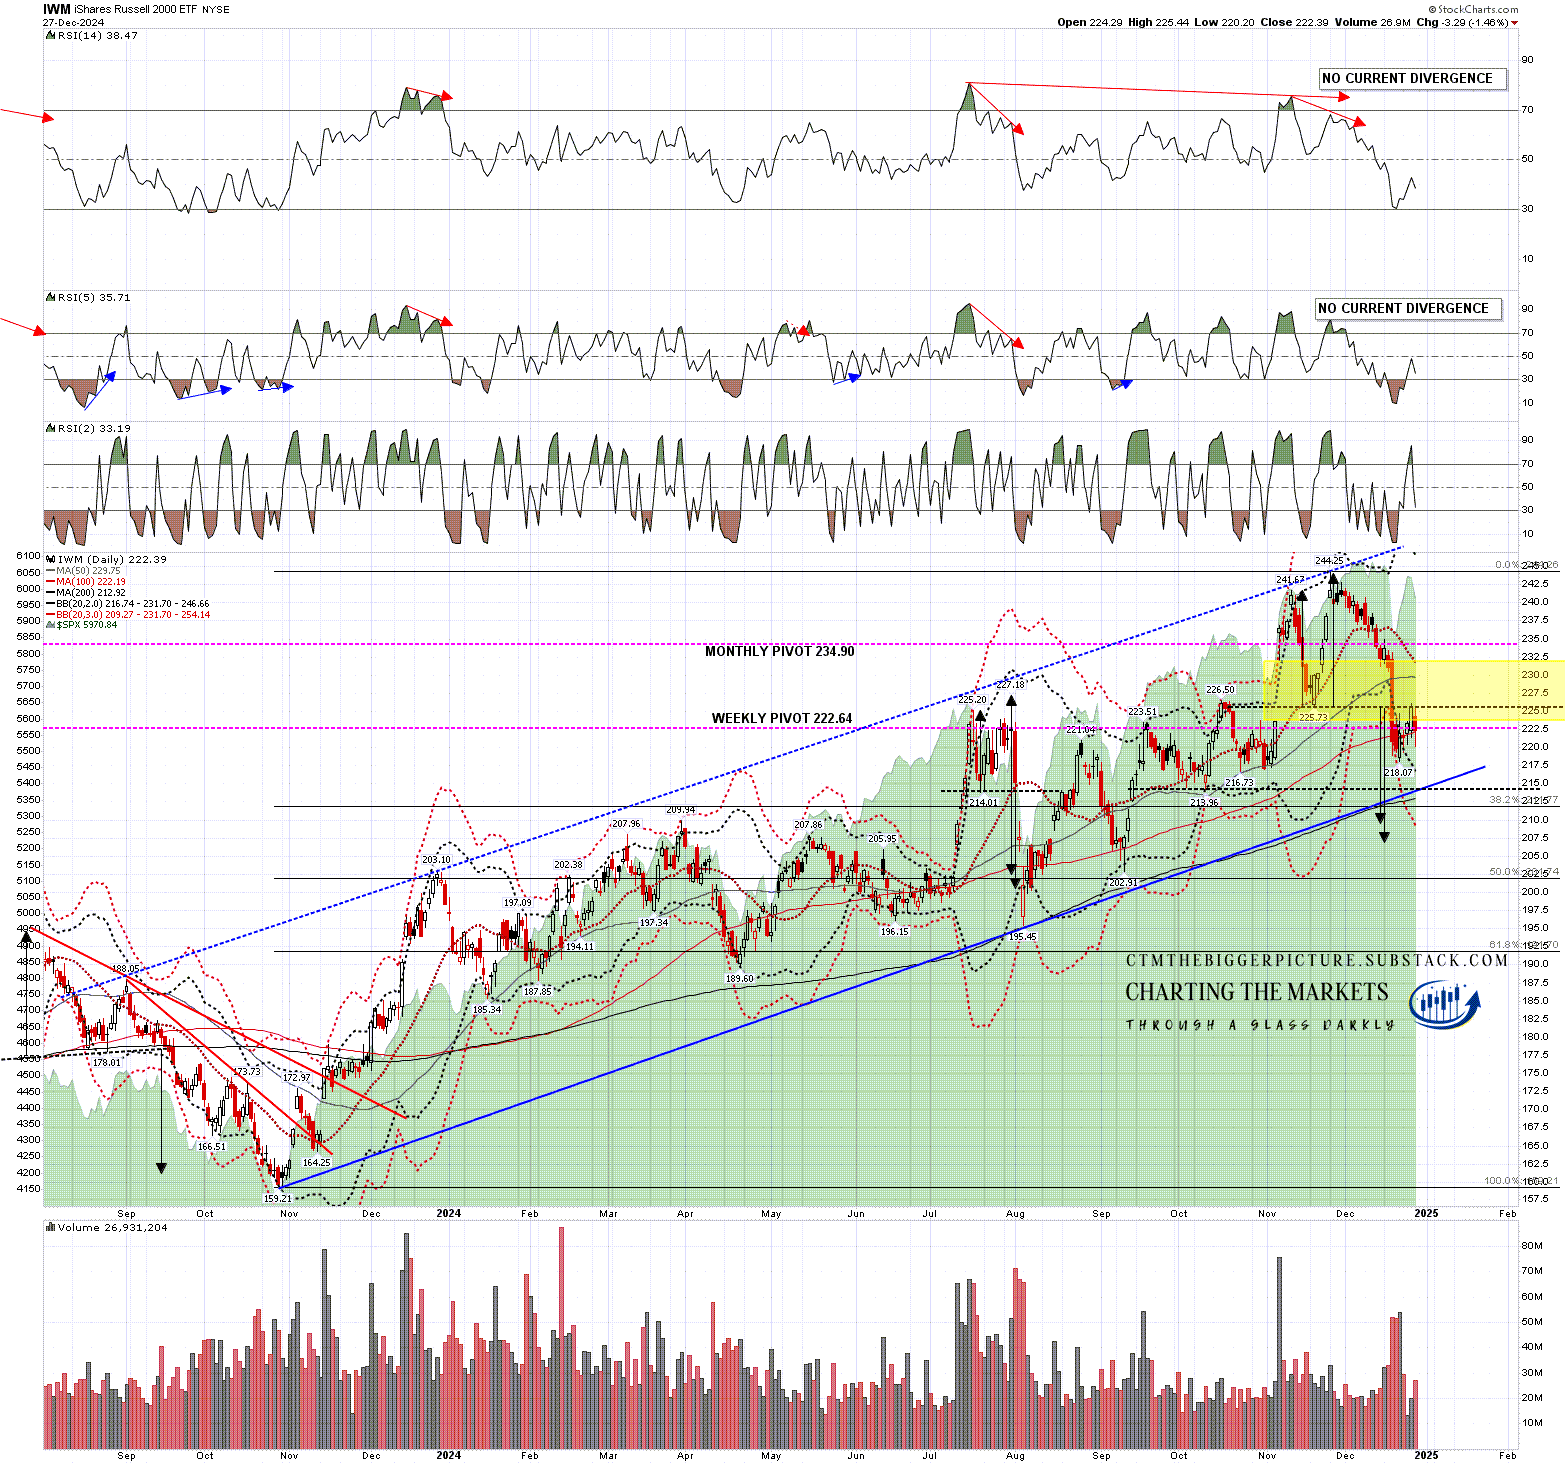
IWM hasn’t rallied much from the low and already had a reversal pattern formed at the last high. That double top has broken down with a target in the 206-9 range and the rally has just backtested that broken double top support. This chart is strongly favoring a direct fail from here into that target area.
IWM daily chart:
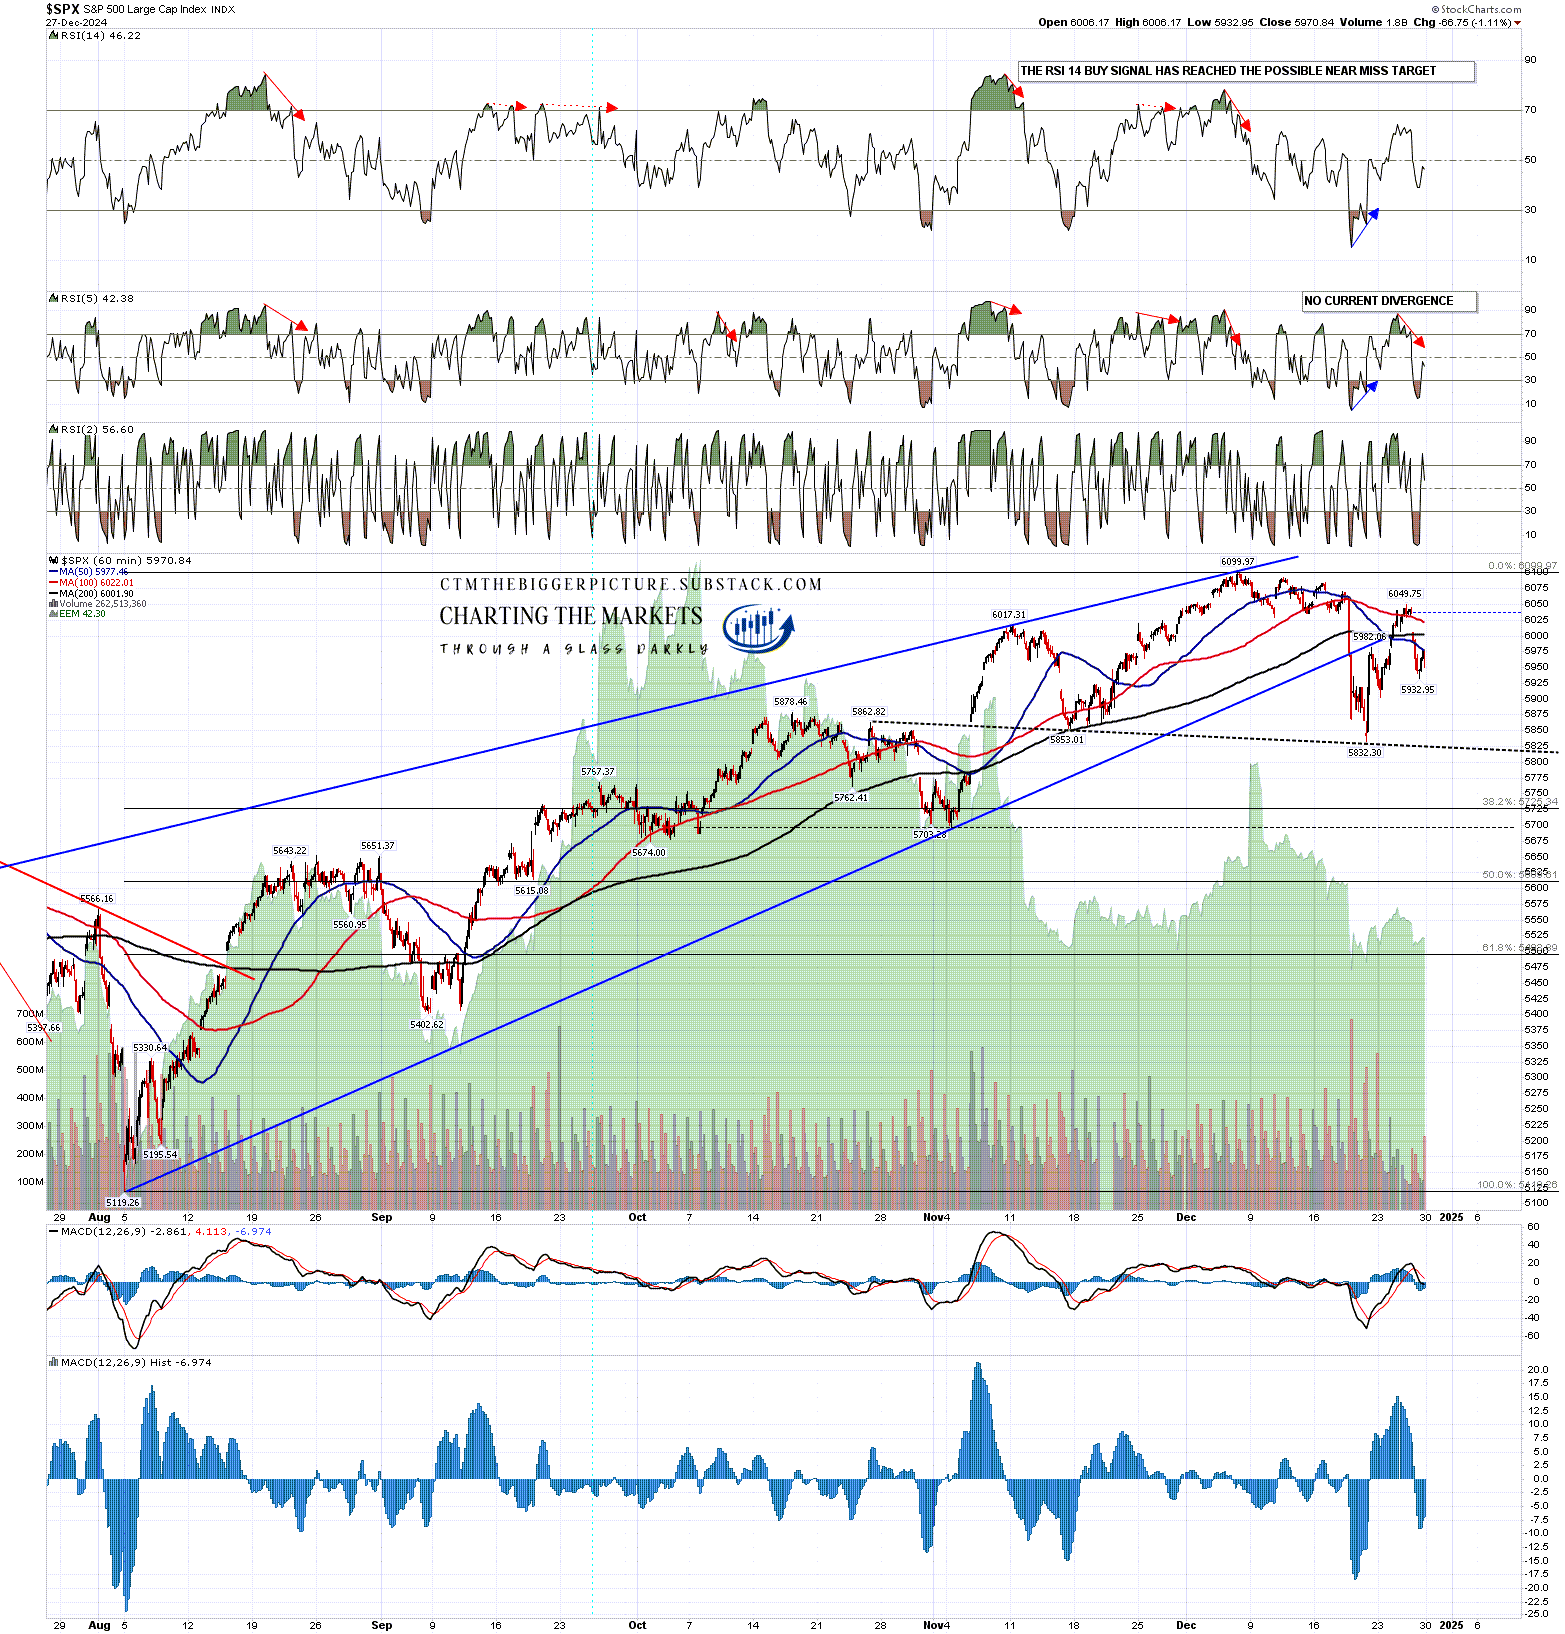
On the SPX hourly chart the H&S setup looks good, and a sustained break below the neckline in the 5820 area would have a target in the 5575 area. That would be between a 50% and 61.8% retracement of the rising wedge from the August low, which is pretty standard for a bullish retracement. It’s an attractive target.
SPX 60min chart:
I’ve been talking the last few weeks about a larger retracement that would likely be coming early in 2025 and this is a decent setup for that retracement. As I write the setup favors heading lower directly from here or a bit higher, though the light trading and some positive divergence on the 15min charts on the indices might hold prices up until the start of 2025.
Overall I’m not leaning bullish for 2025. The last two years have been strong, valuations look very full, and there is a lot of uncertainty about next year. I’m thinking this might be one of the most interesting years on the markets that anyone can remember, and boredom tends to favor the bulls. We’ll see how that develops.
If you like my analysis and would like to see more, please take a free subscription at my chartingthemarkets substack, where I publish these posts first.
I also do a premarket video every day on equity indices, bonds, currencies, energies, precious commodities and other commodities at 8.45am EST. If you’d like to see those I post the links every morning on my twitter, and the videos are posted shortly afterwards on my Youtube channel.
No comments:
Post a Comment