This is my last post for 2024, and this is a good opportunity to have a bigger picture look at where we are in the current bull market run on Crypto, before I get on to the shorter term setup for the next few weeks. My crystal ball has been mislaid for the moment in an unfortunate dry cleaning snafu, but I will do what I can in the meantime using historical price action and math.
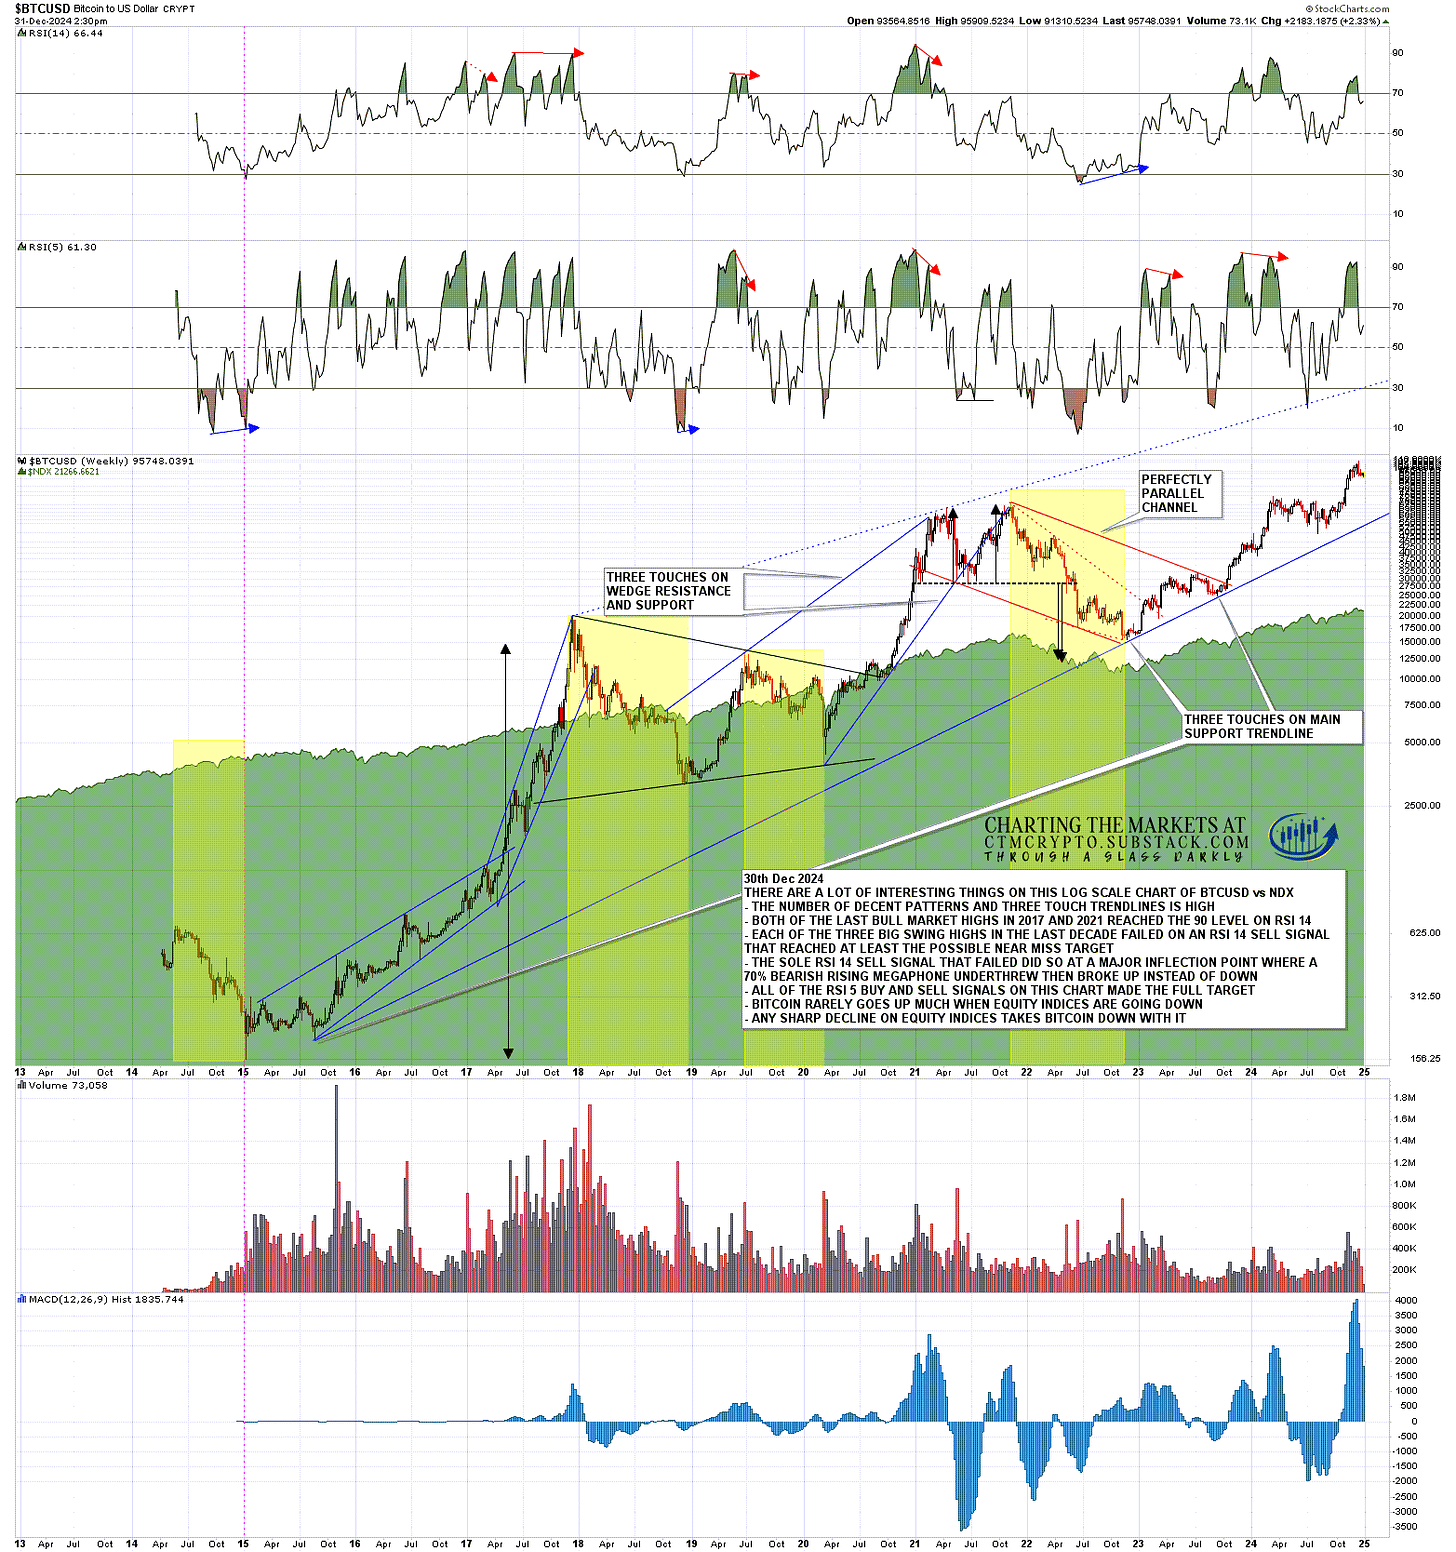
I wanted to show you all my much bigger picture Bitcoin (BTCUSD) weekly log scale chart vs NDX, which is really a very interesting chart. I will quickly go through some of the highlights from this chart
I don’t use log scale much, and that’s because unless I can see decent three touch trendlines forming on a log scale chart then I will always use the standard scale, unless I am simply looking at the scale of price movement over the chart period. Most log scale charts do not yield decent three touch trendlines or patterns.
Bitcoin works very well on a log scale chart, which is just as well, as otherwise no longer term chart of Bitcoin would be useful for much. There are multiple three touch trendlines, decent patterns, and even a perfect bull flag channel forming 2021-3.
So what are the key takeaways from this chart going back to 2014?
Bitcoin has been significantly positively correlated with equity indices so far, and in particular there are no obvious sharp declines on equity indices on the chart where Bitcoin didn’t follow suit. This is an issue because next year on equity indices may well be turbulent, not necessarily overall bearish, but turbulent.
Now any decent statistician would tell you that a sample size of three is too few to draw strong conclusions, but there are two prior bull market highs on this chart, with the first bull market high in Q4 2013, and the next two shown in Q4 2017 and Q4 2021 respectively. That at minimum has us leaning towards seeing the next bull market high around Q4 2025.
Both of the last bull market highs in 2017 and 2021 reached the 90 level on the weekly RSI 14, and generated weekly RSI 14 sell signals which both made the full target at the 30 level on the RSI 14. There is a decent chance we will see the same at the next bull market high.
Also worth noting is that the last six month move of the bull market in 2010-3 took price up about 700%, very much a minimum number as that full bull run started at close to zero in 2010. The 2015-7 run took price up from about $230 to $19,500, a rise of just under 8500%. The third bull run 2018-21 took price up from $3,200 to $68,700, a rise of just under 2150%. The current bull run from the low in late 2022 has run so far from a low in the $15k area to a high at $108.4k area, a rise of 722% so far and modest by the scale of the three predecessors.
Given that there is a very strong tendency historically to make significant highs and lows close to the end (mainly) or start (less often) of any year, we might spend much of early 2025 retracing while forming a larger bull flag for the historically likely last bull move higher into the end of 2025. As turbulence on equities may well be concentrated in the first half of 2025, that could be a good fit there.
Historically there is therefore a lean to expect the current bull market on Crypto to top out in late 2025 or early 2026 at a price considerably higher than the current $108.4k high. That’s just a lean, but a solid lean with good historical basis.
BTCUSD weekly (LOG) vs NDX:
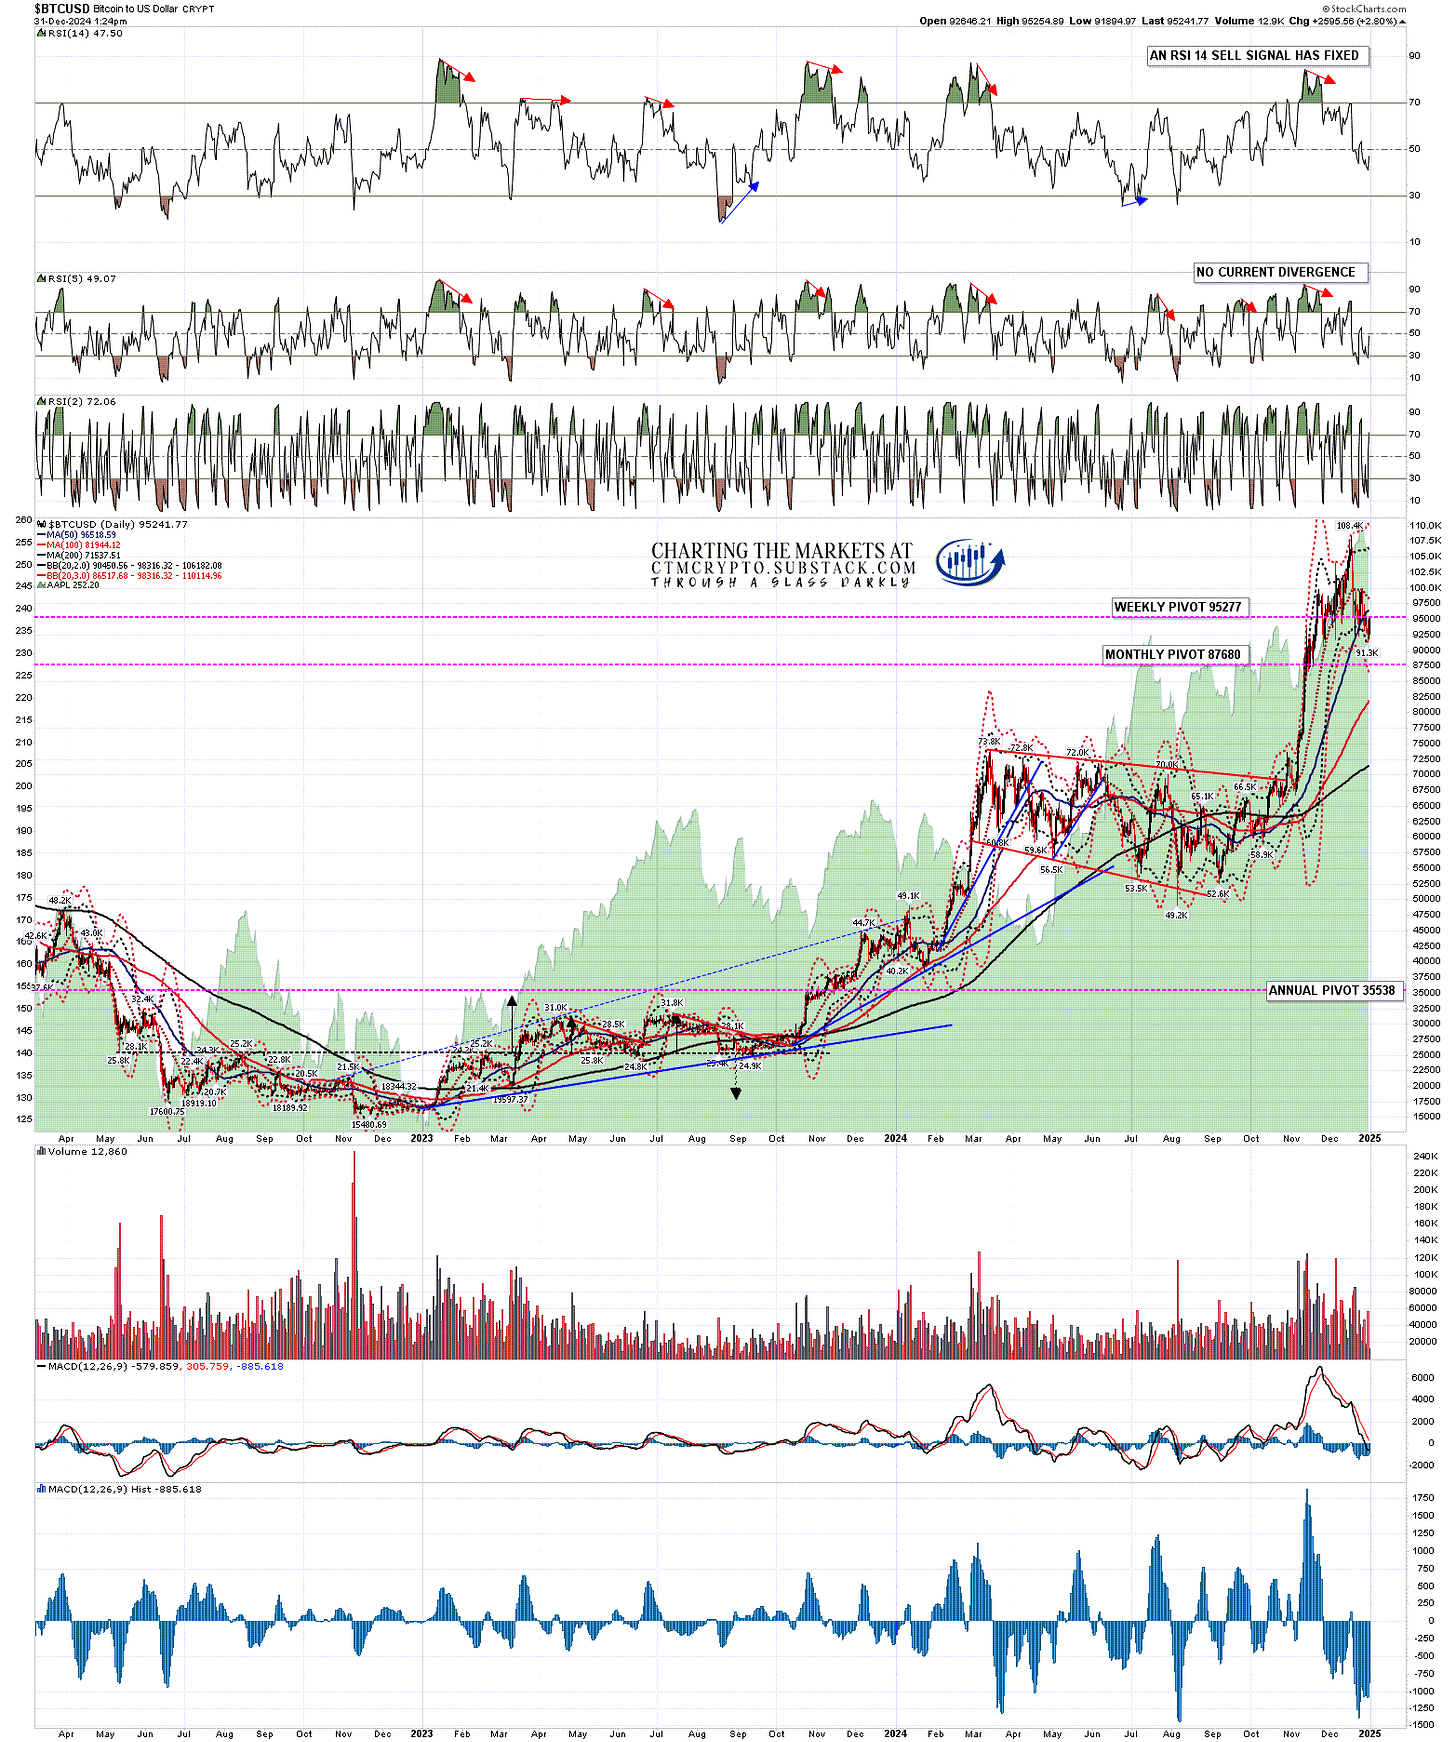
Moving on to the shorter term, Bitcoin still has an open daily RSI 14 sell signal that has not yet made target and that I am still expecting to make target, though not necessarily directly from here. If we are to see a deeper retracement there is a cluster of big support levels around 75,000, with the 200 dma currently at 71,537, the backtest of the broken March 2024 high at 73.8k and the weekly middle band currently at 77.5k. This would be an attractive target area.
BTCUSD daily chart:
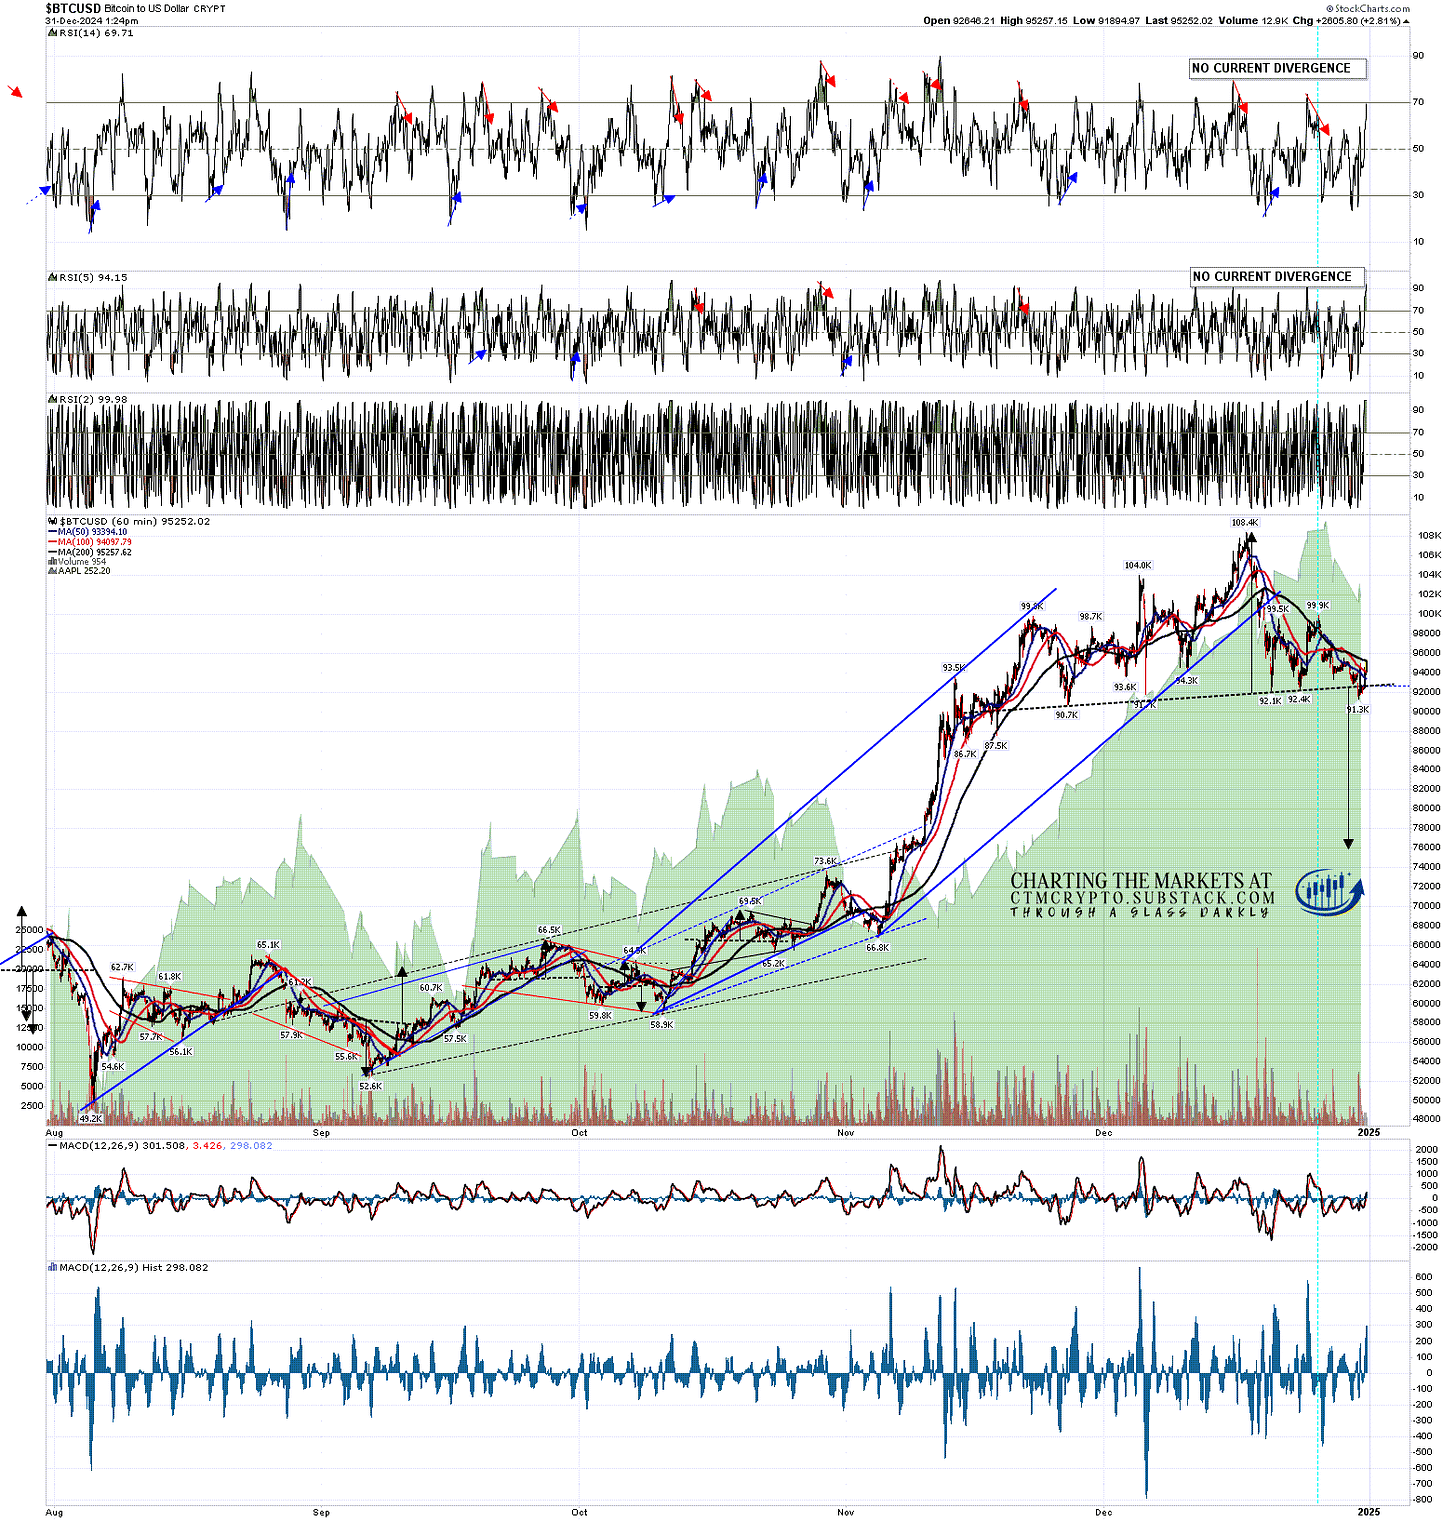
As it happens, the H&S that I have been watching form on Bitcoin in recent weeks completed and broke down yesterday with a target in the 76k area. The pattern may fail and reject back to the high of course, but both the H&S and the case for reaching that target are decent quality, and I’m thinking that might well fit forming a bull flag in the early months of next year before the last leg up in this Crypto bull market.
BTCUSD 60min chart:
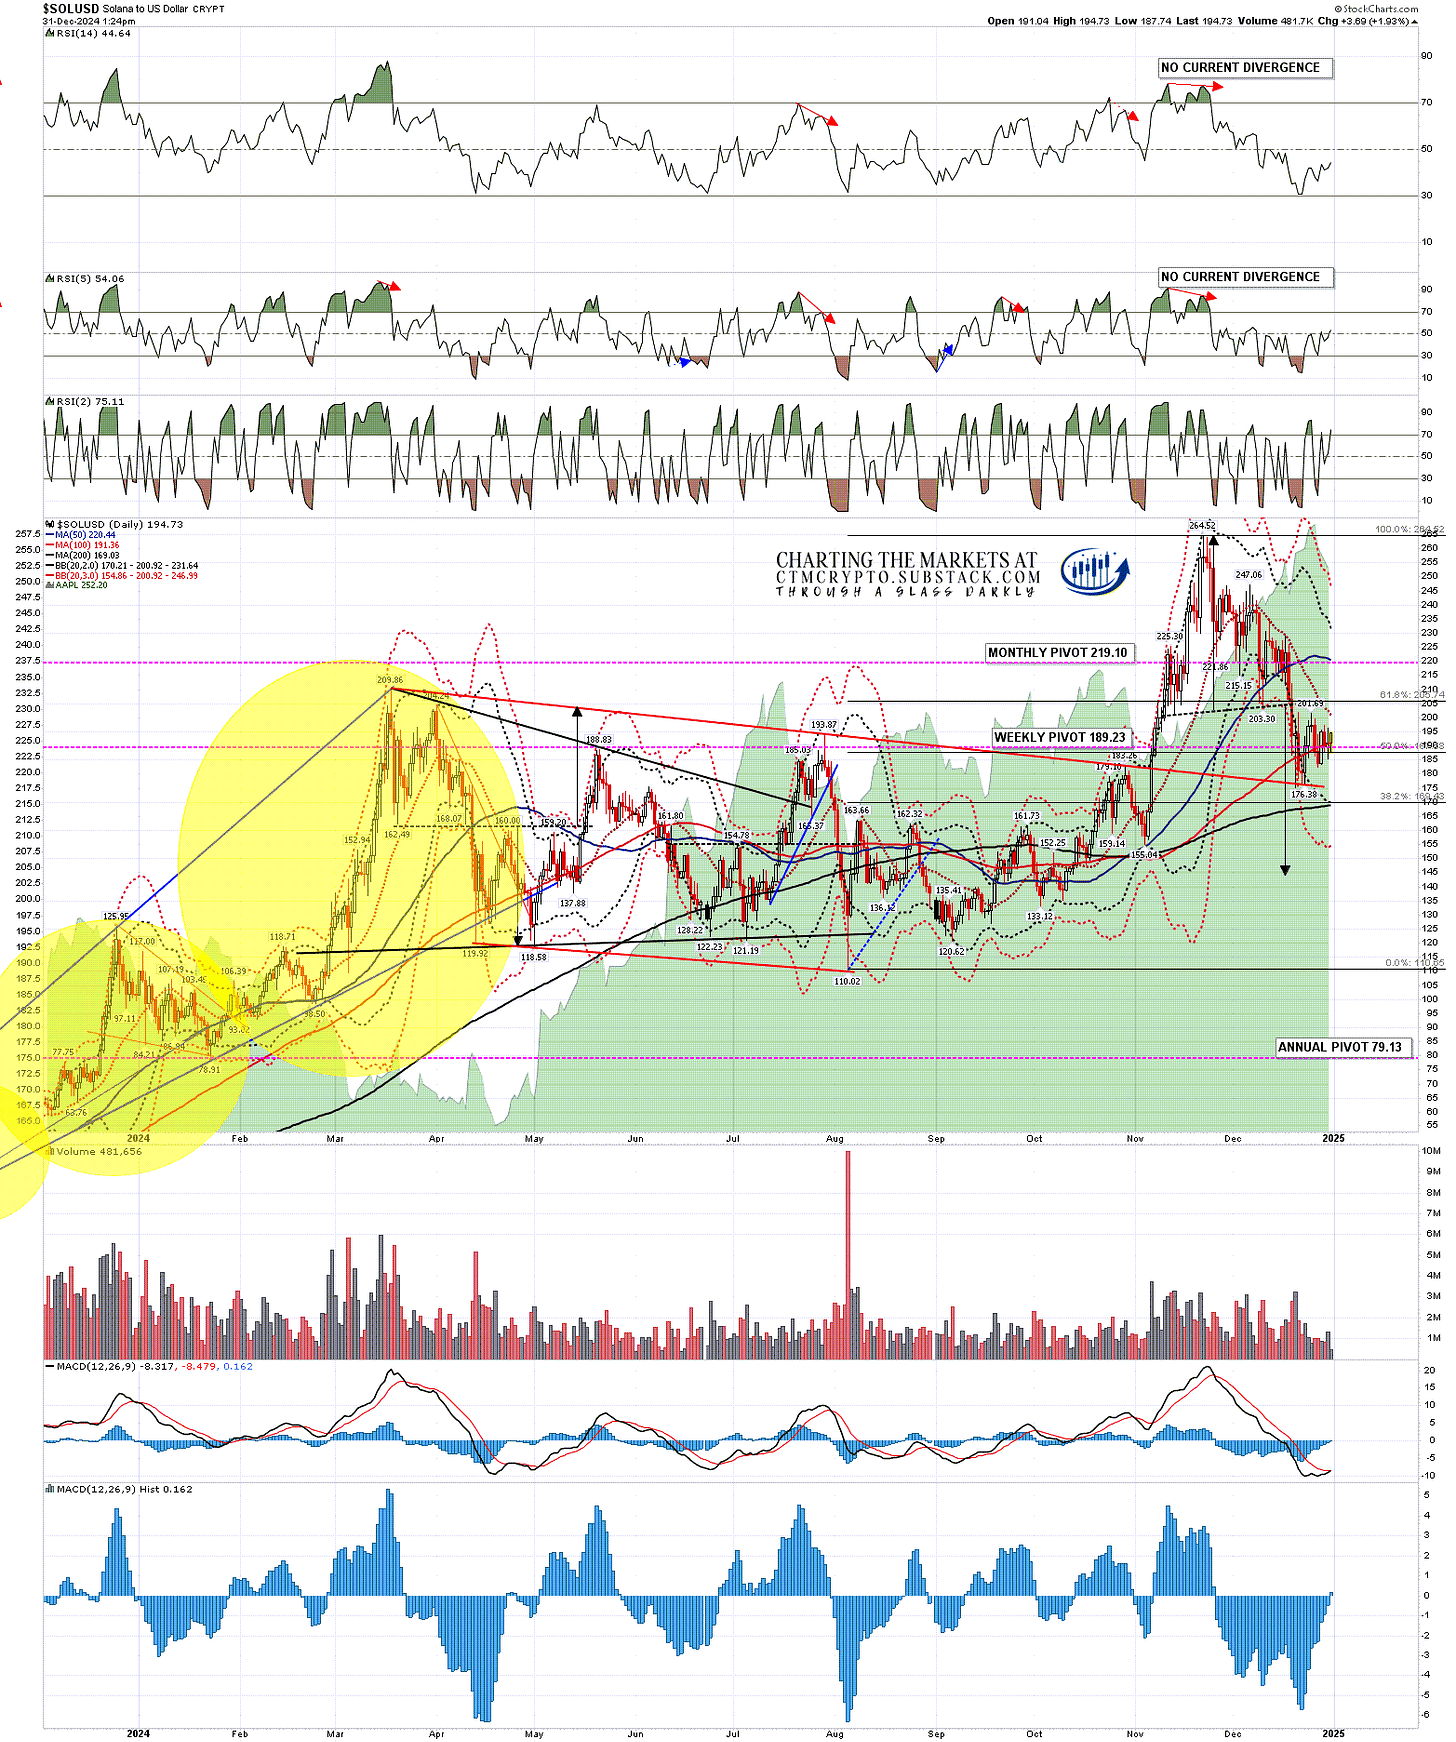
On Solana (SOLUSD) the daily RSI 14 sell signal has already reached target of course, with a nice test of the weekly middle band currently in the 175 area. A decent quality H&S has formed and broken down with a target in the 145 area. That too is a decent pattern, though I am wondering if the decline may finish at the 200dma, currently at 169 and reachable without a conviction break of the weekly middle band.
SOLUSD daily chart:
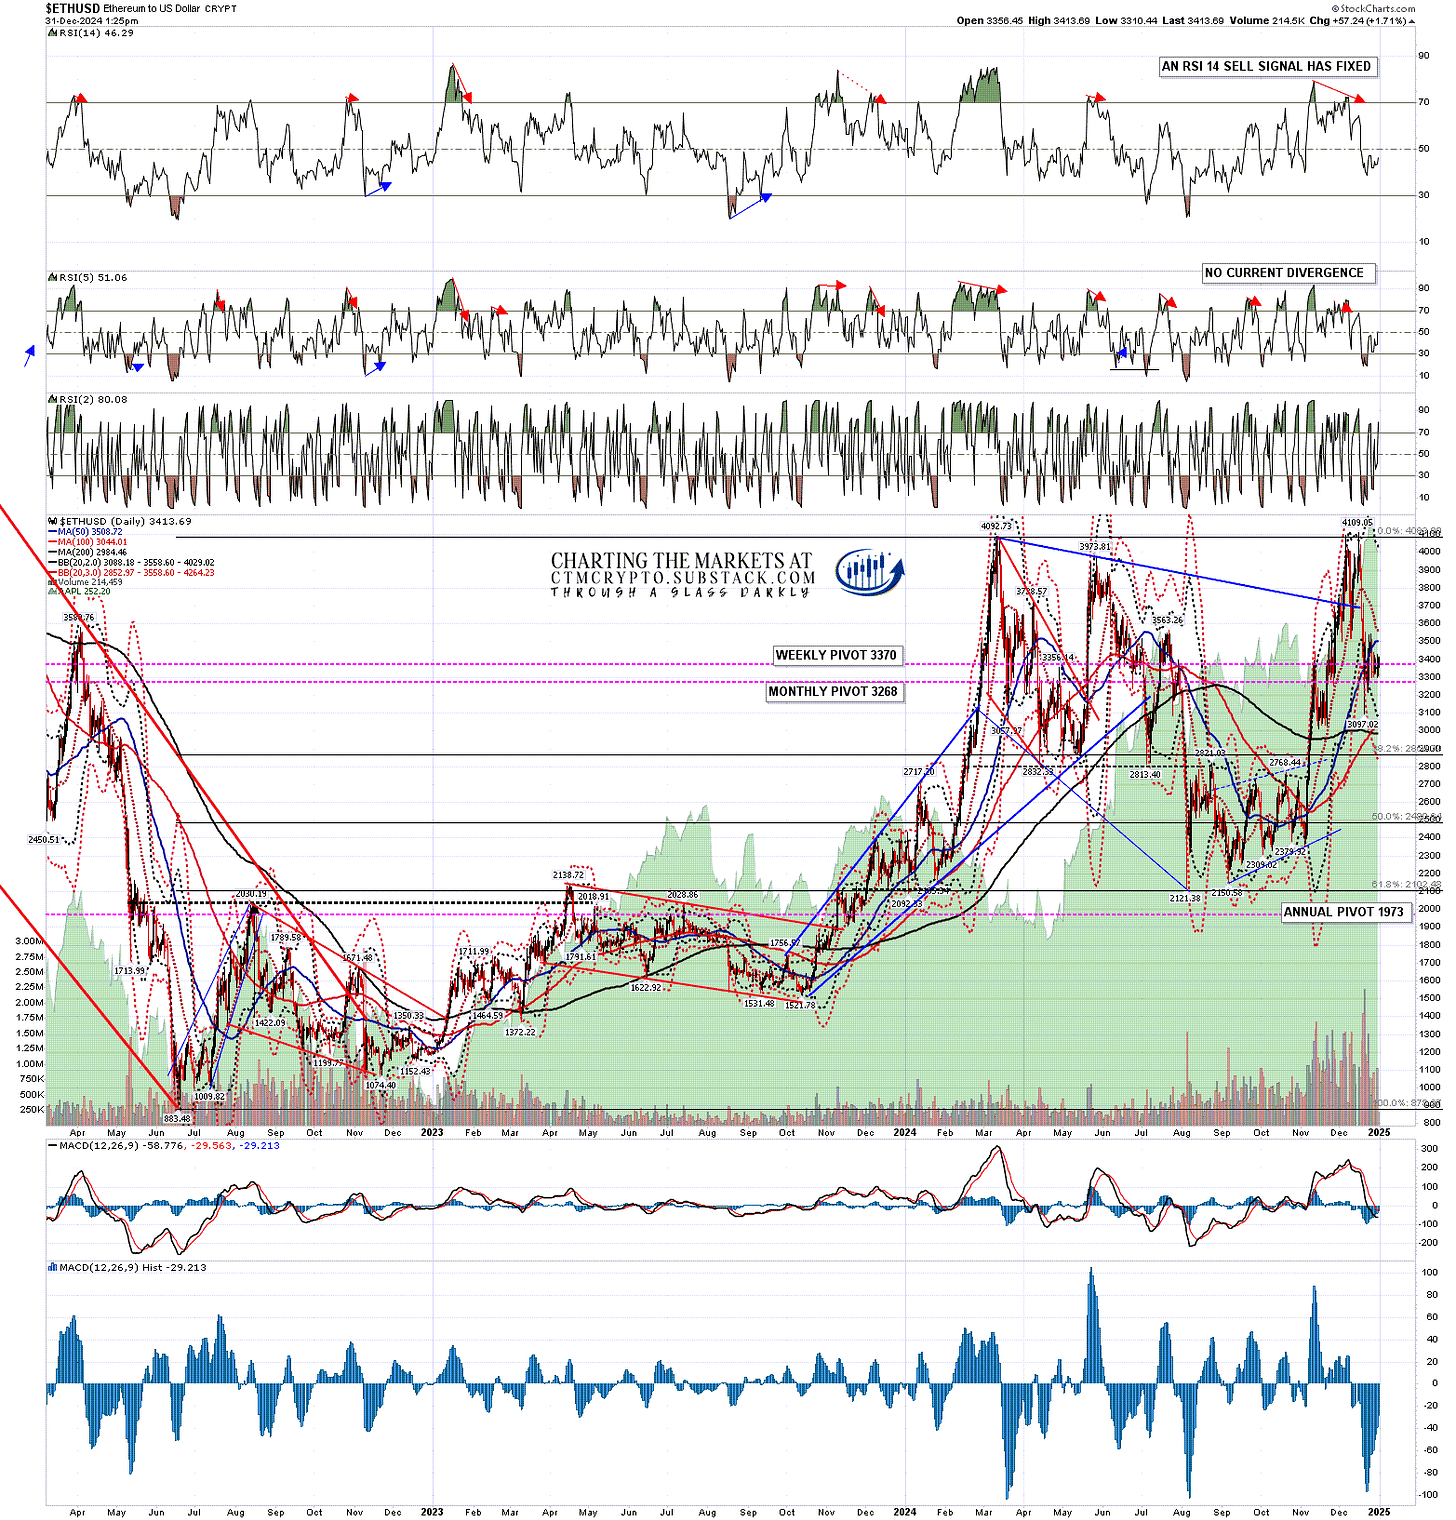
On Ethereum (ETHUSD) the daily RSI 14 sell signal has not yet reached target so at least some more downside looks likely. There is decent support again not far below at the 200dma, currently at 2984, and the weekly middle band, currently at 2948.
ETHUSD daily chart:
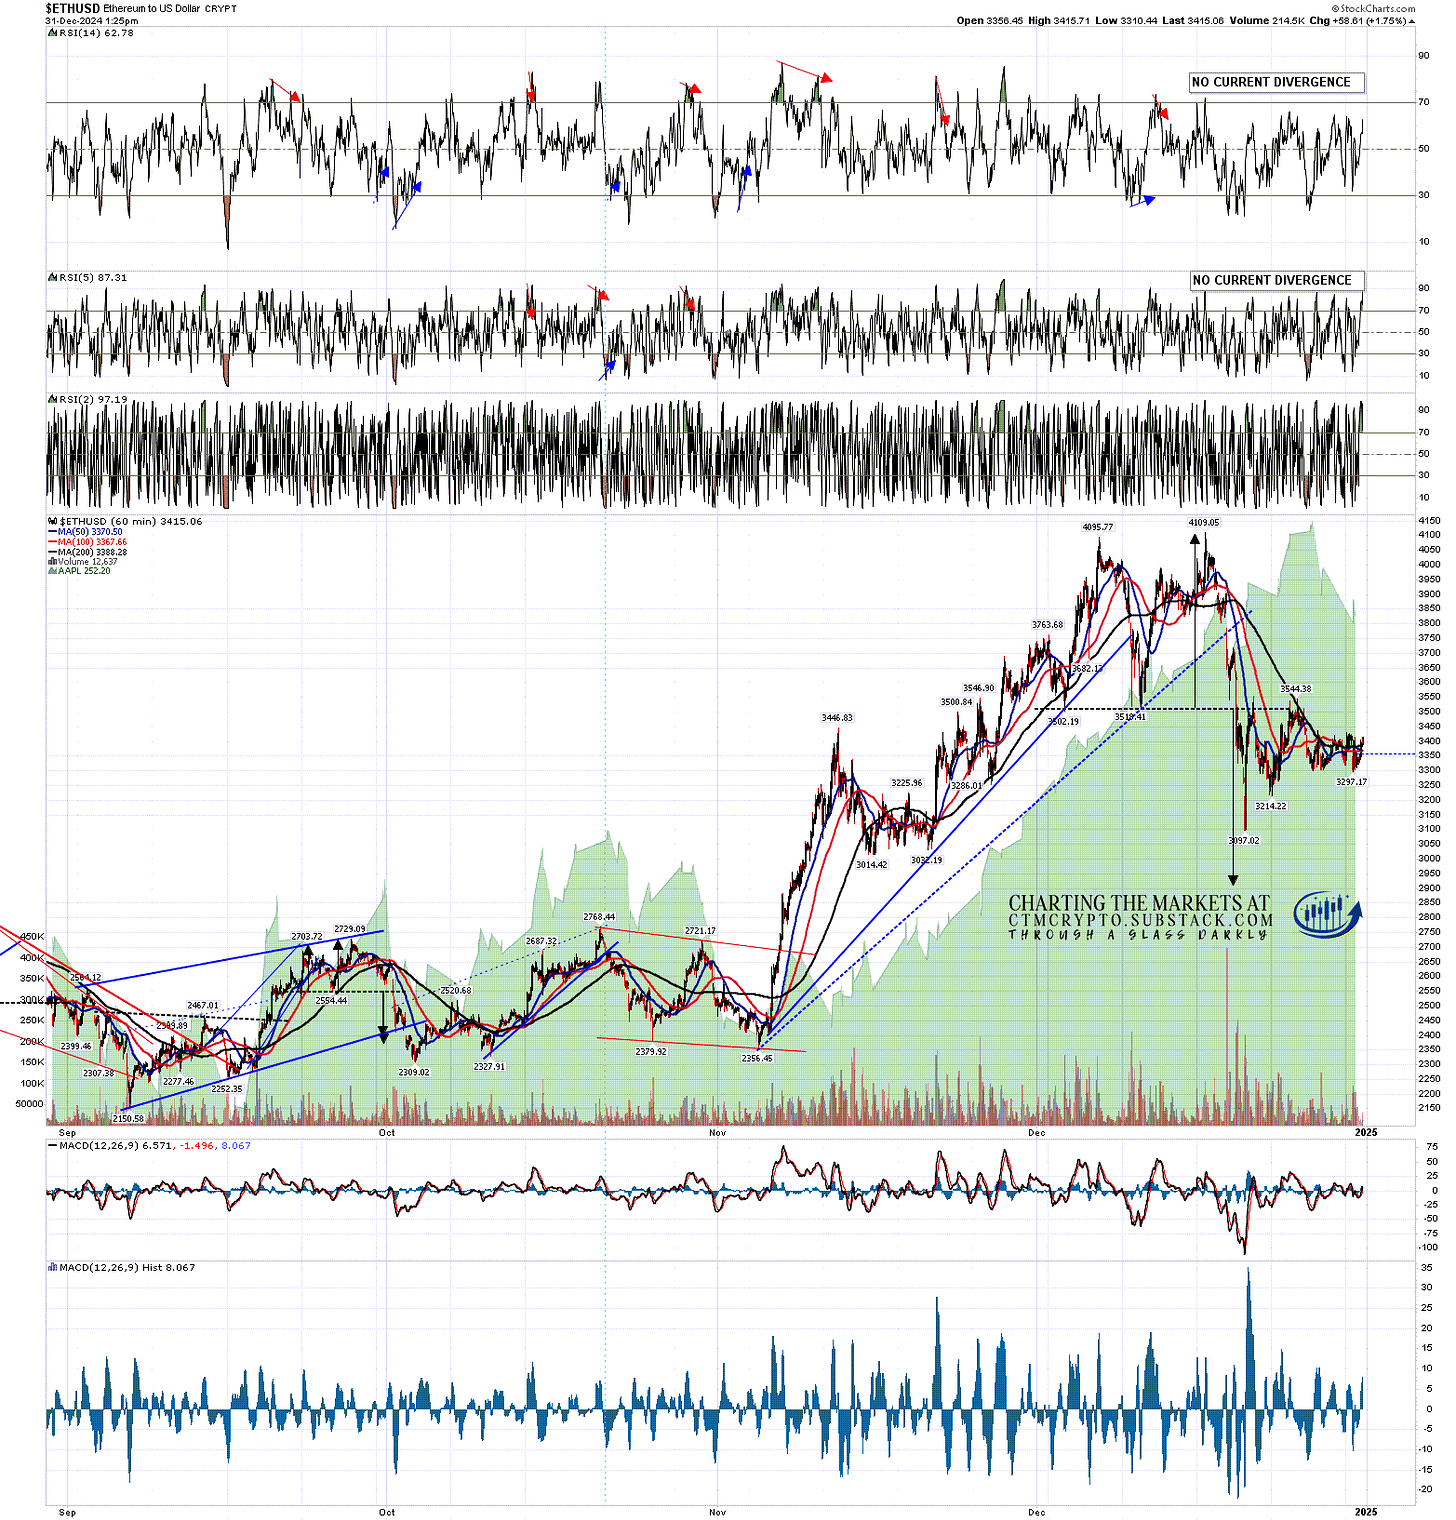
On the Ethereum hourly chart a well formed double top has already broken down with a target in the 2900 area, and I think that target has an good chance of being reached.
ETHUSD 60min chart:
The issue with these downside targets is that these three have all been moving in the same direction in the second half of December, but at different speeds, so that Bitcoin, which has held up best so far, may only be able to make the H&S target there in the event that Solana and Ethereum both break well below their 200dmas. In effect there are two obvious target areas, with the 200dma on Solana and the 200dma and double top target on Ethereum making up the first target area, and the H&S targets on Bitcoin and Solana making up the second and lower target area. Very good odds we see the higher target areas reached, and still decent odds that we see an extension from there down to the lower target areas.
Everyone have a great New Year’s Eve and I wish you all a happy and prosperous 2025. I have a strong feeling that it is going to be a very interesting year. :-)
If you’d like to see more of these posts and the other Crypto videos and information I post, please subscribe for free to my Crypto substack.
I do a premarket video every day on Crypto at 9.15am EST. If you’d like to see those I post the links every morning on my twitter, and the videos are posted shortly afterwards on my Youtube channel.
I'm also to be found at Arion Partners, though as a student rather than as a teacher. I've been charting Crypto for some years now, but am learning to trade and invest in them directly, and Arion Partners are my guide around a space that might reasonably be compared to the Wild West in one of their rougher years.


No comments:
Post a Comment