In my last post on Wednesday I was looking at the move up from Tuesday afternoon’s low and noting that the almost complete absence of participation on DIA and IWM was a serious concern, as on a pullback on the tech-led rally, we might then see significant support breaks on Dow and Russell stocks.
At the same time the new inflation figures landed and, not to beat around the bush, they sucked, with a 0.2% rise in inflation led by food prices. The consensus seems to be that the Fed will cut rates this month anyway, but I’m doubtful about that, and regardless of that, the rally in bonds seems to have failed to reach the obvious targets and to be resuming the larger downtrend, so in practical terms interest rates, as delivered in bond yields, are already back on an upward path.
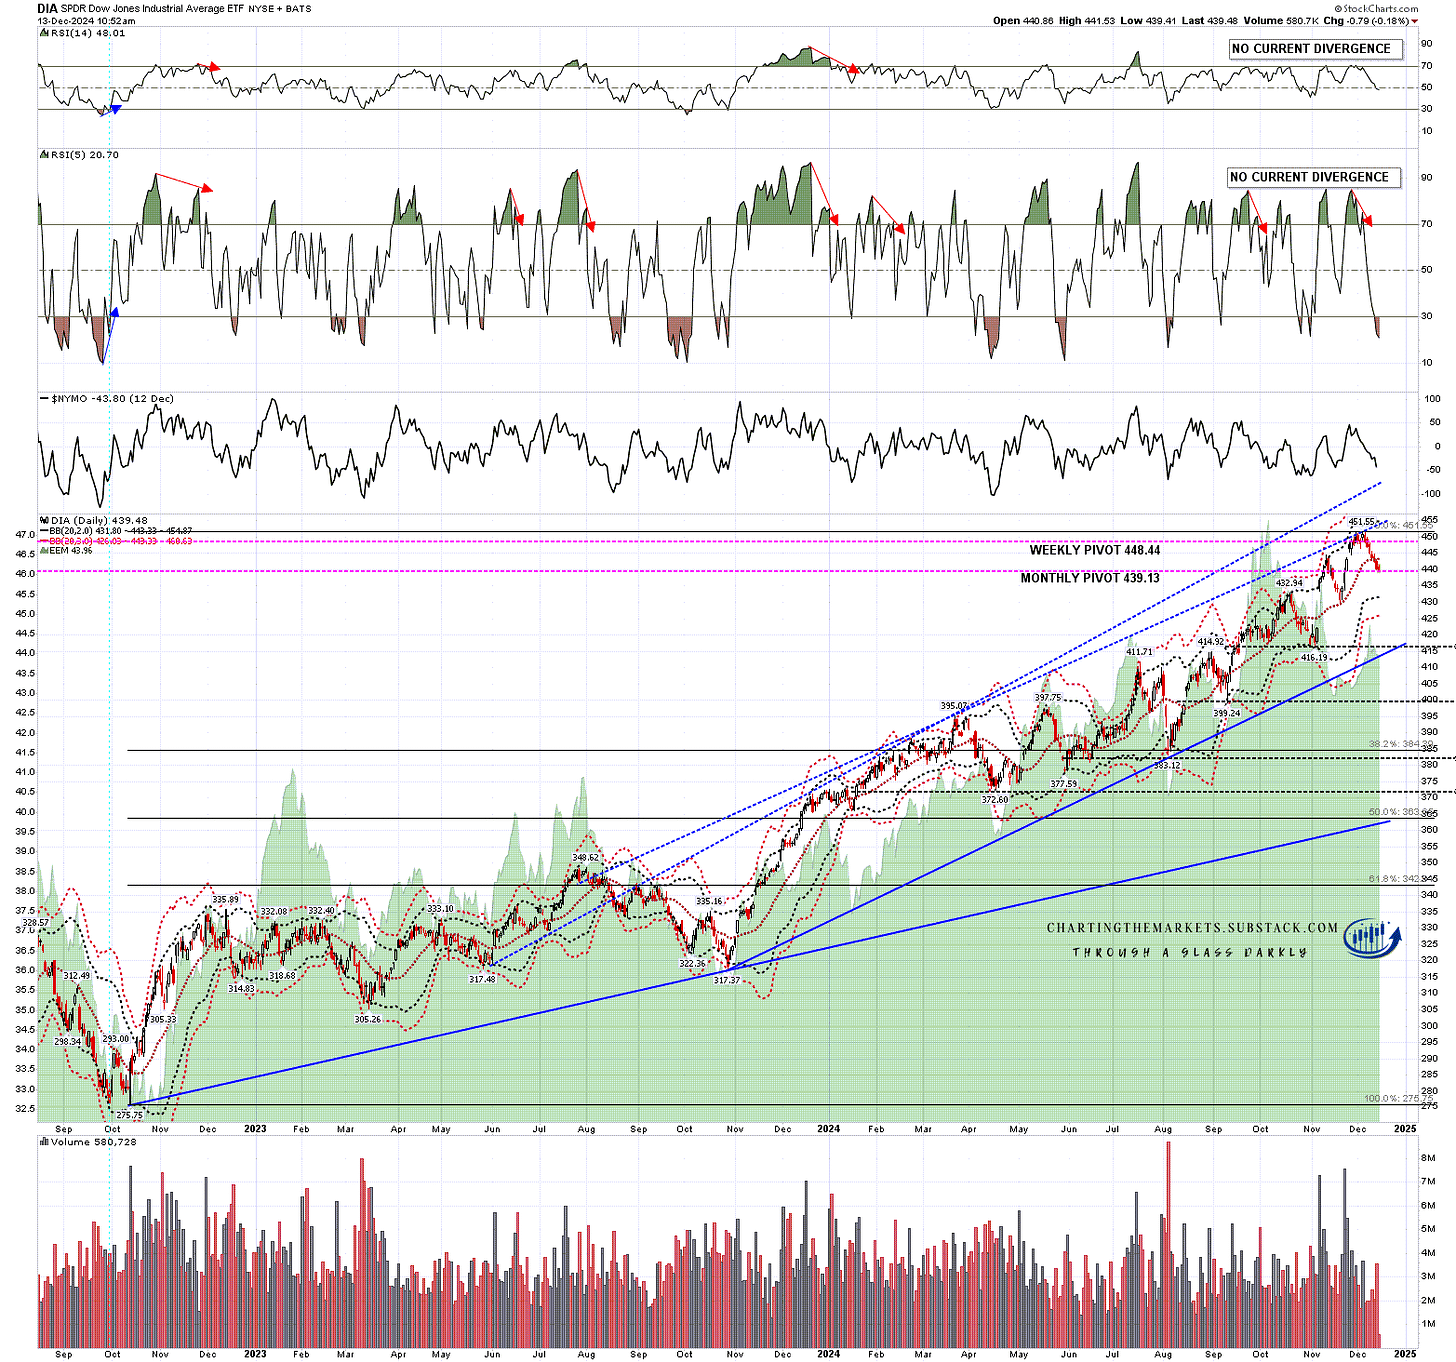
We saw those support breaks yesterday with both DIA and IWM breaking their daily middle bands hard. DIA is currently testing the monthly pivot at 439.13, and next support levels below that are the daily lower band, currently at 433, and a possible H&S neckline at the mid-November low at 429.64. A break below though might well then look for the November low at 416.19, a strong match with rising support from the October 2023 low currently in the same area.
DIA daily chart:
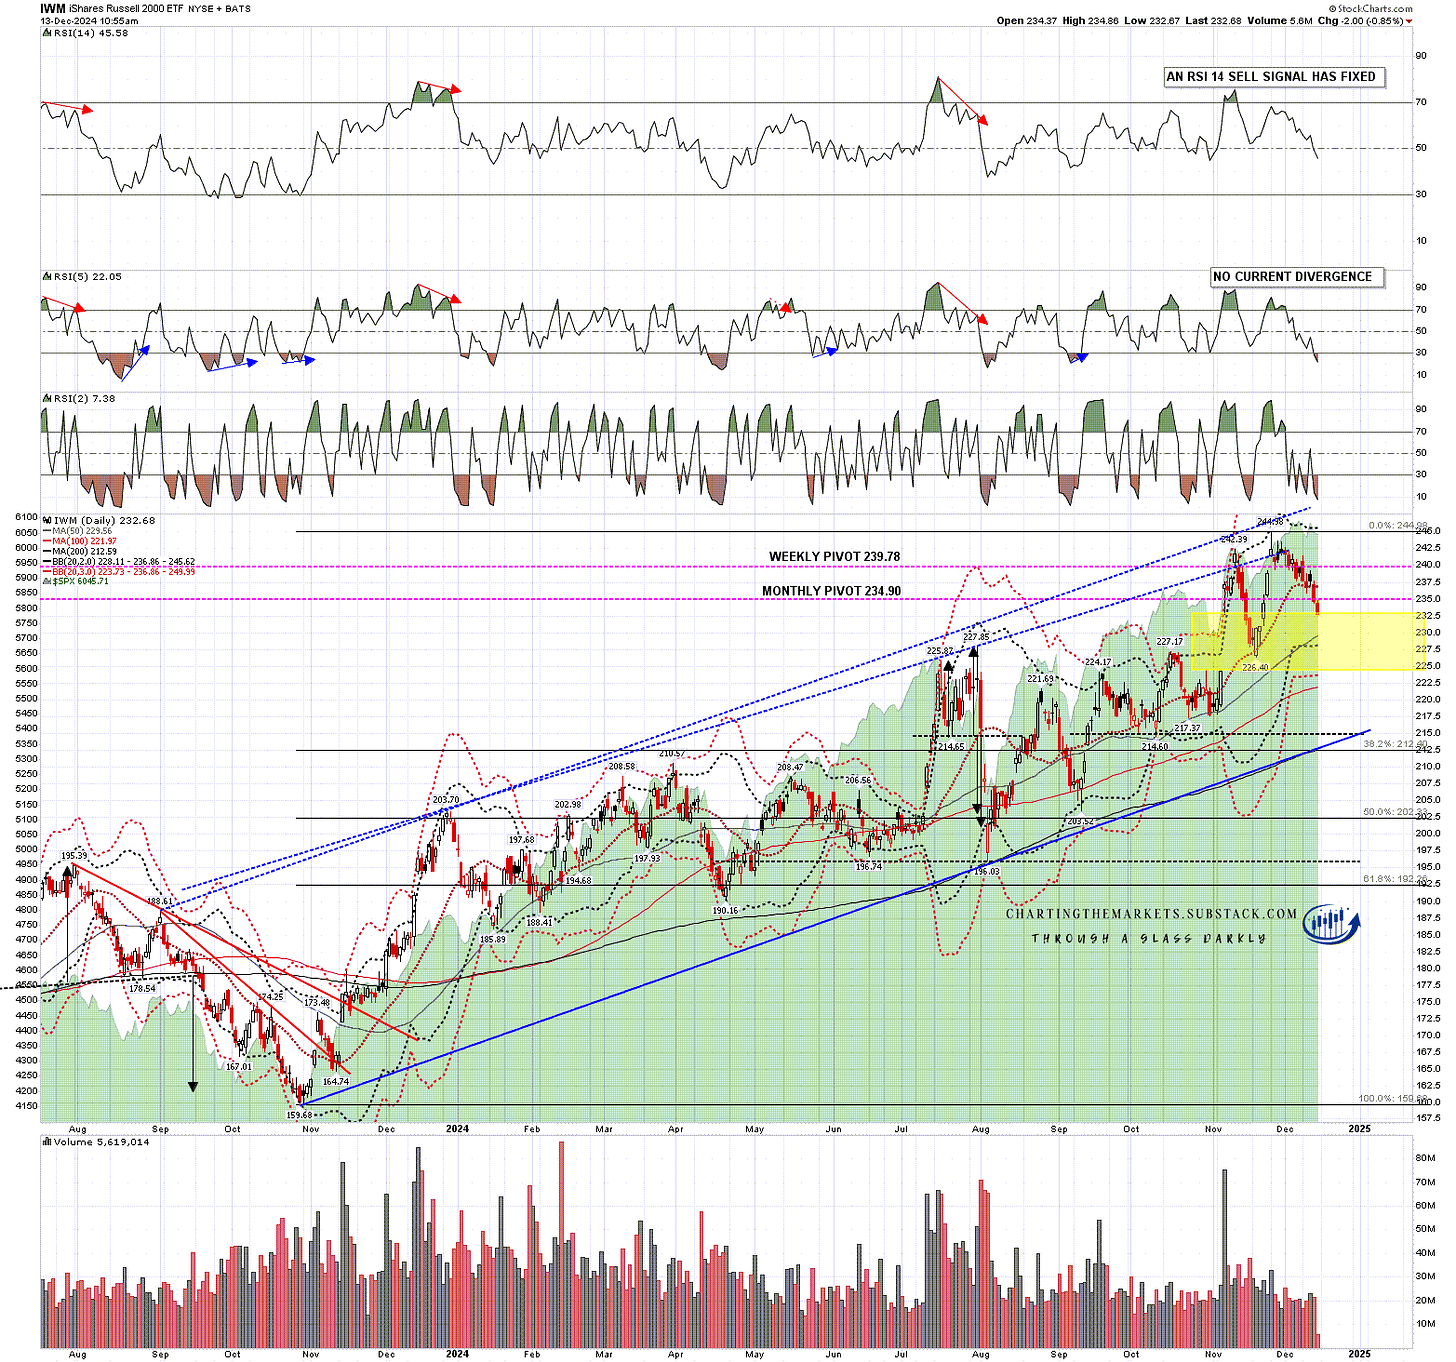
IWM is testing the monthly pivot at 234.90 and, on a break below, the next support levels are at the daily lower band, currently at 237, and the mid-November low at 217.37. Rising support from the Oct 2023 low, currently in the 213 area, could be a target but there’s no current reason to think it is.
IWM daily chart:
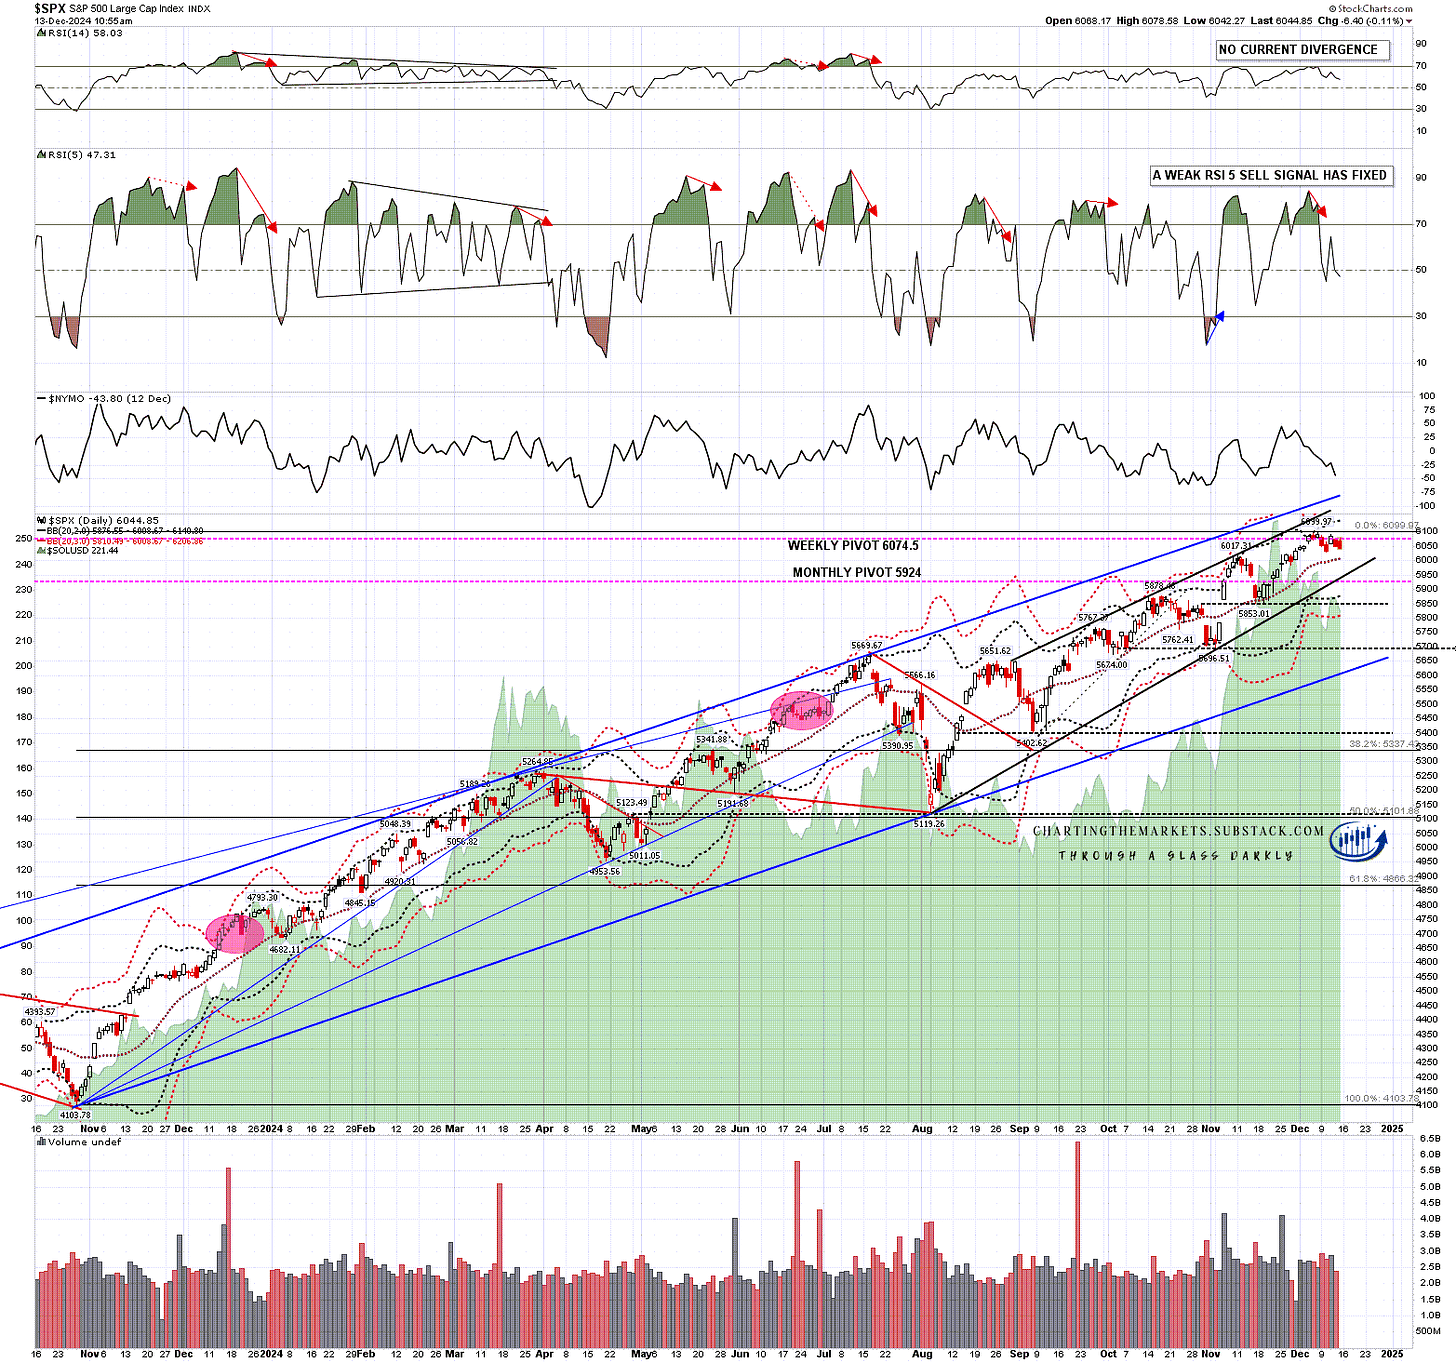
SPX hasn’t tested any important support levels yet and the obvious levels below are the daily middle band, currently at 6008, rising support from the August low in the 5950 area, the middle and early November lows at 5853 and 5696 respectively, then the main rising support trendline from the October 2023 low, currently in the 5610 area.
SPX daily chart:
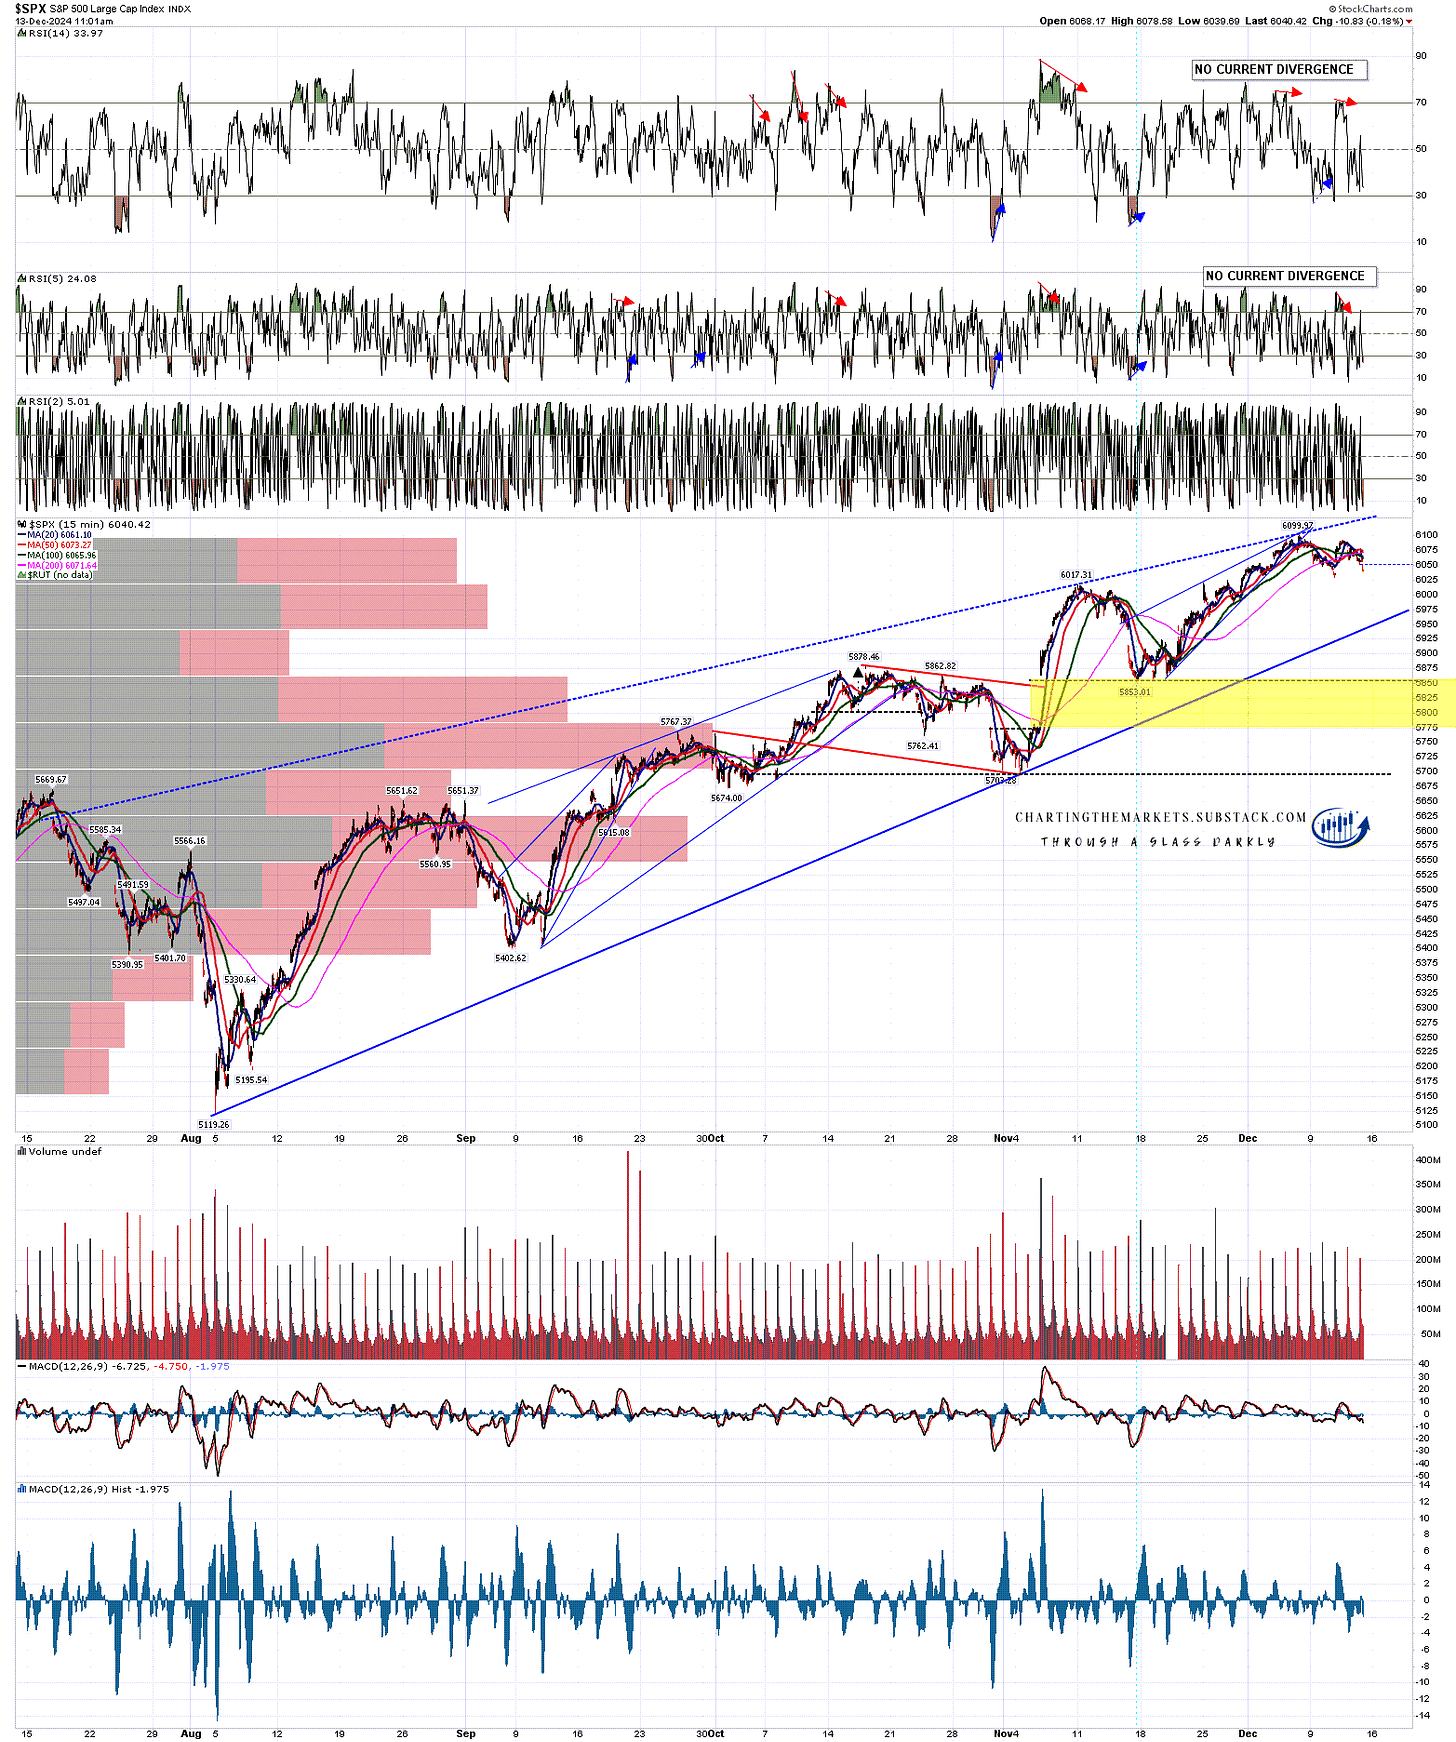
If we are going to see a larger decline there is still a decent case for retesting the all time high on SPX first to set up a small double top.
SPX 15min chart:
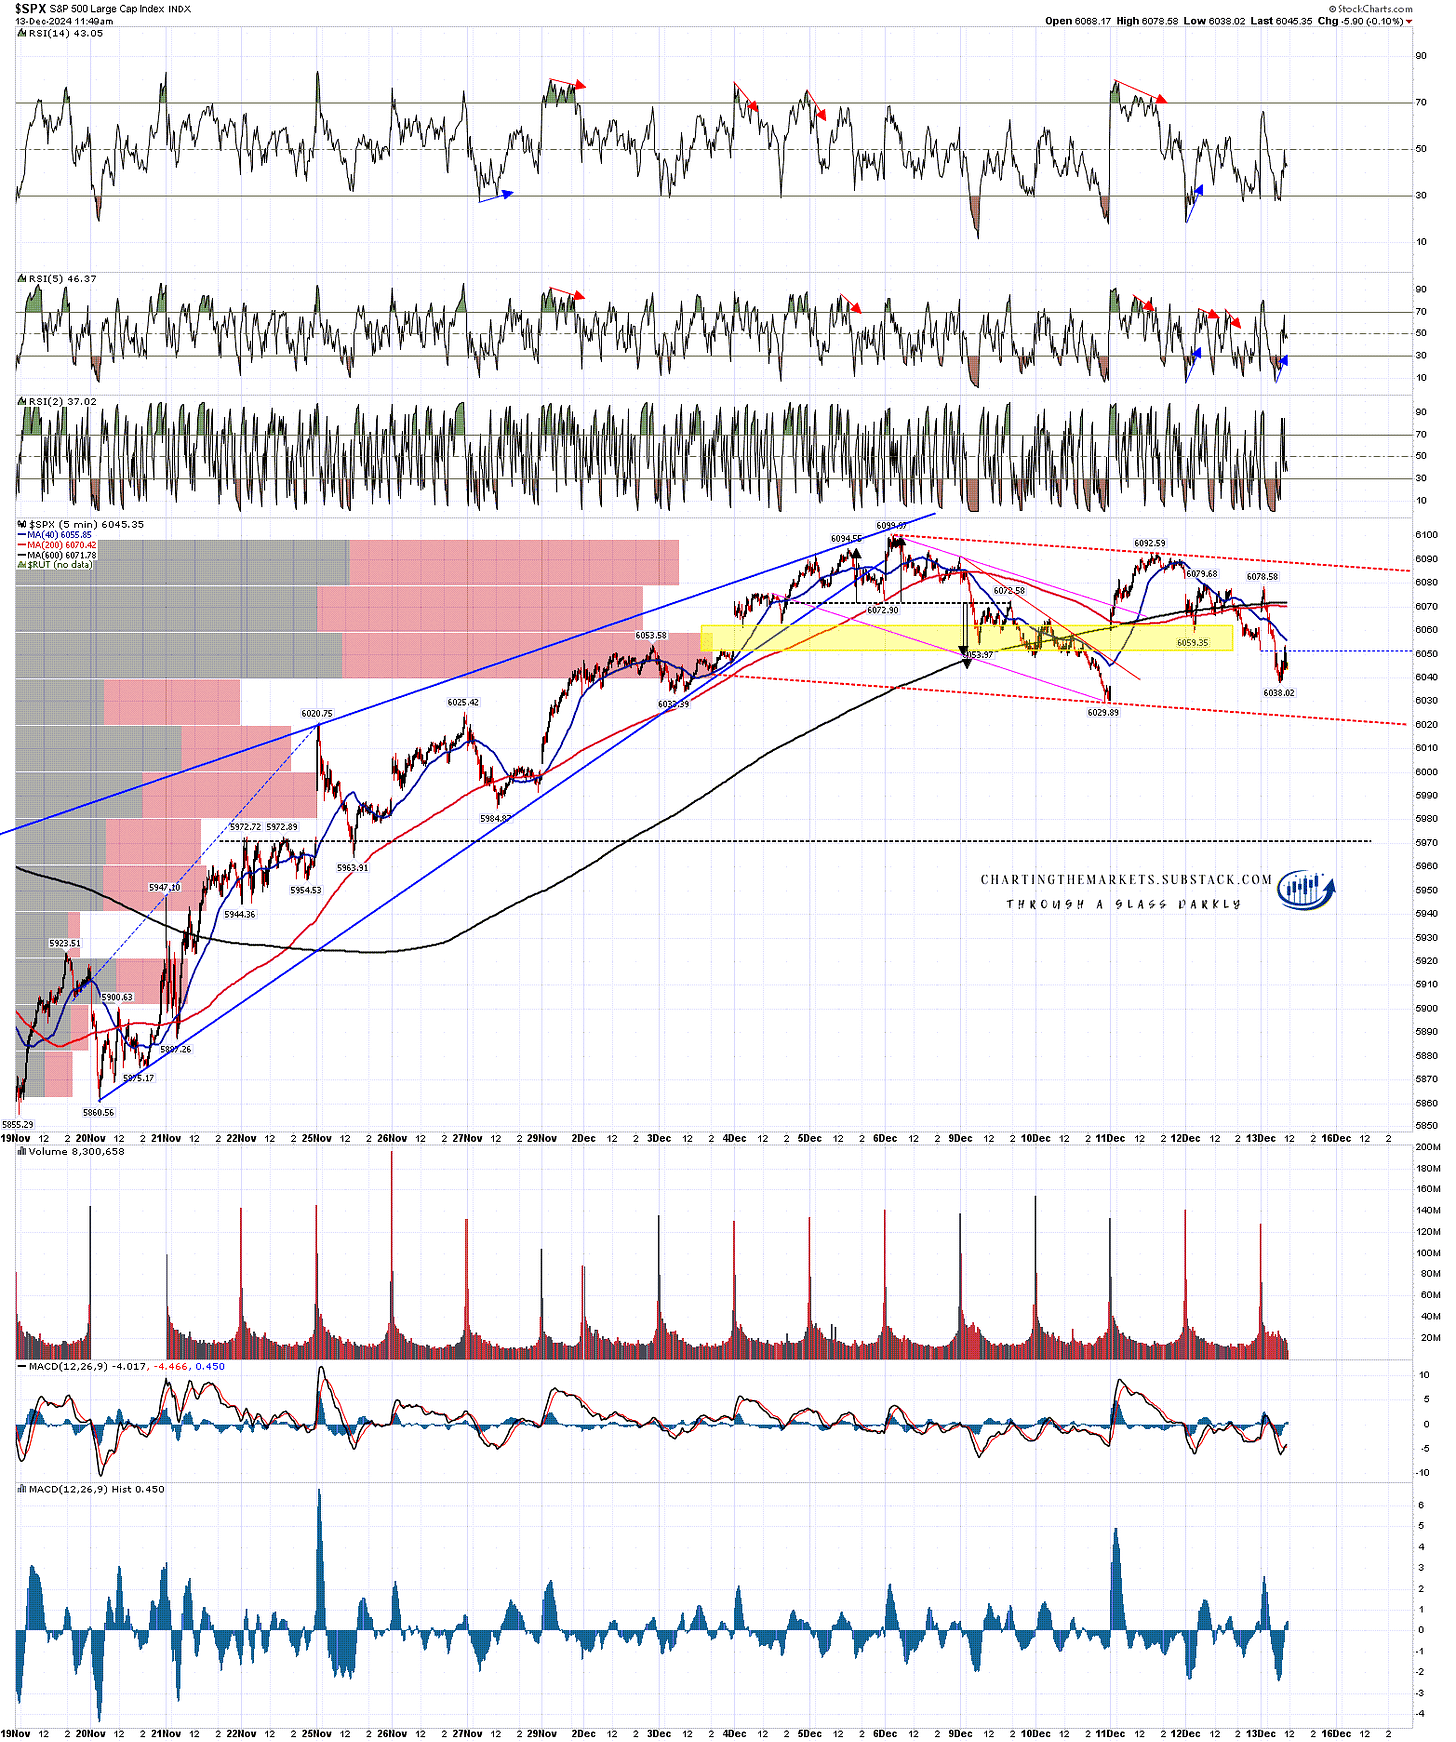
There is a possibility that SPX might be forming a larger bull flag channel to set up that high retest. If so the obvious flag support is currently in the 6023 area.
SPX 5min chart:
I’m expecting some more upside on US indices, maybe into Xmas, and if not then likely into January, though there should be a larger retracement in that period somewhere and that could be starting here.
The closer we come to inauguration the more I’m also going to be looking at the incoming administration and the policies that are being talked about for the first 100 days of the new administration. Tariffs, Ukraine and others may make this one of the most interesting years on the markets that anyone can remember. I am doubtful about equity markets seeing much upside next year as valuations look very stretched going into a year where the news stream is likely to be turbulent, and interest rates may be on an upward track all year. We'll see.
If you like my analysis and would like to see more, please take a free subscription at my chartingthemarkets substack, where I publish these posts first.
I also do a premarket video every day on equity indices, bonds, currencies, energies, precious commodities and other commodities at 8.45am EST. If you’d like to see those I post the links every morning on my twitter, and the videos are posted shortly afterwards on my Youtube channel.

No comments:
Post a Comment