In my last post on Friday I was looking at the support breaks on Dow & Russell and considering the wider implications of those. I was also leaning strongly towards the setup on SPX being a bull flag forming.
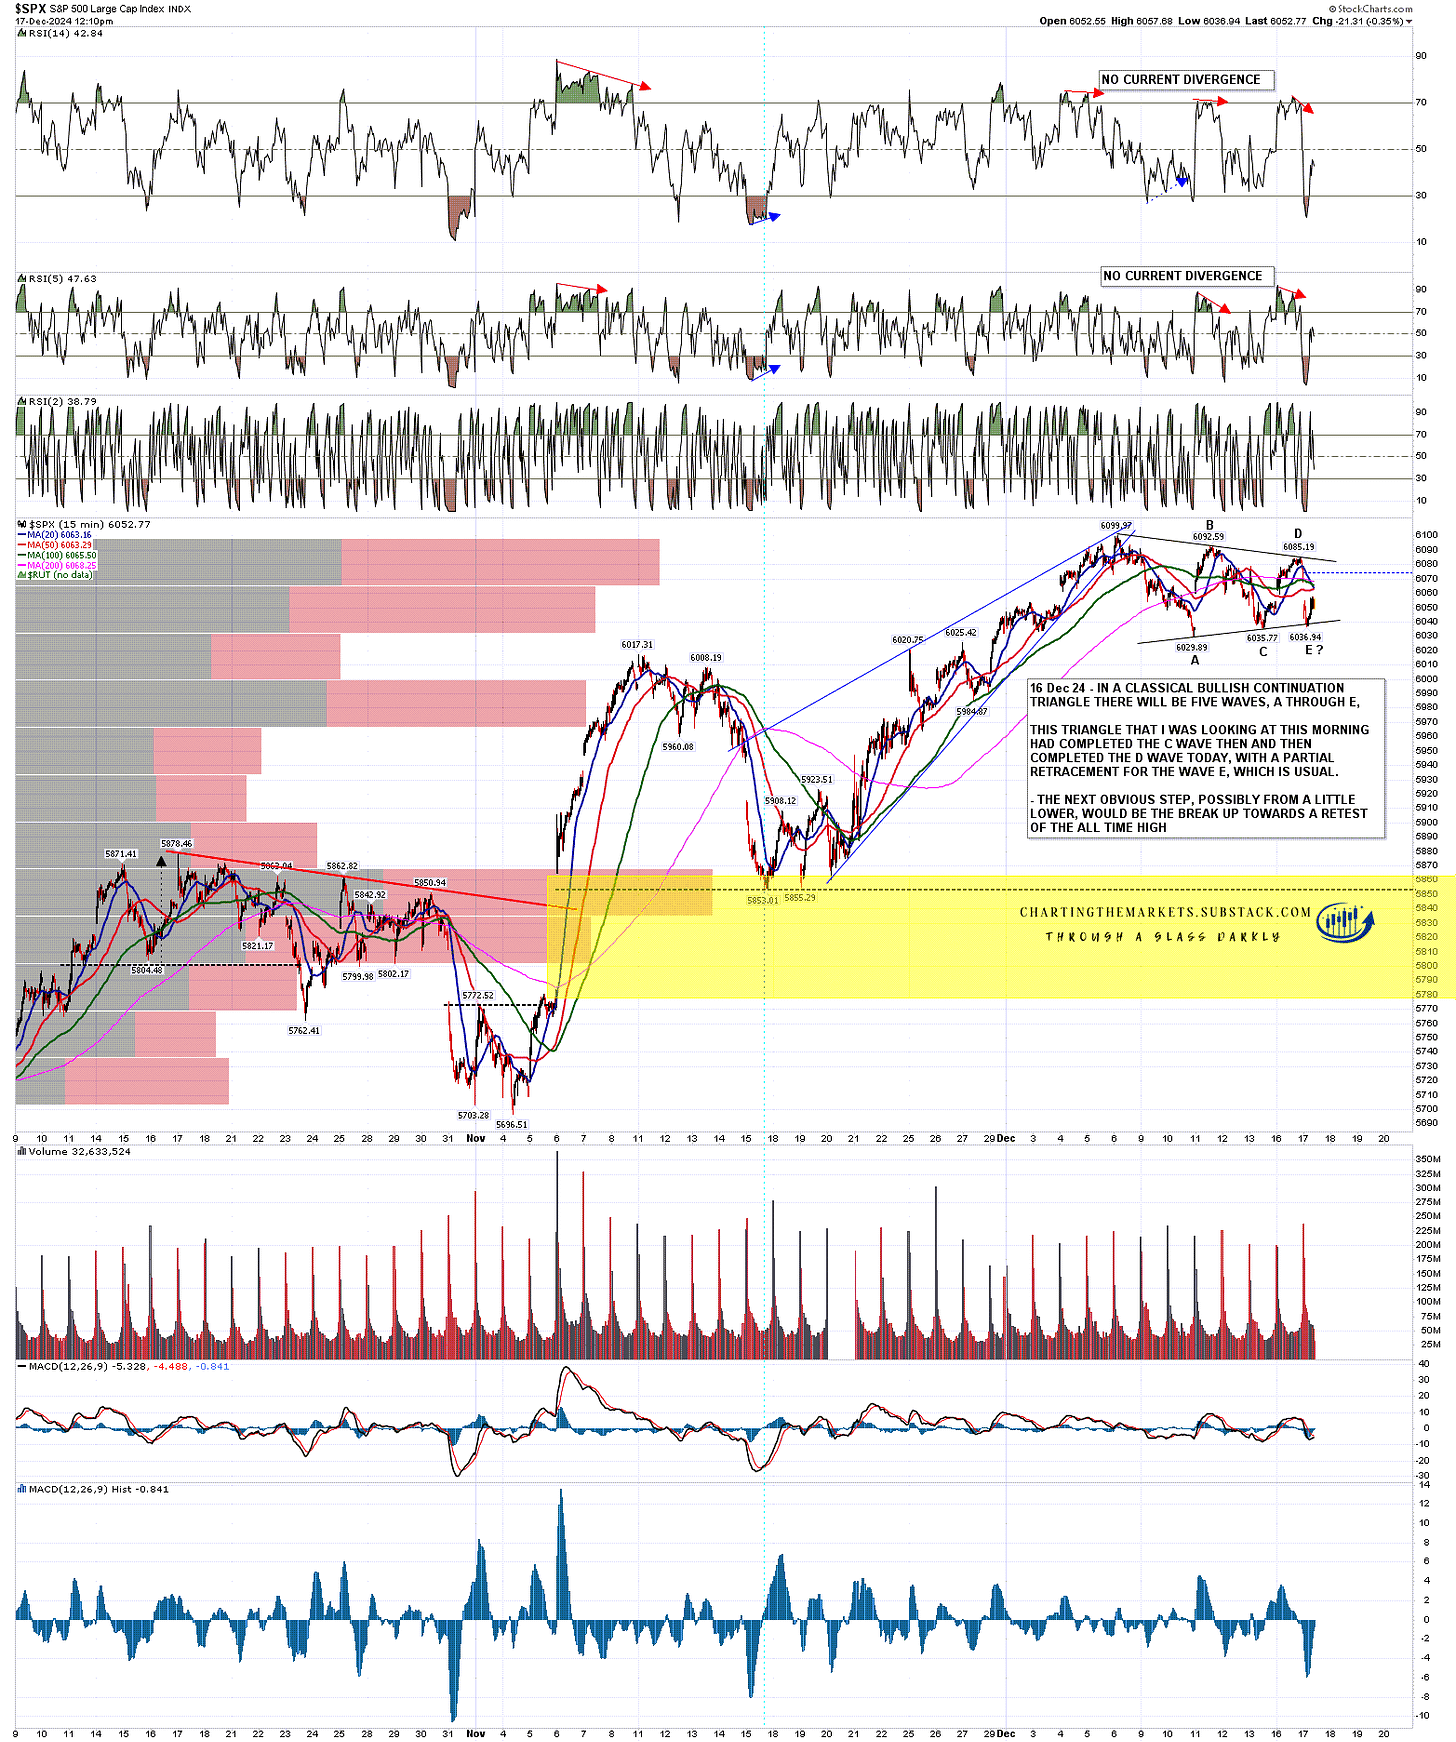
Since then a very nice bullish triangle has formed on SPX and, 70% of the time, these will break up towards the target, in this case a retest of the all time high at 6099.97. I wrote the comments on the chart when I posted it on my twitter last night and since then SPX has broken slightly below triangle support, which is a concern, but is rallying well from there so far. Assuming this morning’s low holds, the bullish scenario still looks nice.
SPX 15min chart:
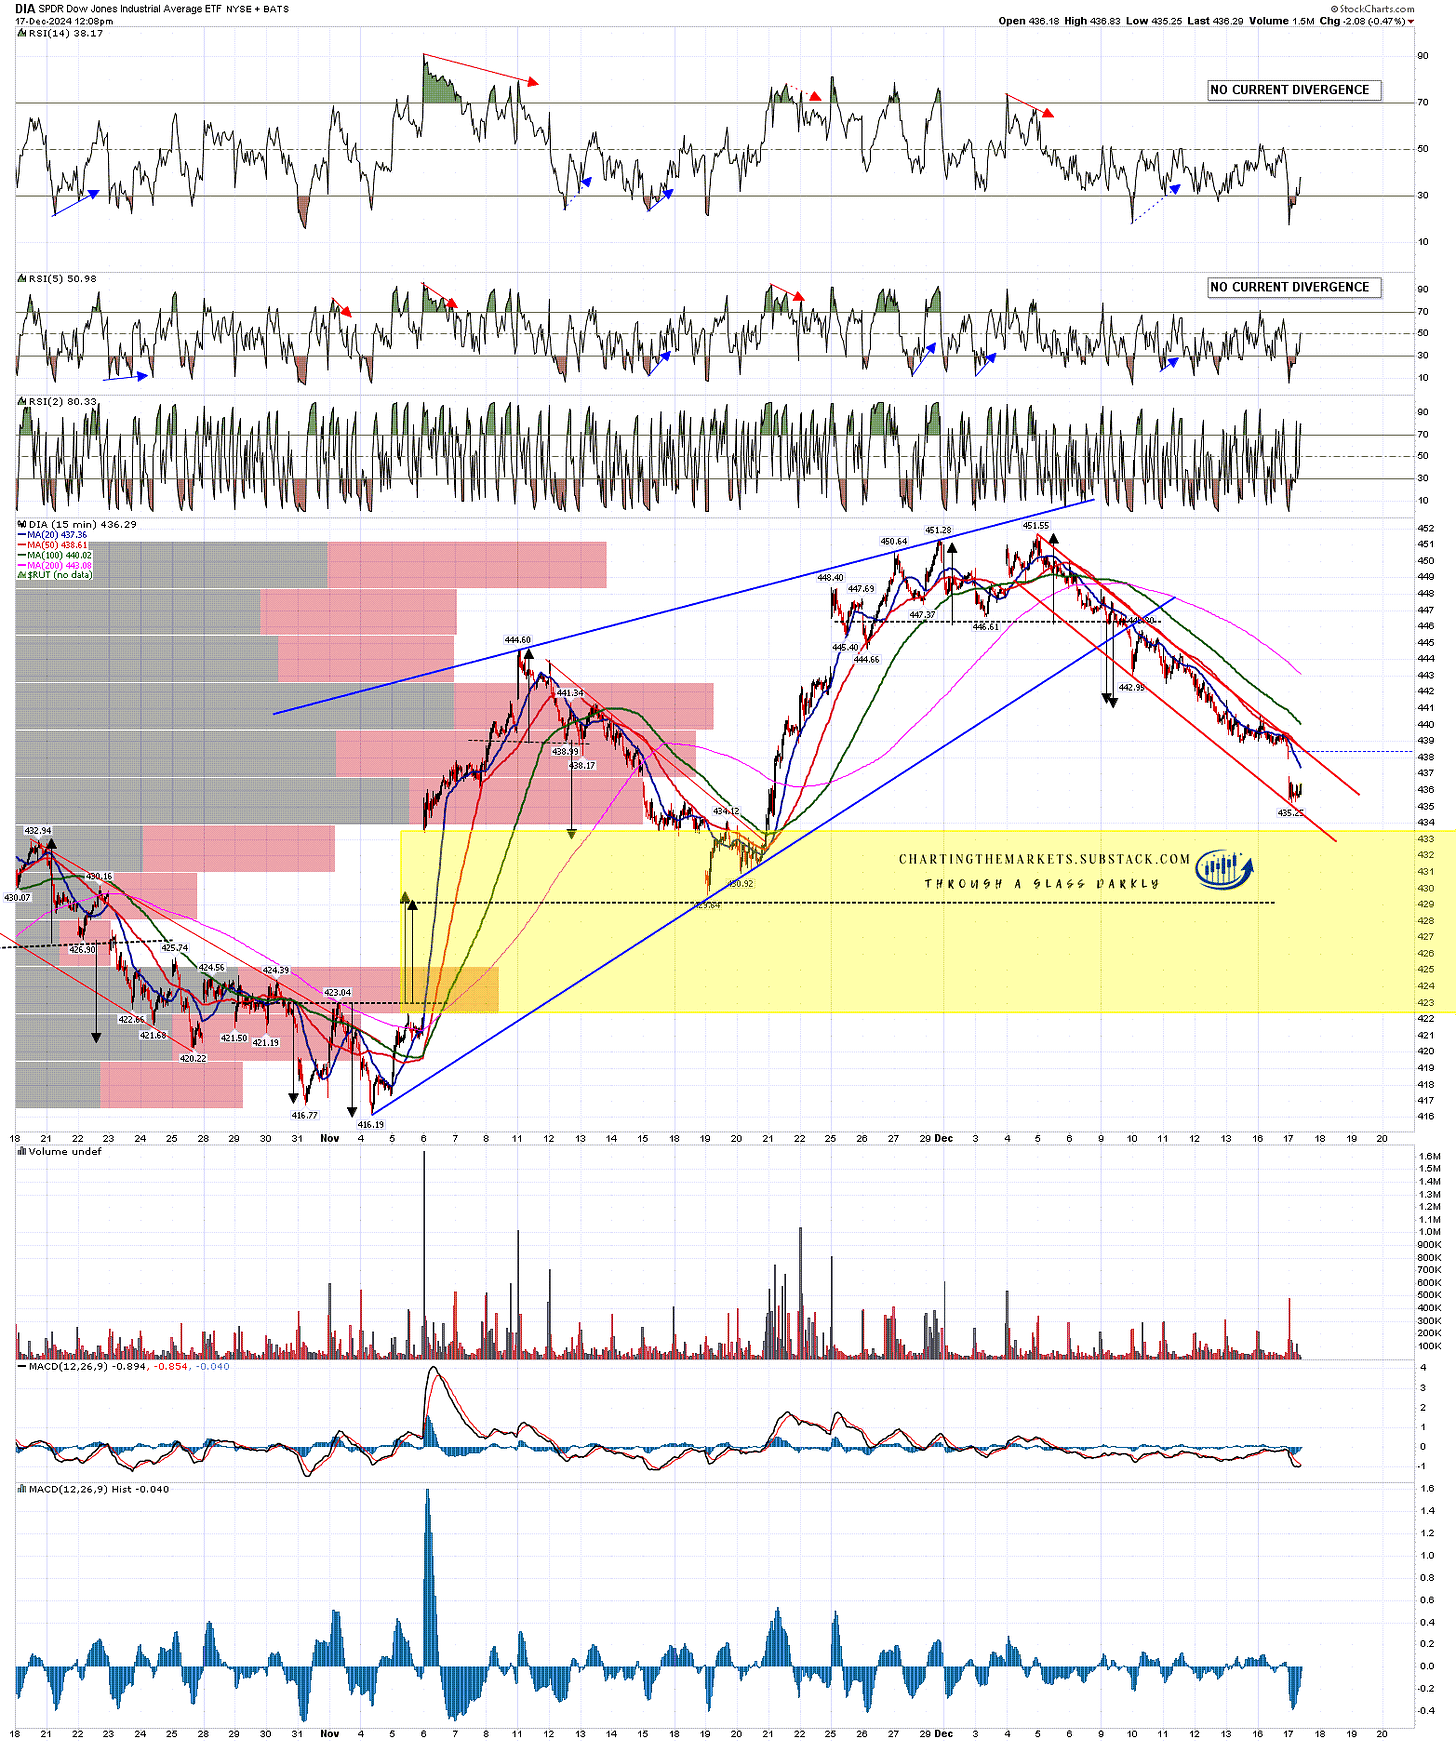
On Dow there is now a very nice falling channel, though it is steep and narrow enough that I wouldn’t be surprised to see a rally from here that preceded another leg down. Nonetheless this may be a bull flag channel rather than part of a larger downside pattern.
DIA 15min chart:
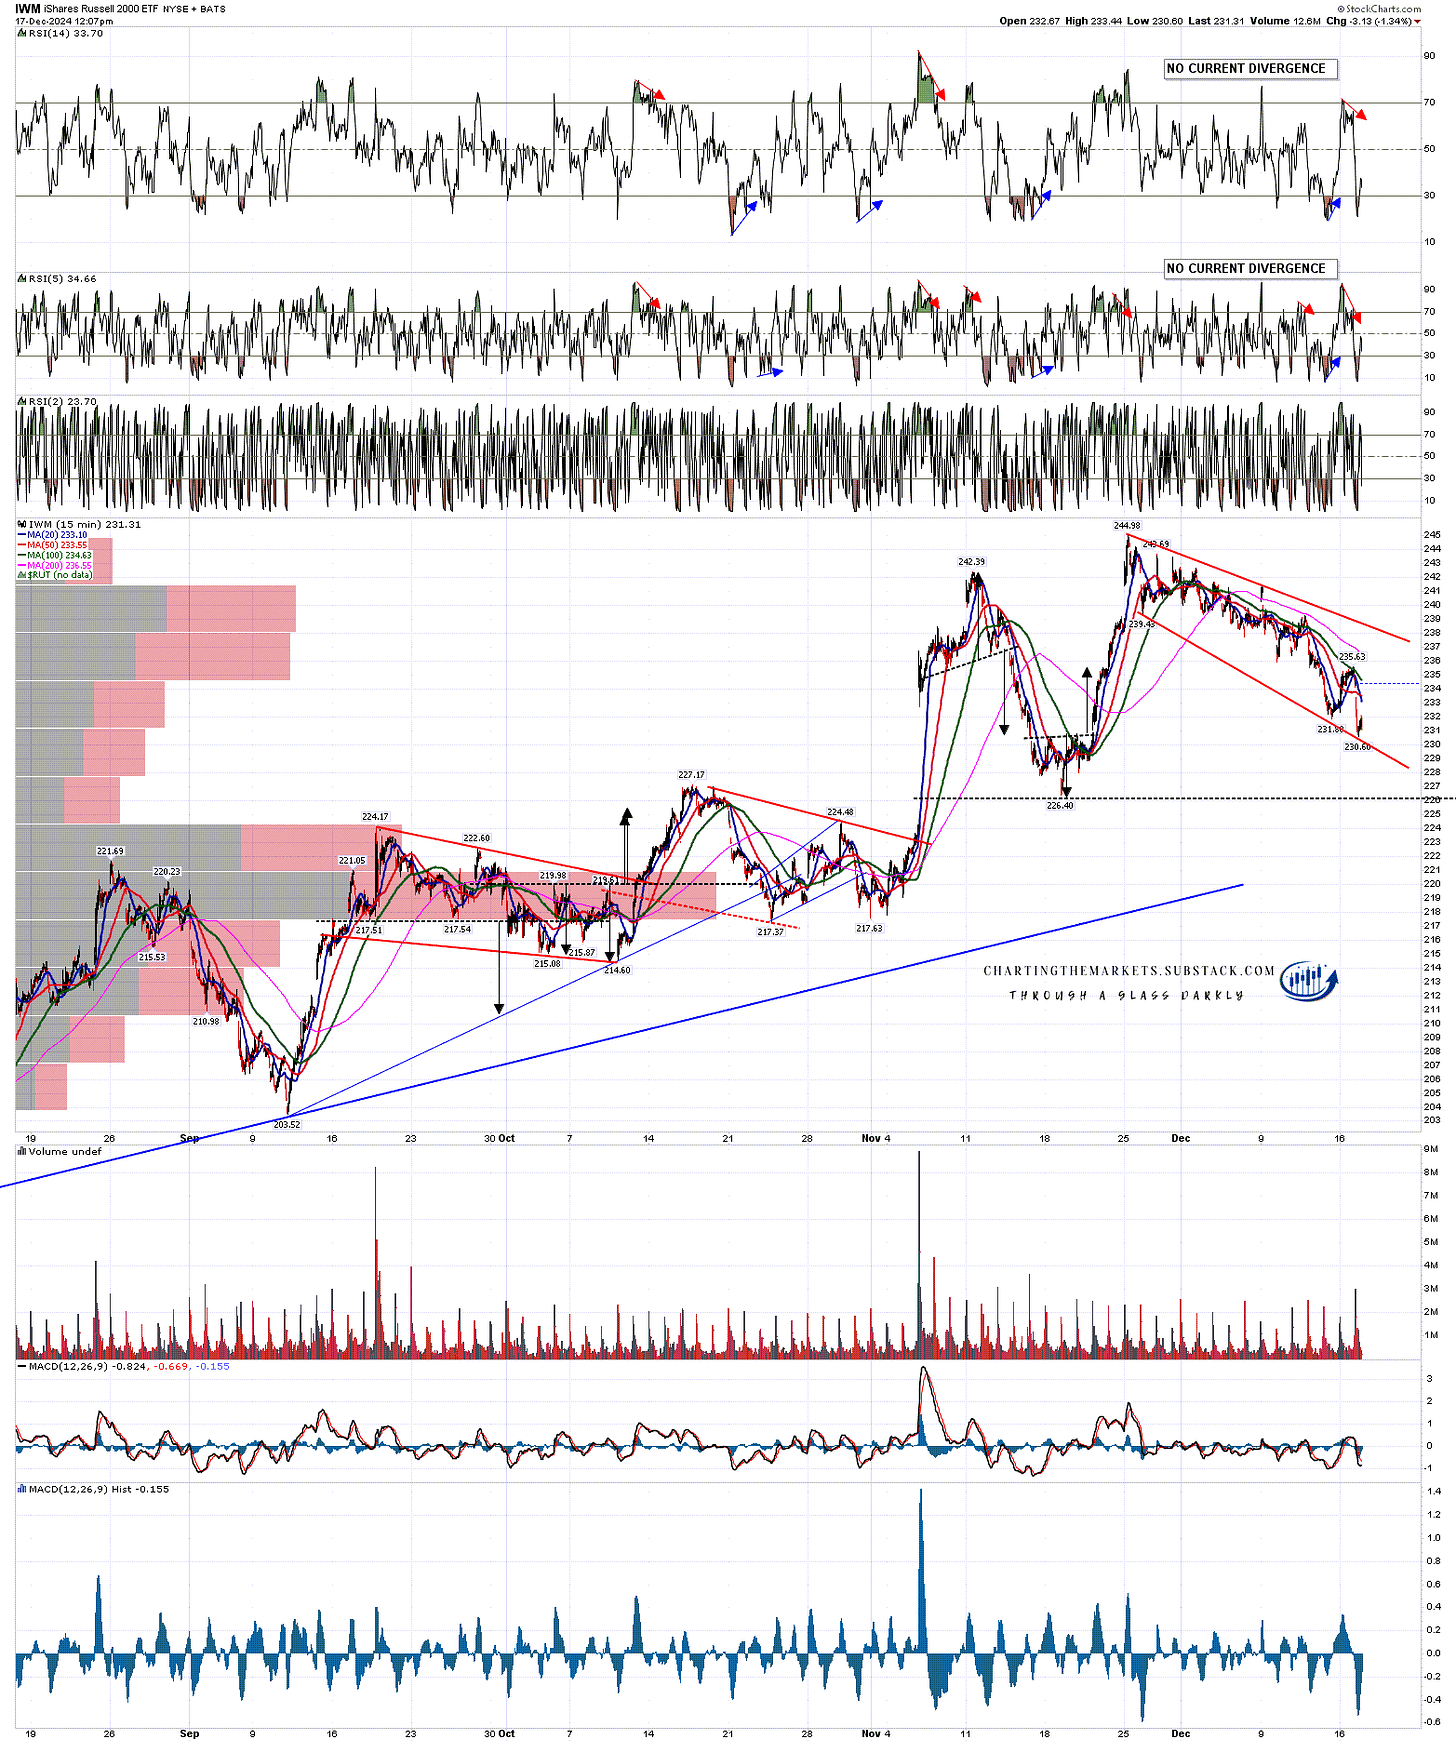
The initial bull flag channel on IWM broke down but I now have a decent looking falling megaphone that could also be a bull flag. I’ll be watching this too.
If we see further breaks down from here the picture for the rest of December looks grimmer as the current move up has been mostly tech and I was reading at the weekend that the move up on equity indices since the start of November has been achieved while the majority of index stocks outside NDX have closed down most days.
I’d love to see one more push up into new highs across the board, but we may not see it.
IWM 15min chart:
If we do see a decent move up from here I’m not really looking for much more than high retests on DIA or IWM, but I have more ambitious targets for SPX and NDX, taking them to levels that might then hold as resistance for much or all of next year.
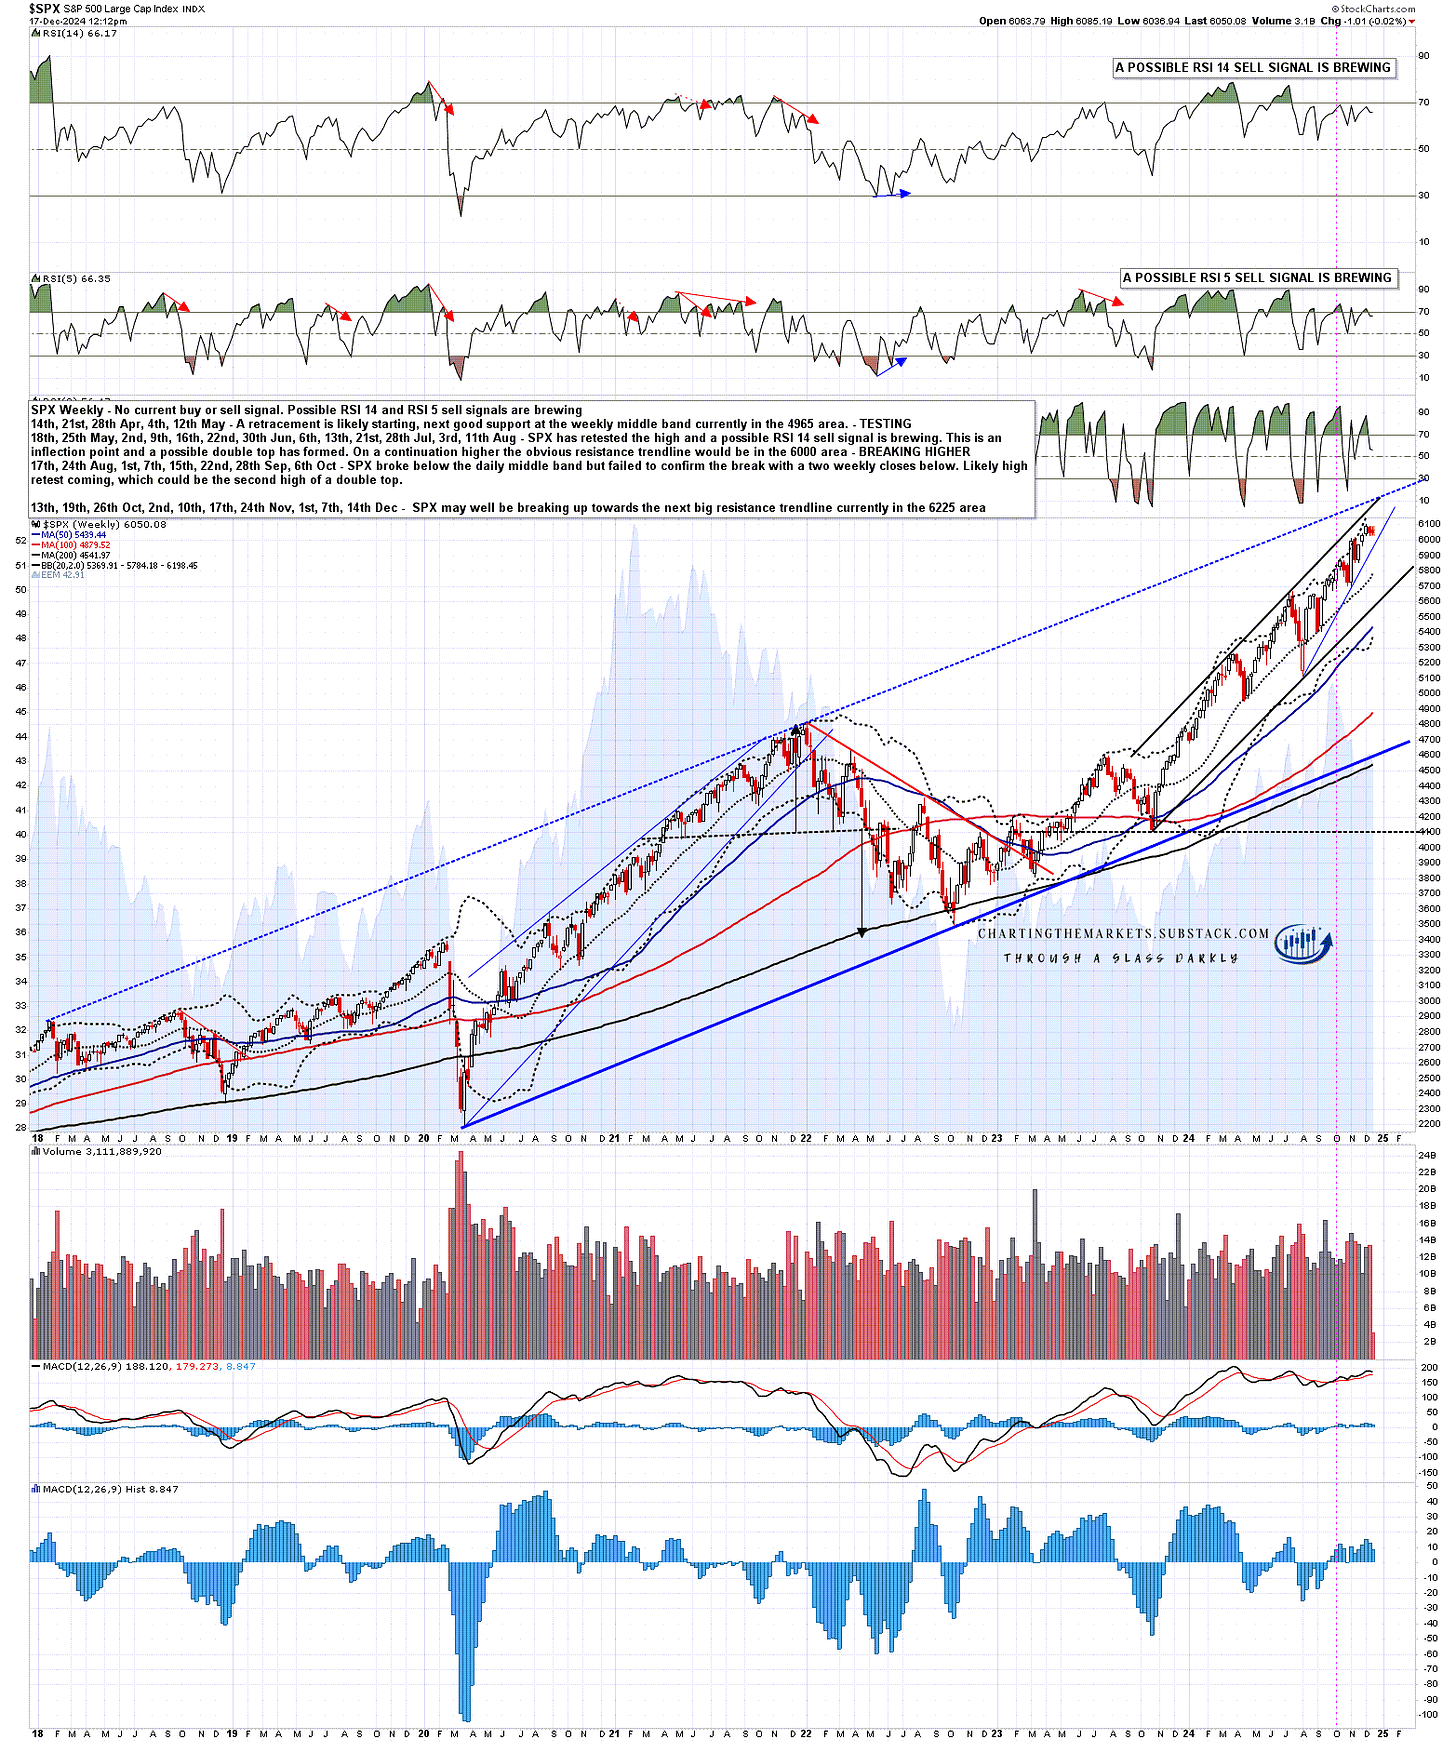
On SPX that target is the obvious resistance trendline for the move up from the 2020 low. That is currently in the 6225 area and, if hit, I’m thinking we might see either a repeat of 2022 as an extended bull flag forms, or a larger high.
SPX weekly chart:
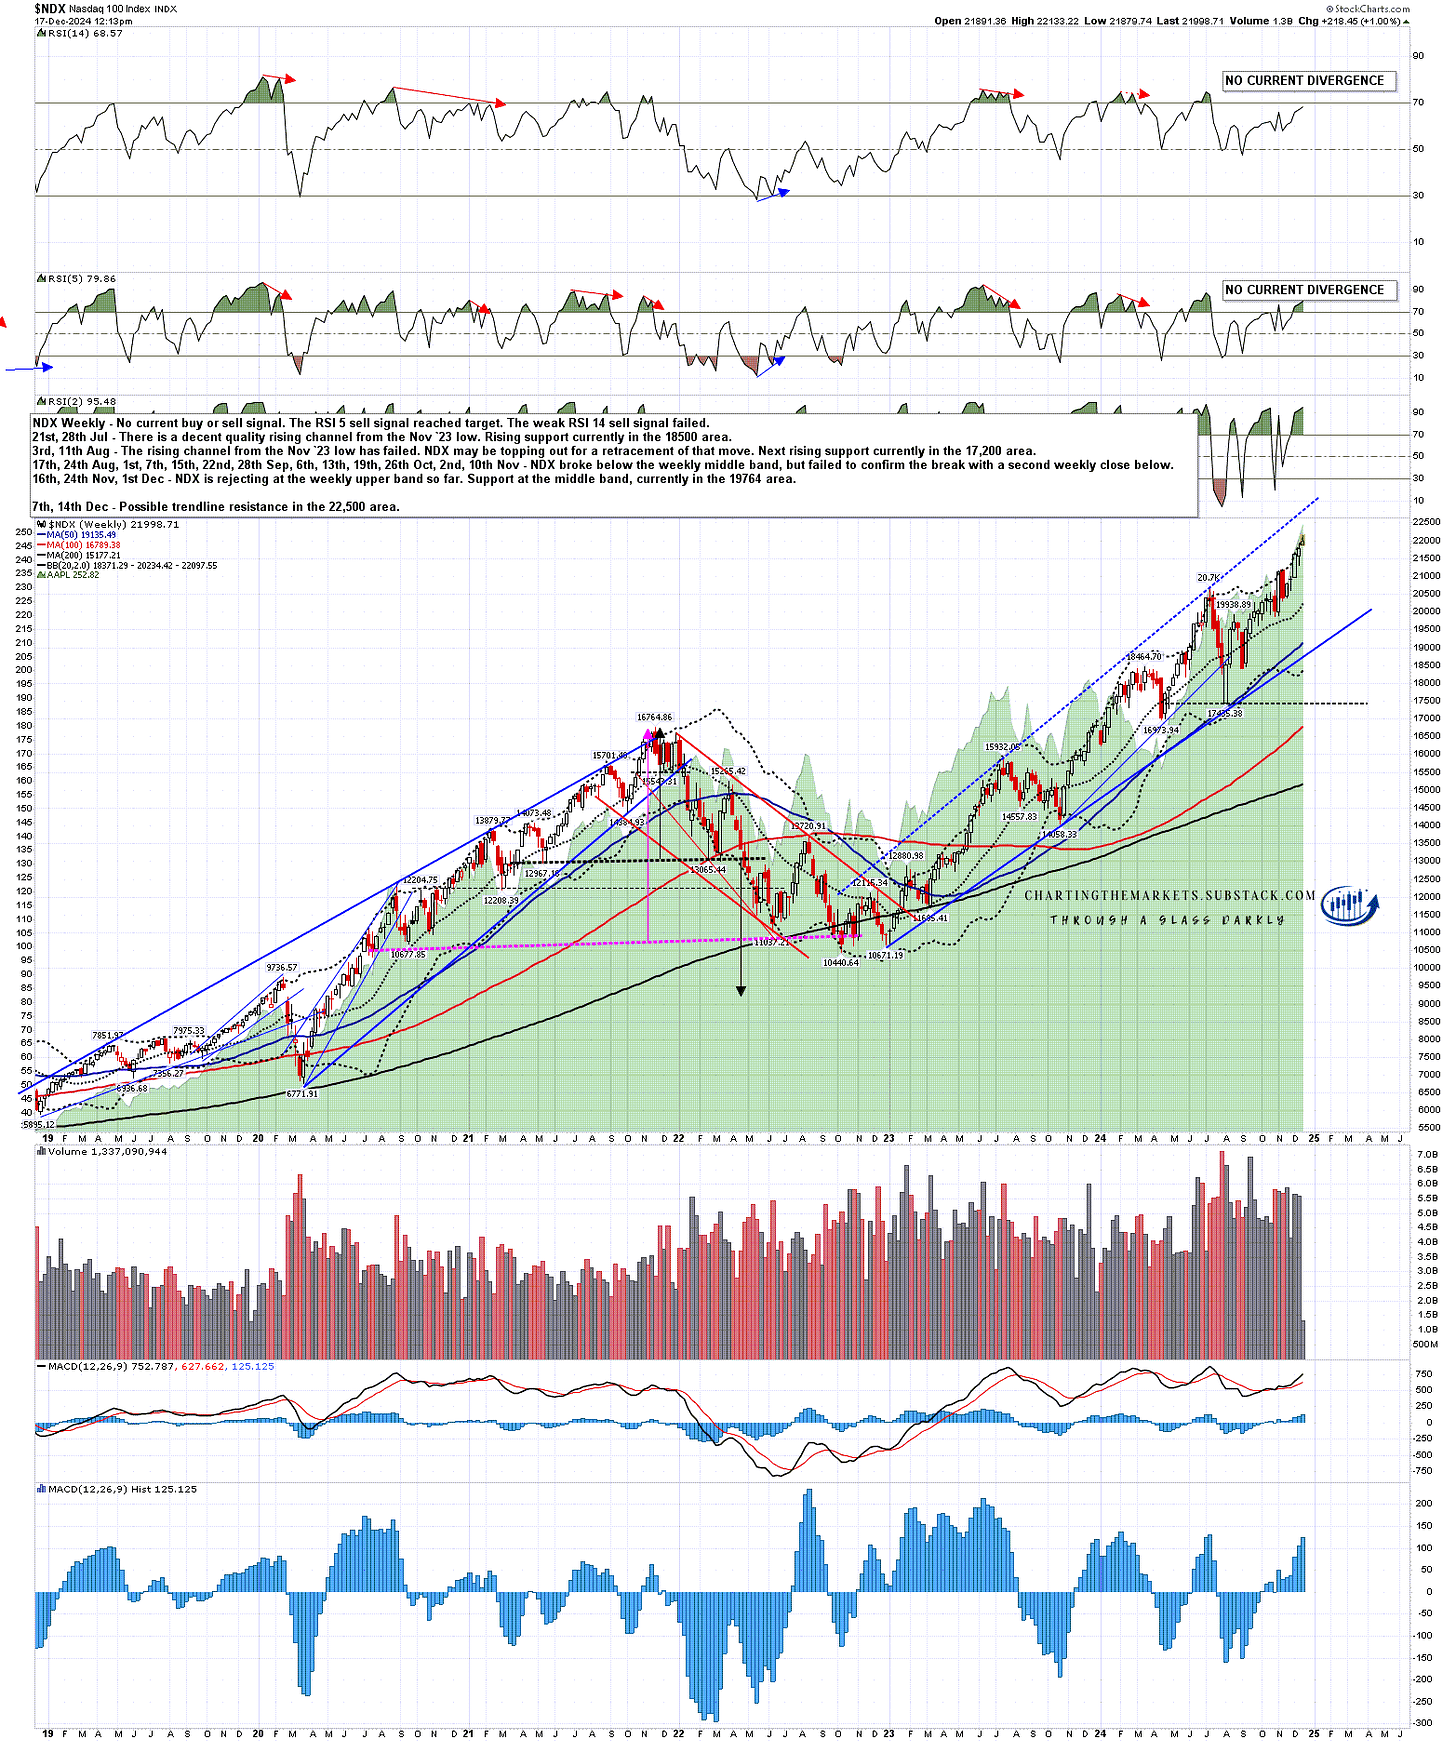
On NDX I am watching possible trendline resistance currently in the 22500, matching the support trendline from the late 2022 low. If seen that might also be a significant high.
NDX weekly chart:
I’m hoping to see more upside on US indices, maybe into Xmas and, if not, then likely into January, though there should be a larger retracement in that period somewhere and that could be starting here.
The closer we come to inauguration the more I’m also going to be looking at the incoming administration and the policies that are being talked about for the first 100 days of the new administration. Tariffs, Ukraine and others may make this one of the most interesting years on the markets that anyone can remember.
Presidential election years tend to be bullish historically, the years after not so much, and equity indices are up a lot over the last two years. I am doubtful about equity markets seeing much upside next year as valuations look very stretched going into a year where the news stream is likely to be turbulent, and interest rates may be on an upward track all year. We'll see.
If you like my analysis and would like to see more, please take a free subscription at my chartingthemarkets substack, where I publish these posts first.
I also do a premarket video every day on equity indices, bonds, currencies, energies, precious commodities and other commodities at 8.45am EST. If you’d like to see those I post the links every morning on my twitter, and the videos are posted shortly afterwards on my Youtube channel.

No comments:
Post a Comment