Back in my post on 11th April I called the likely start of a strong rally which we then saw.
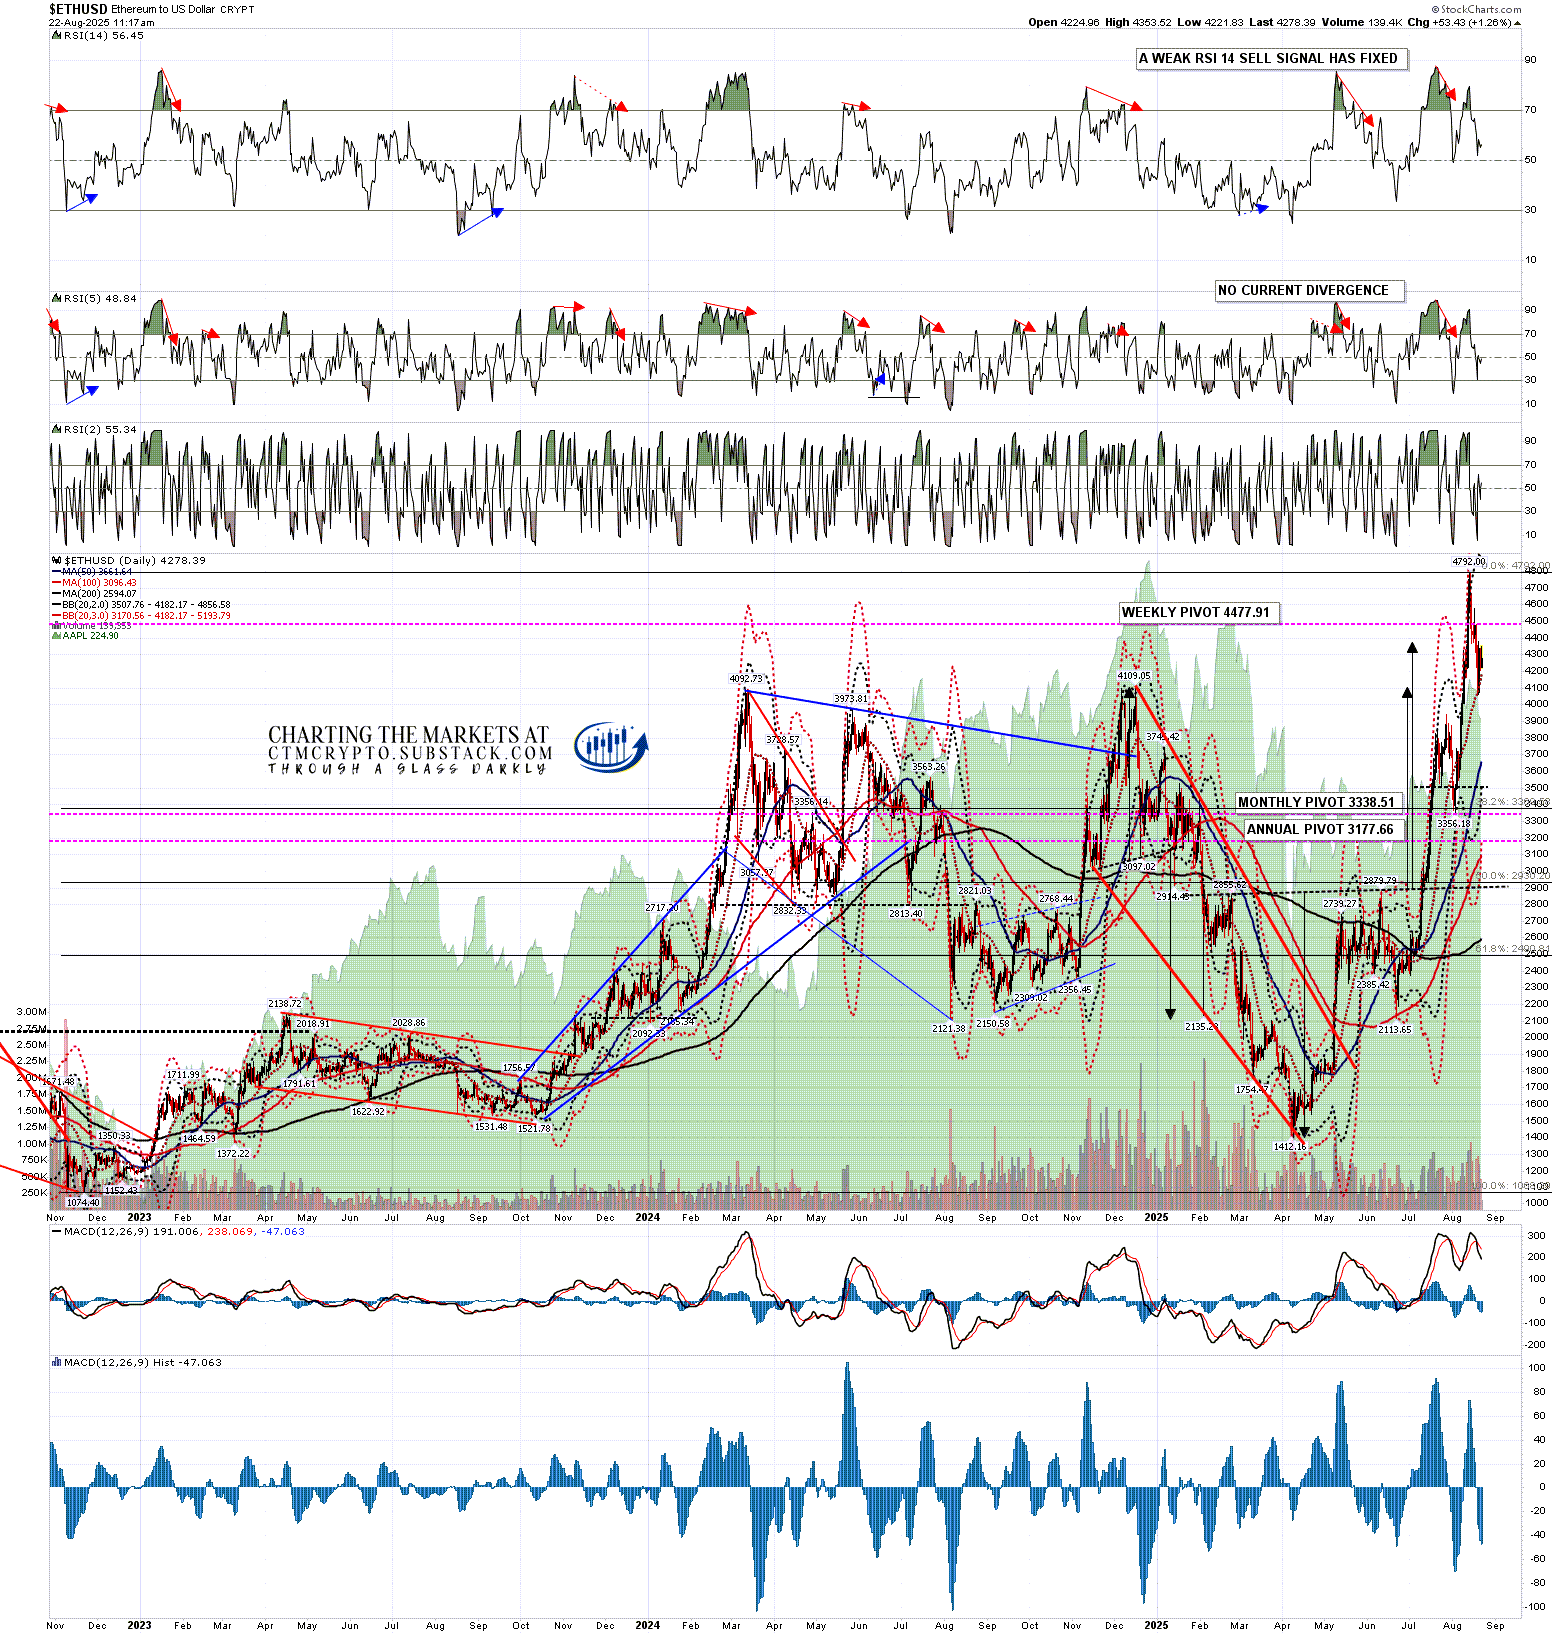
Back in my post on 12th May I called for new all time highs on Bitcoin (BTCUSD) and laid out possible IHS scenarios on both Solana (SOLUSD) and Ethereum (ETHUSD), looking for ideal right shoulder lows on Solana in the 125.43 area and on Ethereum in the 2074.27 area. That hasn’t gone quite as I drew then but essentially both are still running that scenario, though Ethereum has now reached the IHS target.
Back in my post on 23rd June I called the likely lows on those right shoulders made on Solana at 126.09 and on Ethereum at 2113.65, and was looking for that IHS scenario on both to start to play out.
Back in my post on 18th July I was looking at the IHS that had since broken up on Ethereum and the progress made towards the IHS neckline on Solana.
In my post on 22nd July I was looking for some retracement after the IHS on Solana had broken up, and looking also at the possibility that a setup for a hard fail might form in that retracement.
In my post on 4th Aug I was looking at that retracement on Solana and looking for higher highs soon which we saw. I was expecting Ethereum to reach the IHS target at 4109.05 which we saw.
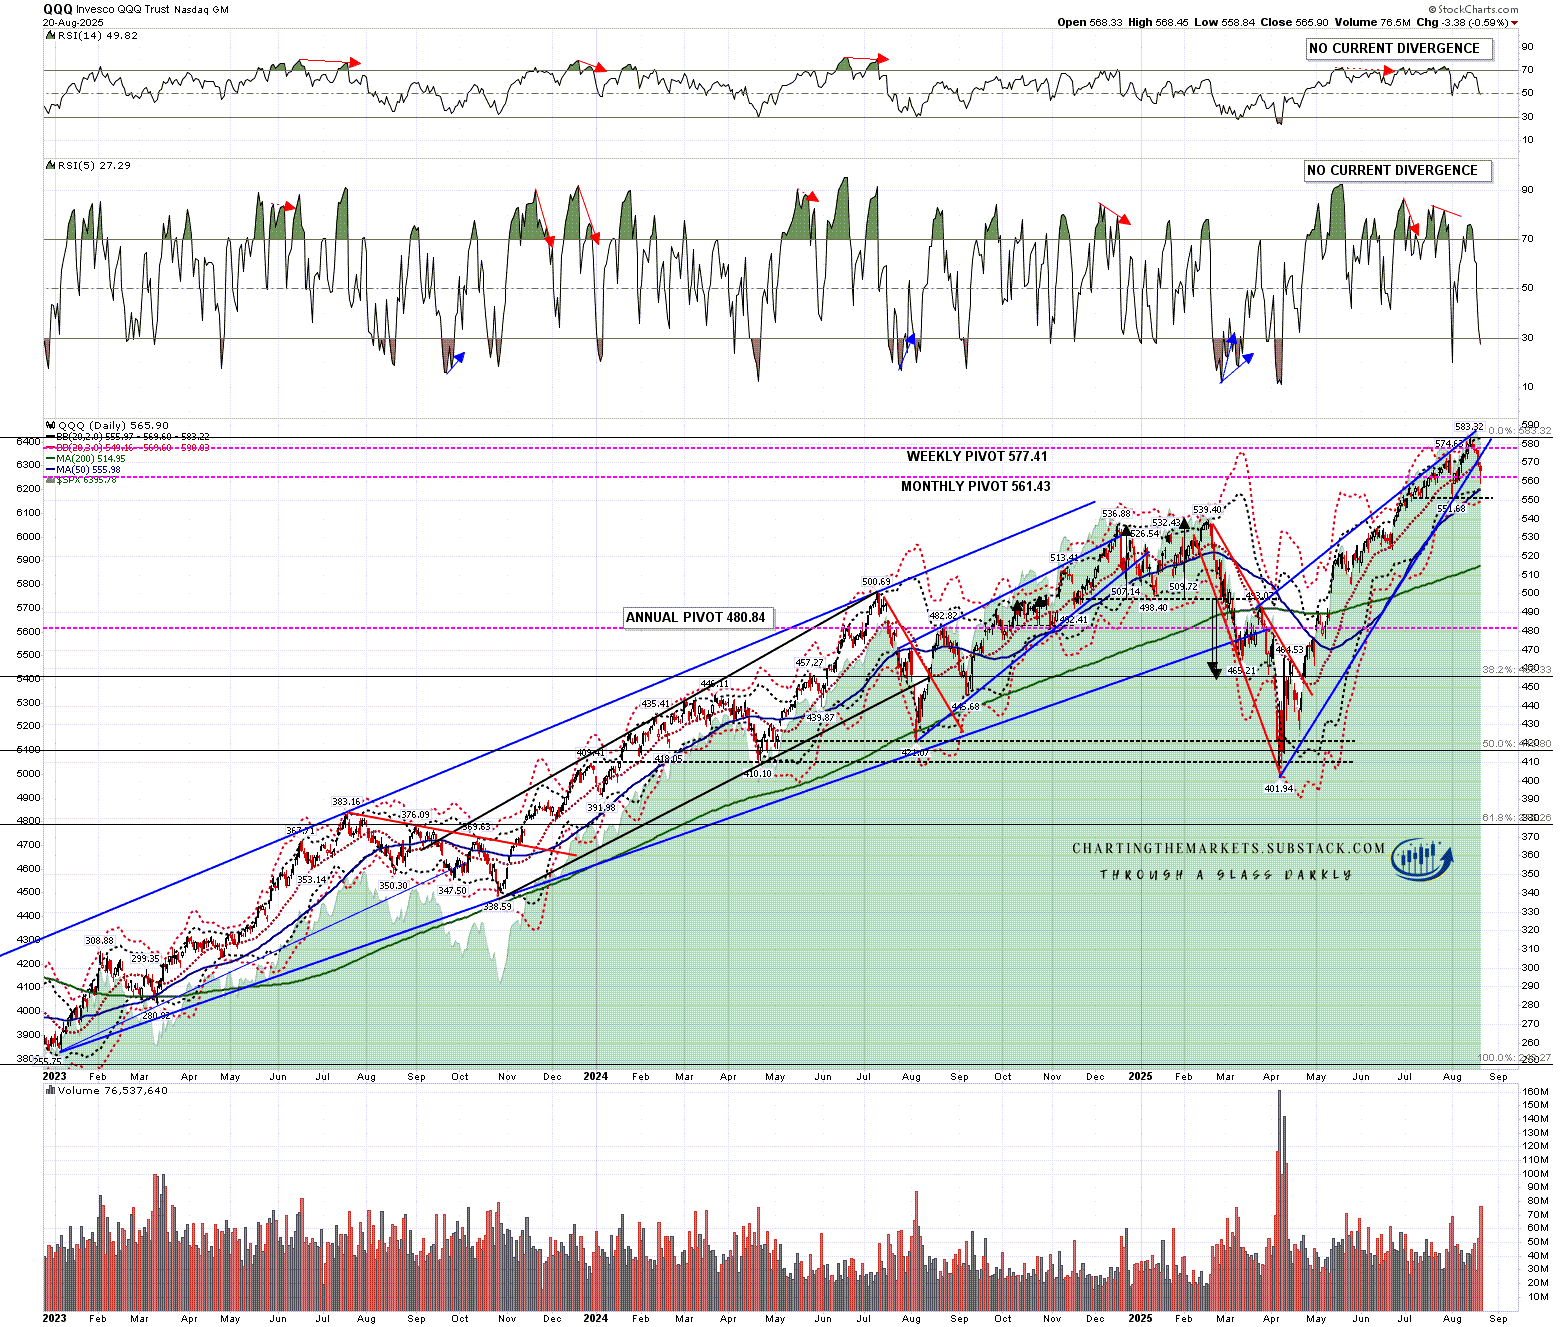
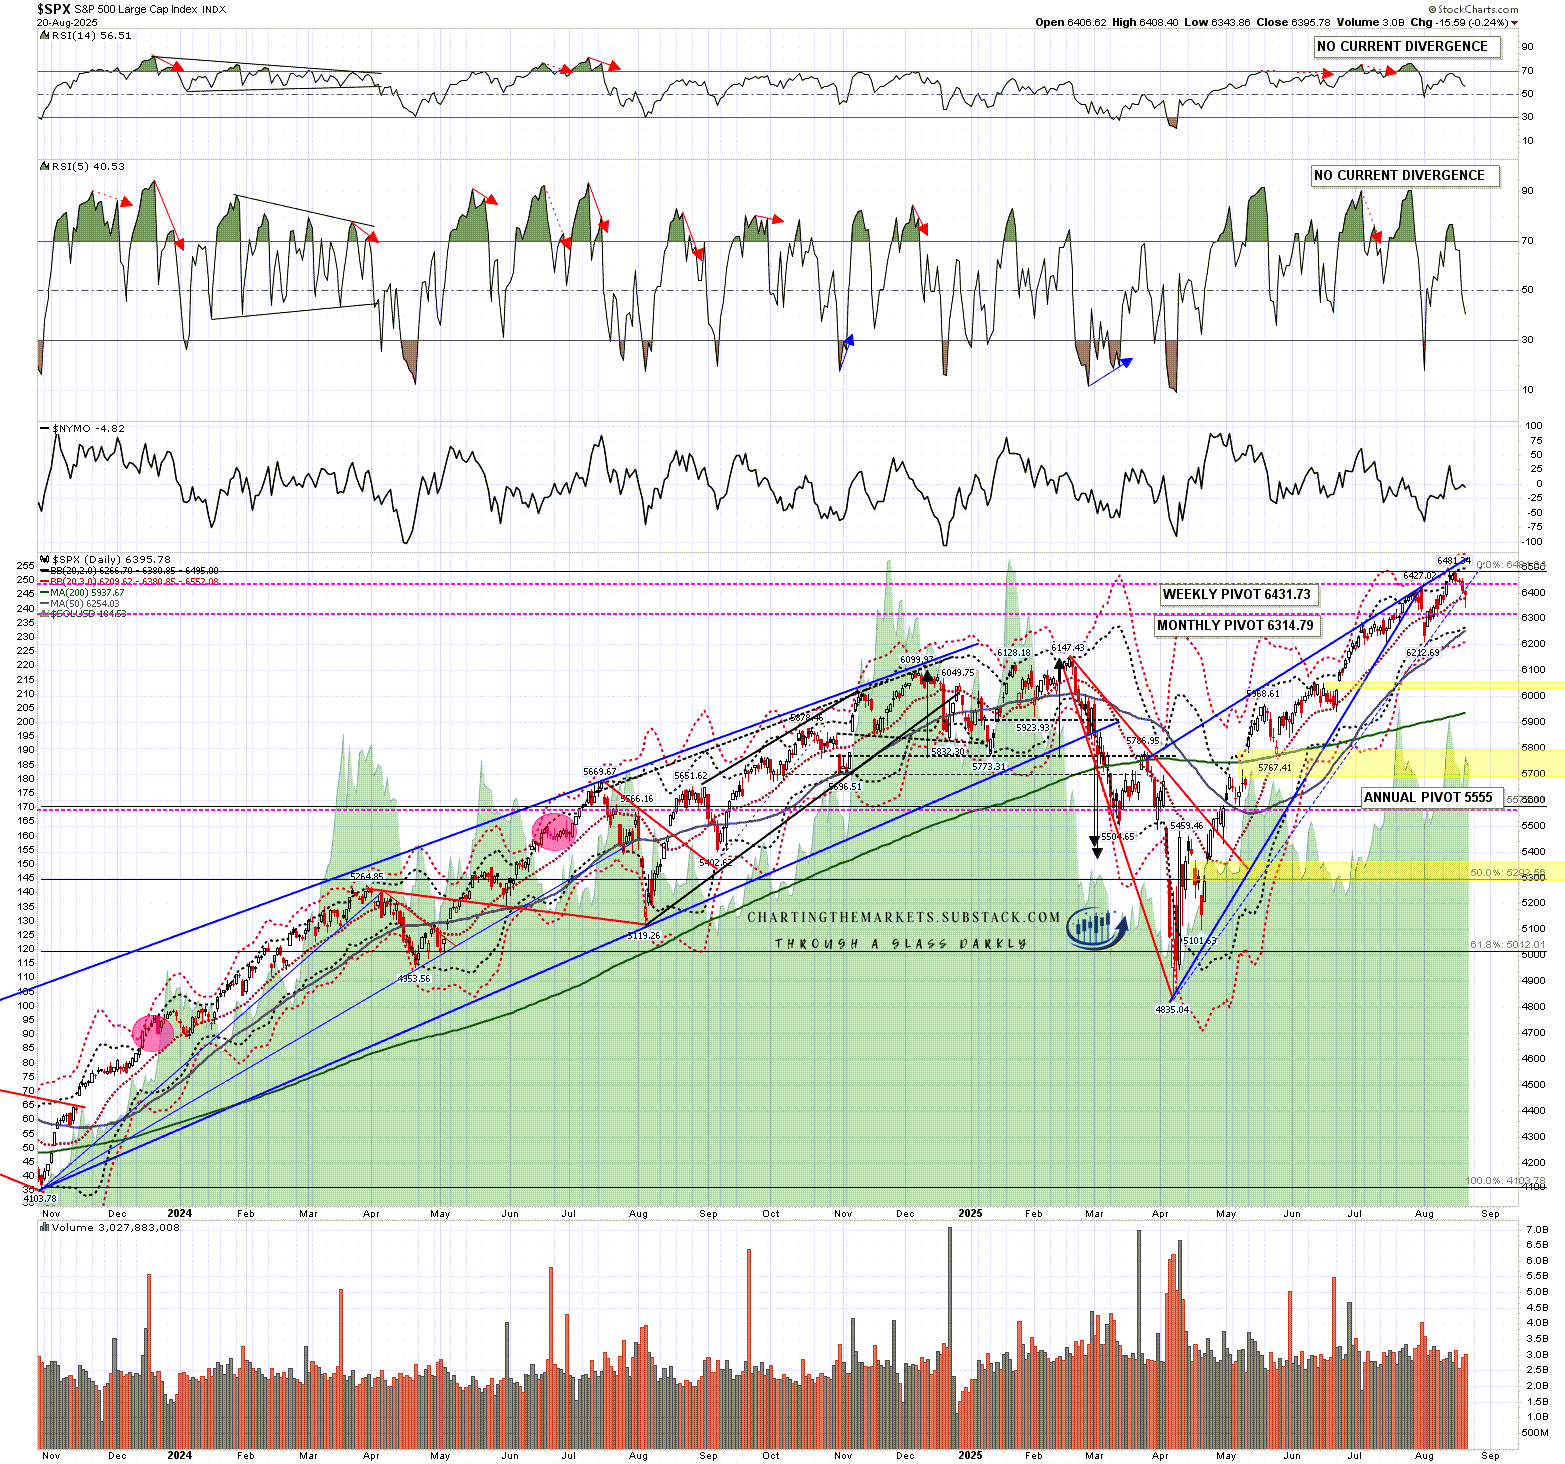
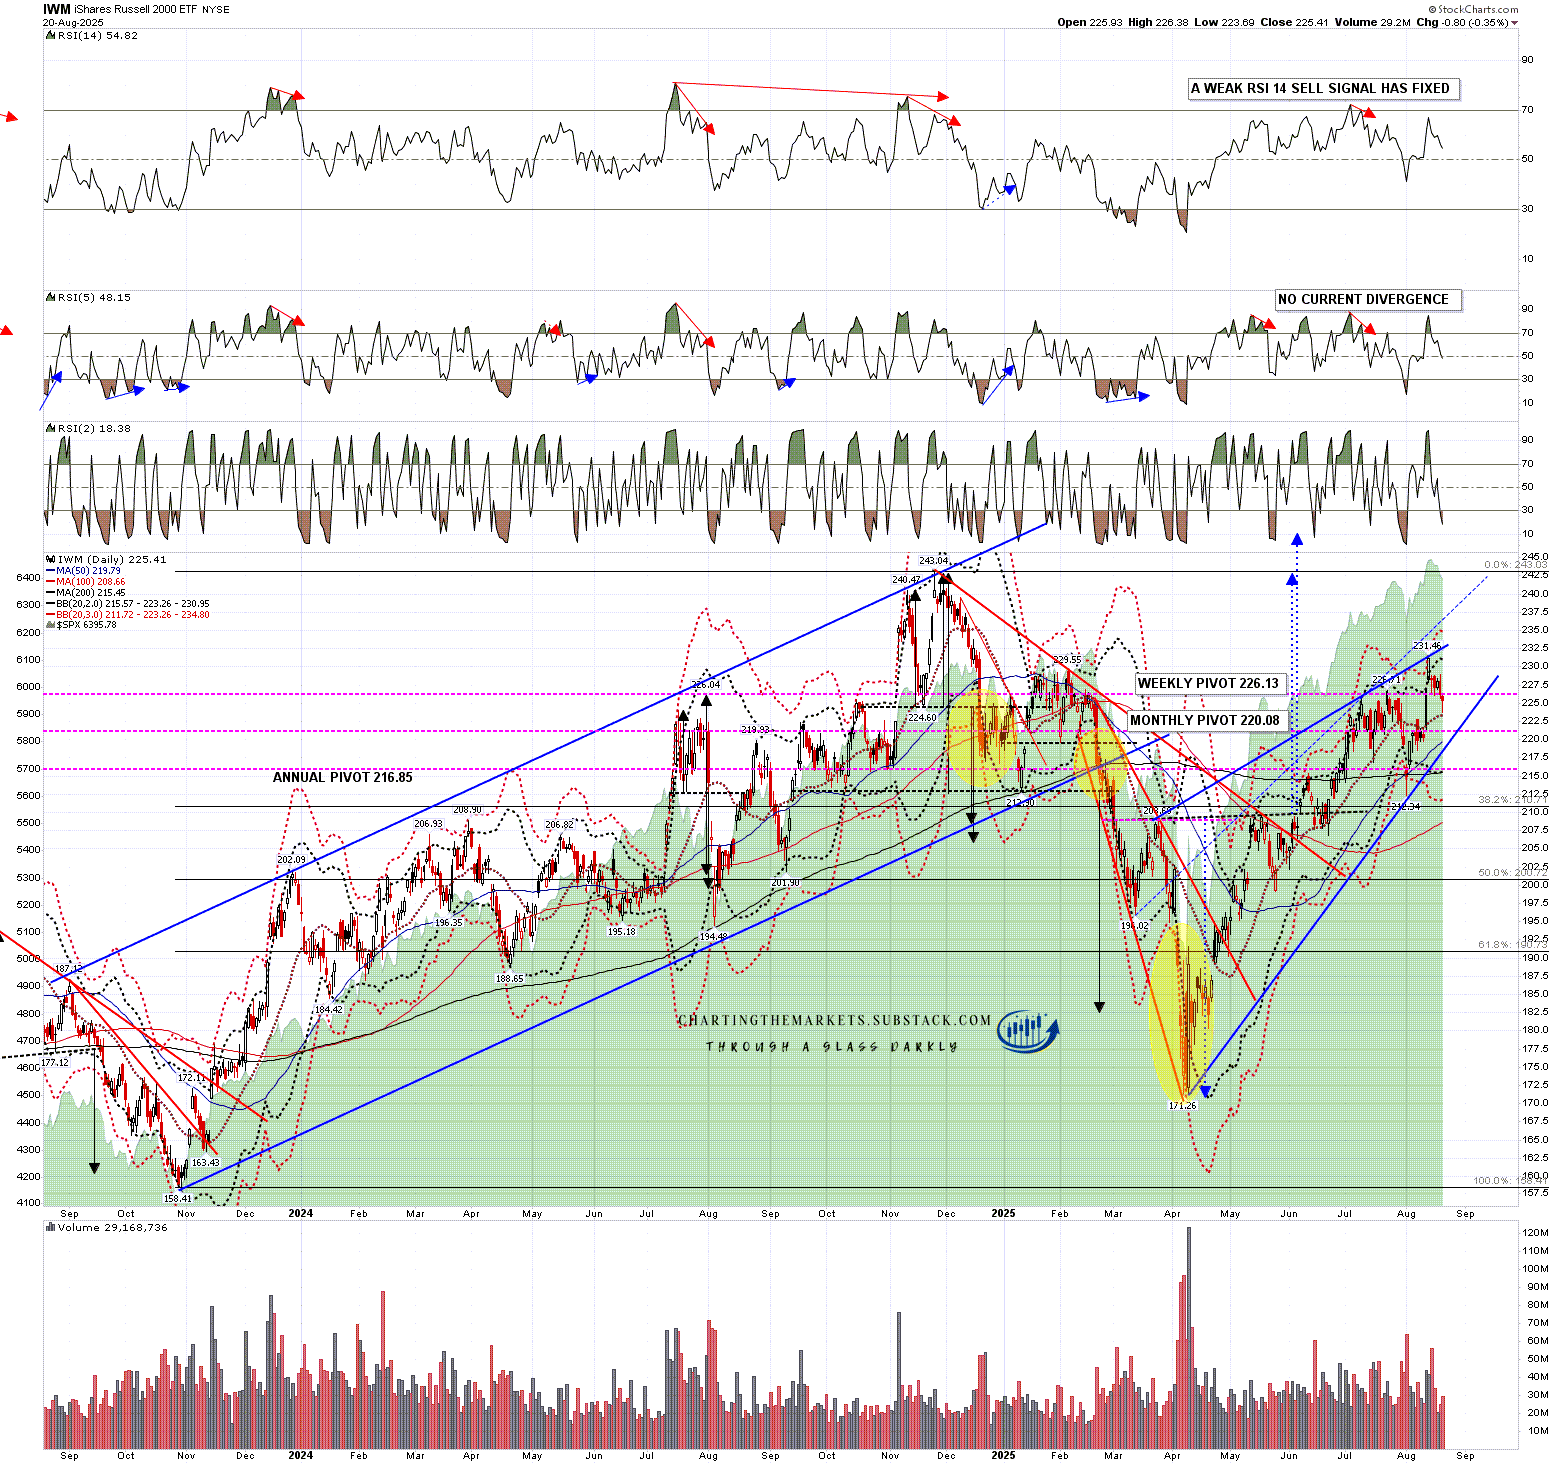
In my post on 19th August I was looking at a likely retracement starting on both equities and Crypto and we’ve seen that. There is now a clear inflection point here where Crypto could rally back into retests of the recent highs, or break down further into the next targets.
In my last post on Friday I was looking at the inflection point on Bitcoin, Ethereum & Solana as we were coming into the Jackson Hole speech.
The Jackson Hole speech was positive about the prospect for an interest rate cut in September and there were some strong moves up on equities and Crypto but ……. not on Bitcoin. As a result we have another clear inflection point on Crypto this morning which I wanted to go through at the start of this week.
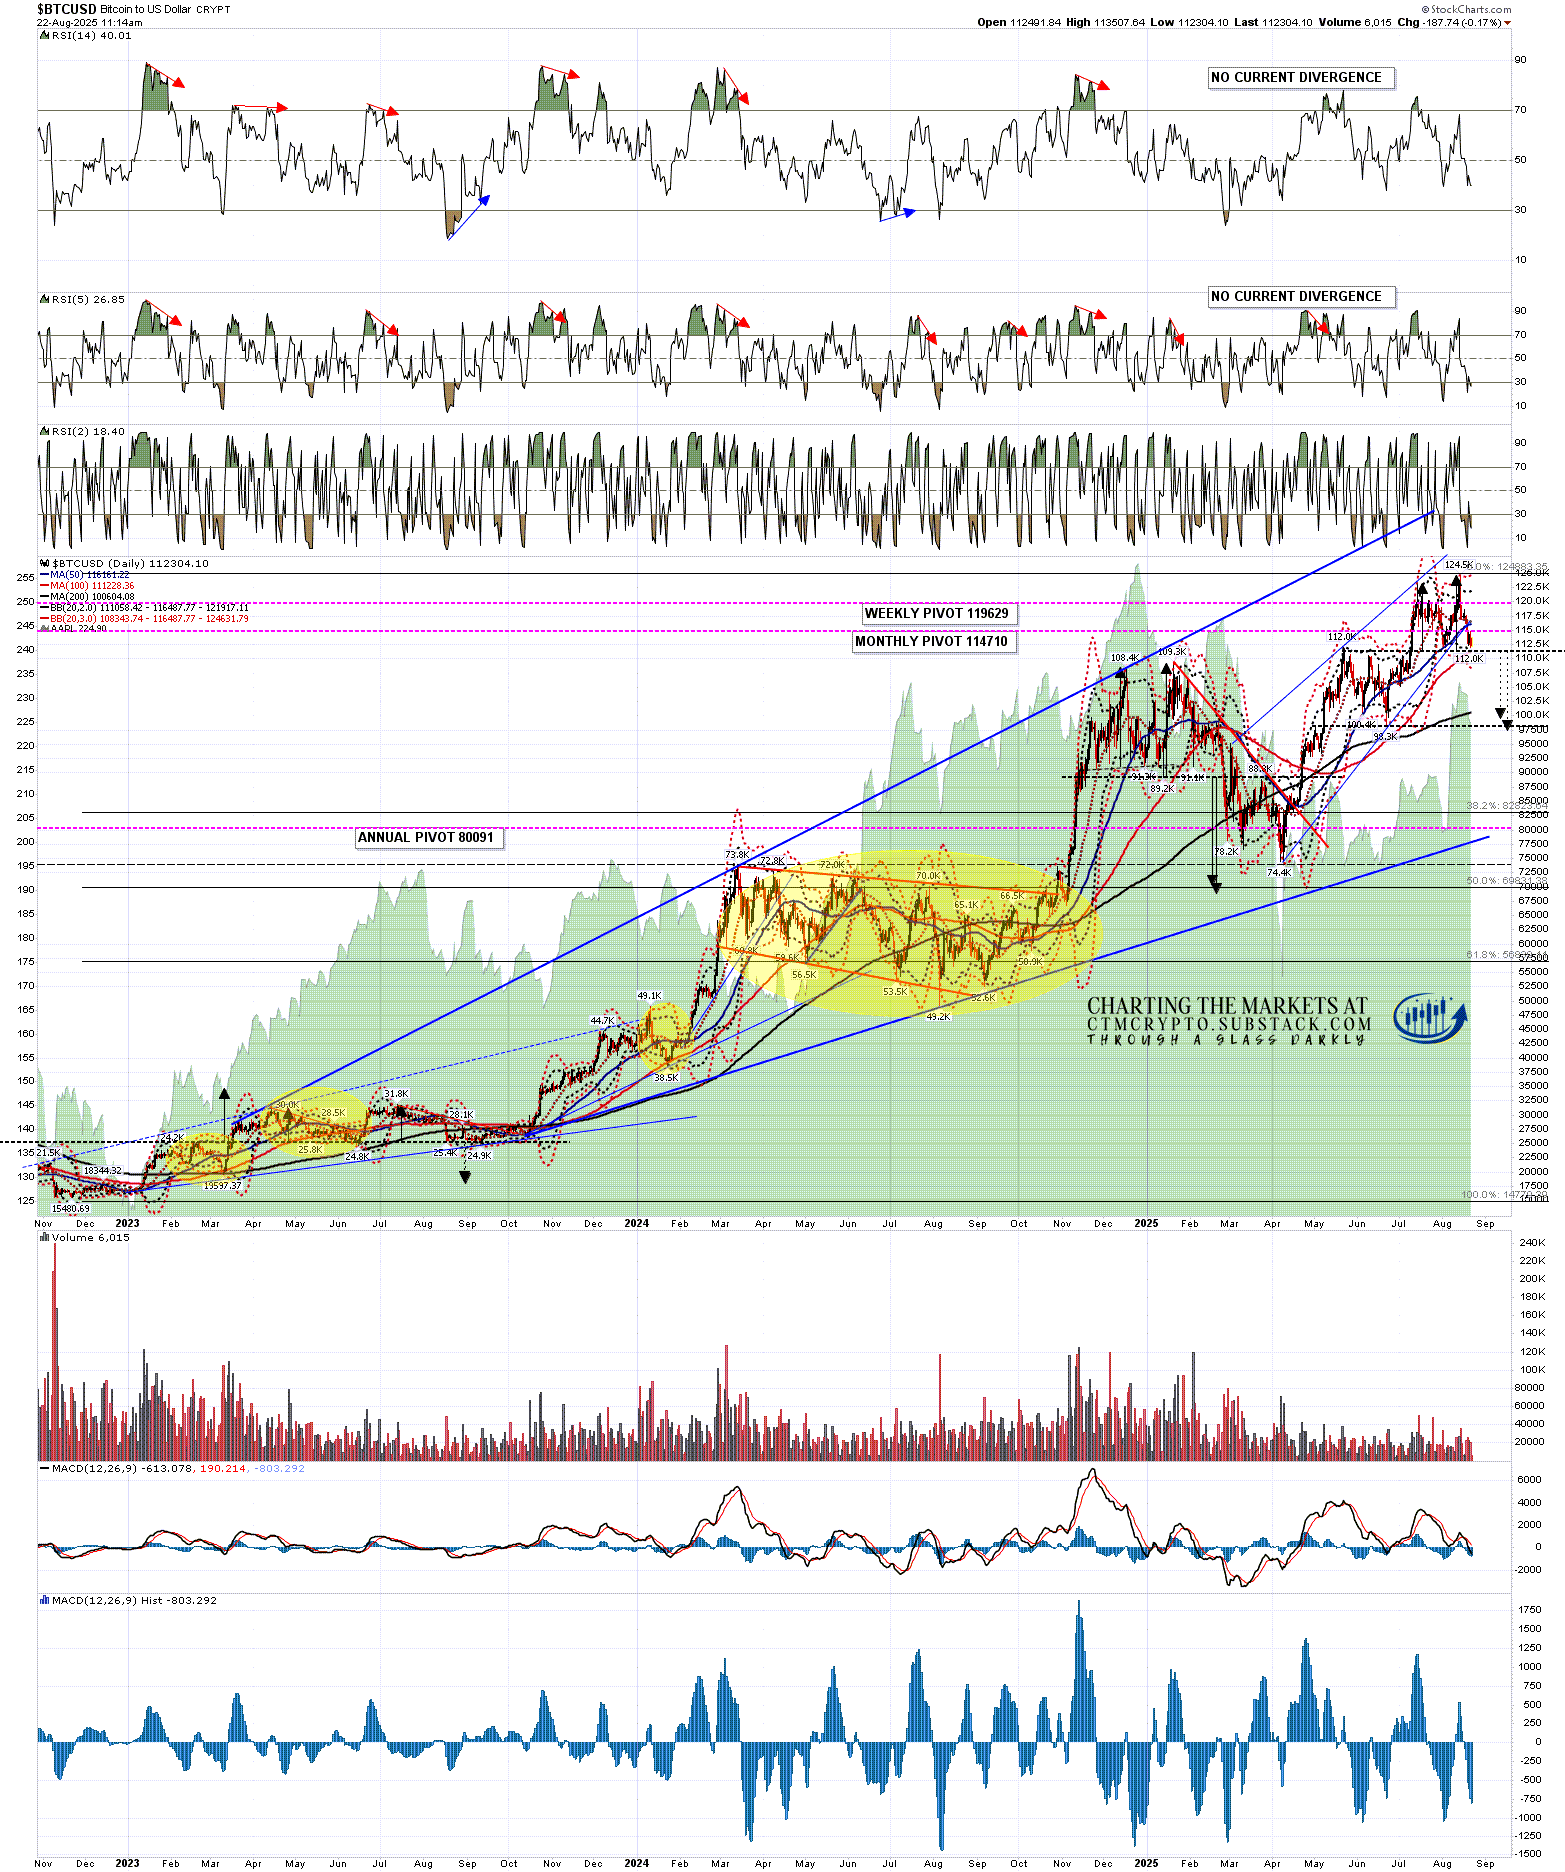
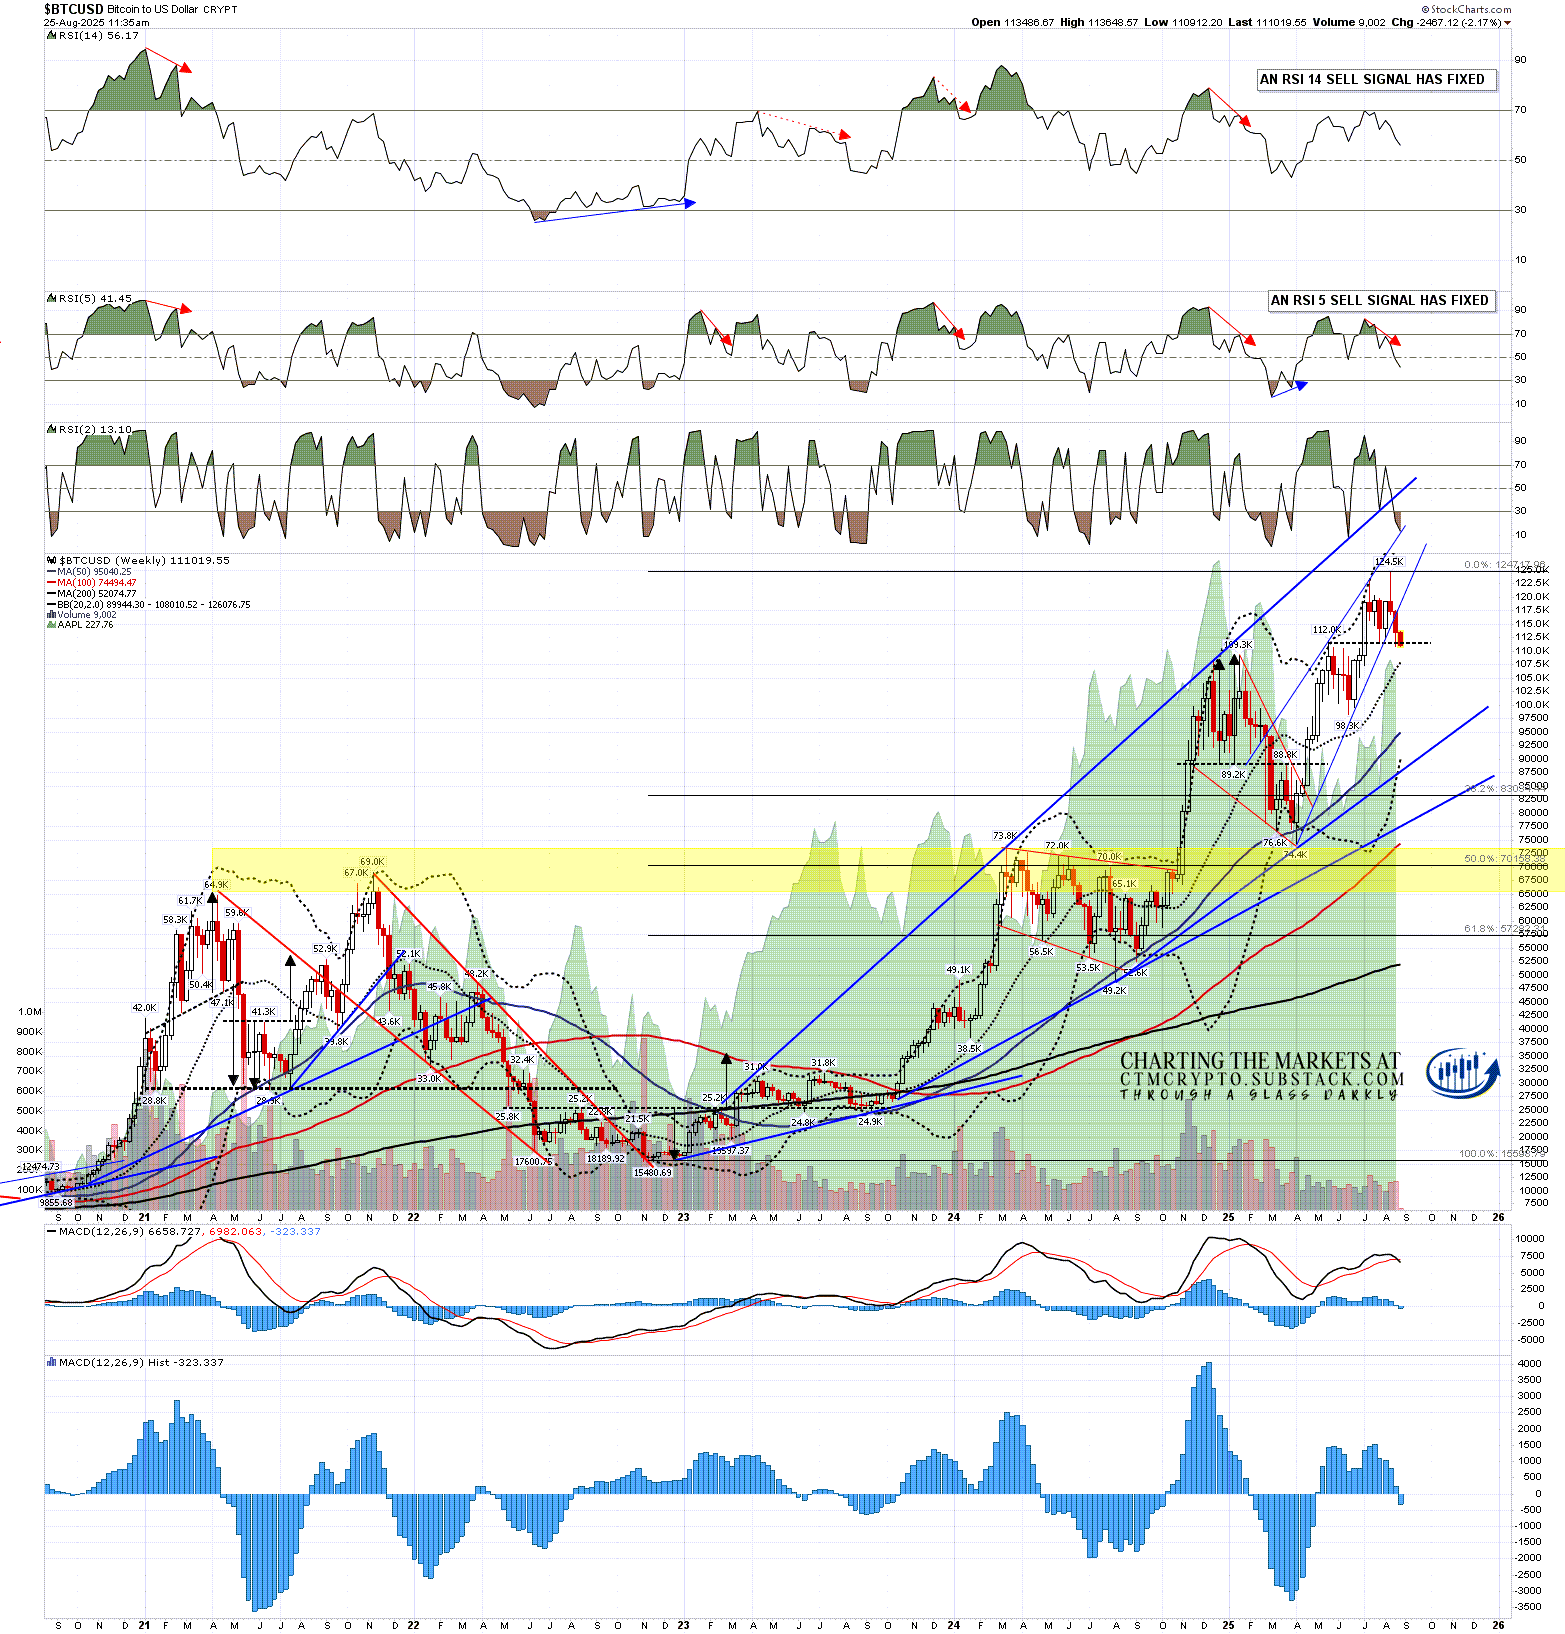
On the Bitcoin weekly chart an RSI 5 sell signal fixed at the close on Friday. The last four of these made the target at the 30 level on the weekly RSI 5, though in two of those cases there was another leg higher first when the decline that fixed the signal failed to break below the weekly middle band, currently at 108,010. That is therefore a very key level to watch in the next few days.
BTCUSD weekly chart:
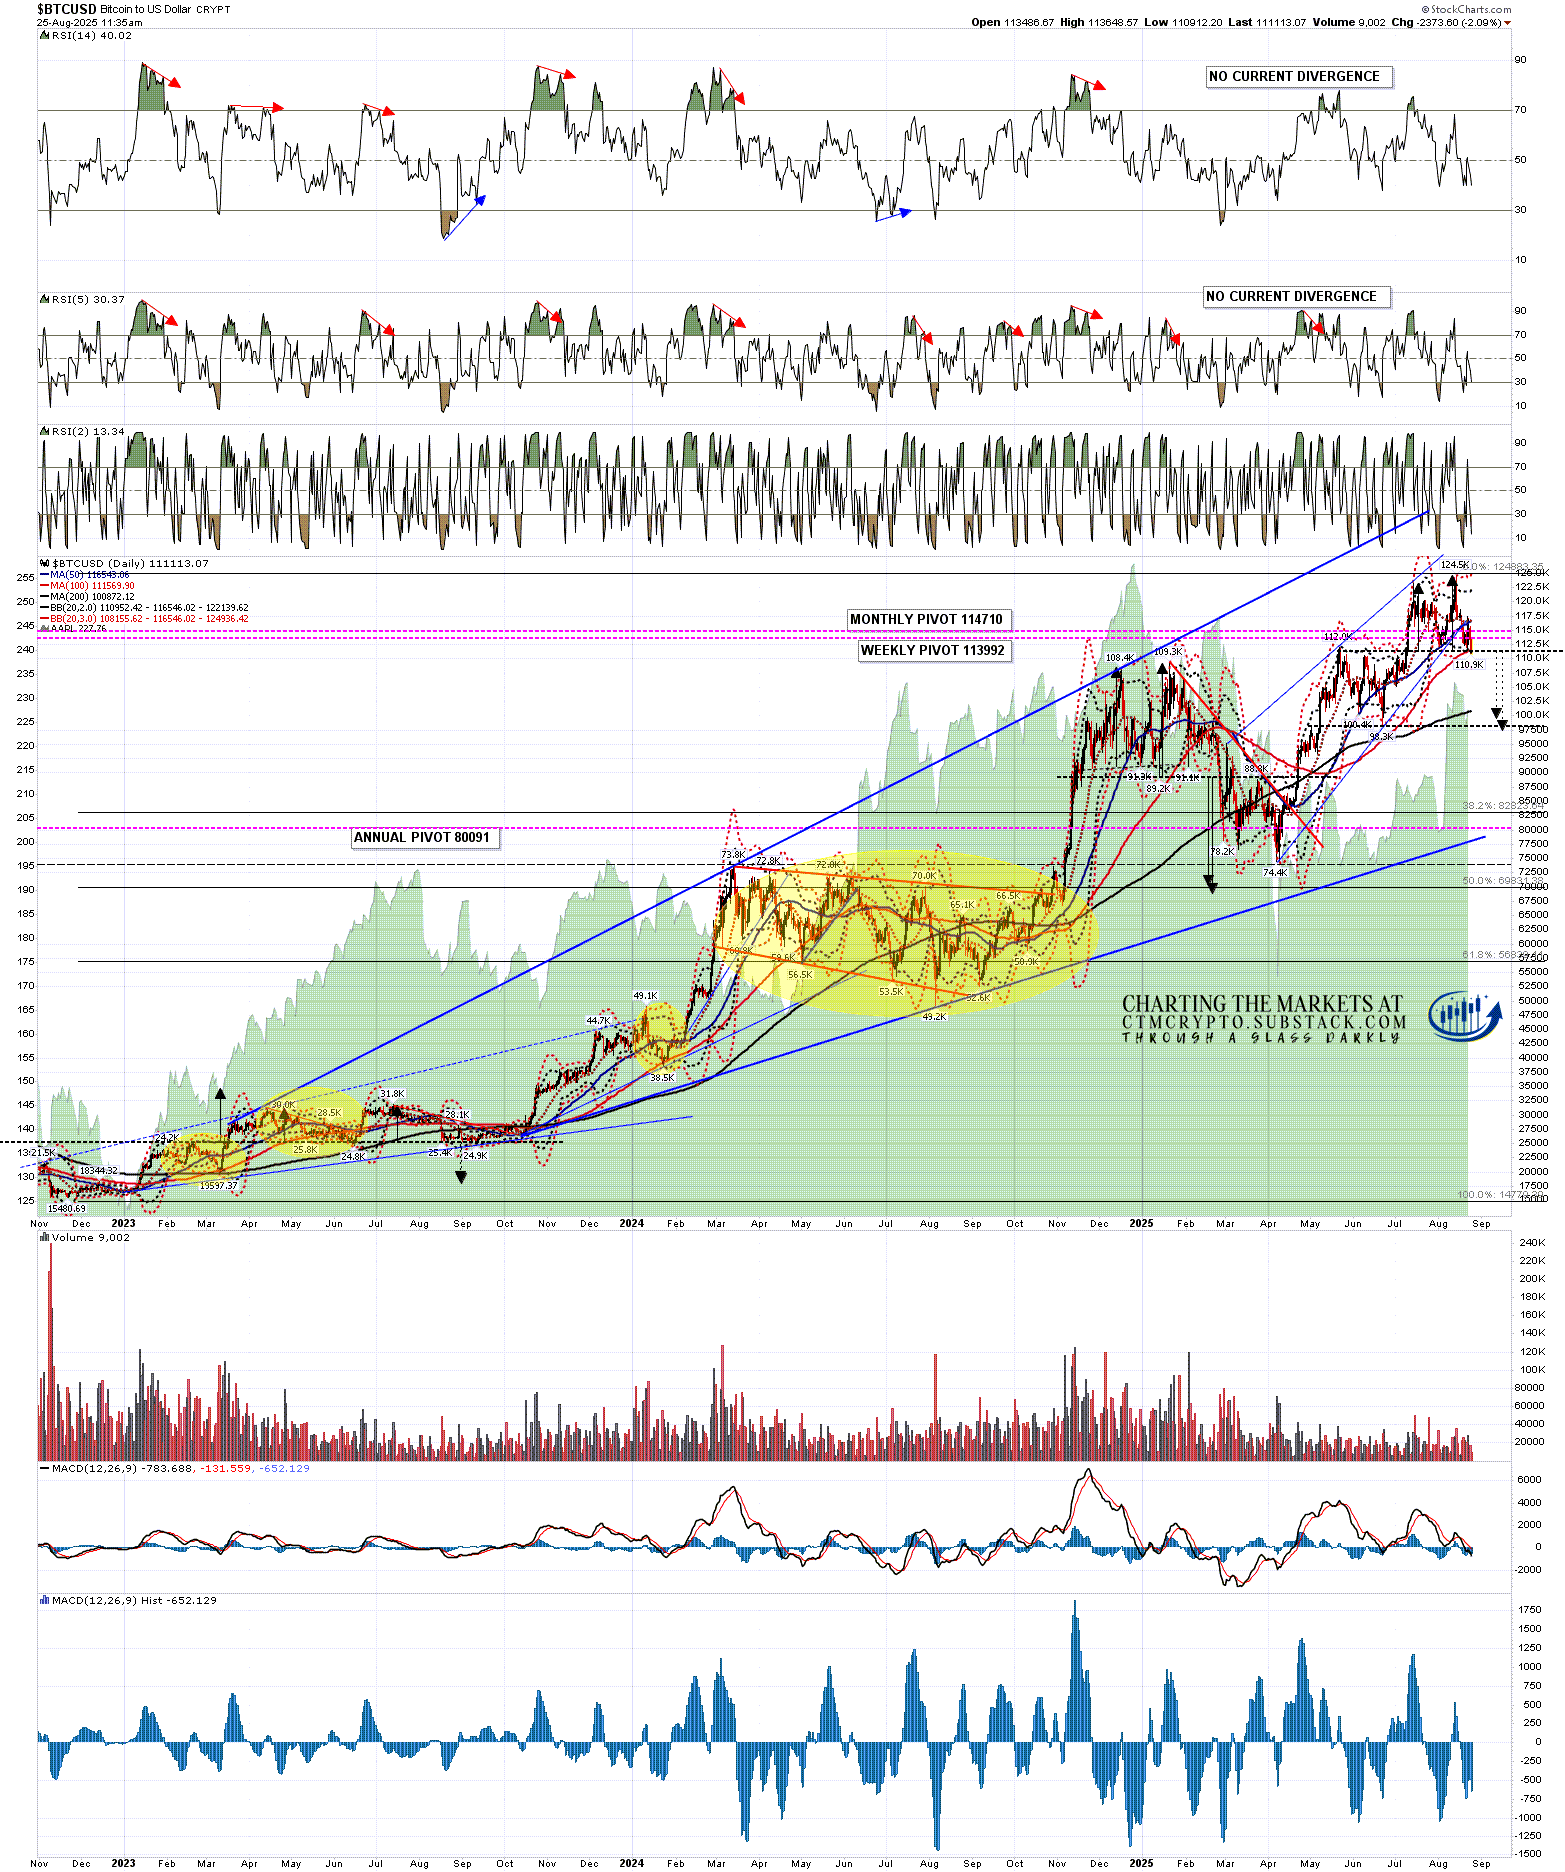
On the Bitcoin daily chart there was a decent rally from the lows on Friday, but that failed to sustain a break over double resistance at the daily middle band and the 50dma, currently at 116,546 and 116,543 respectively.
BTCUSD daily chart:
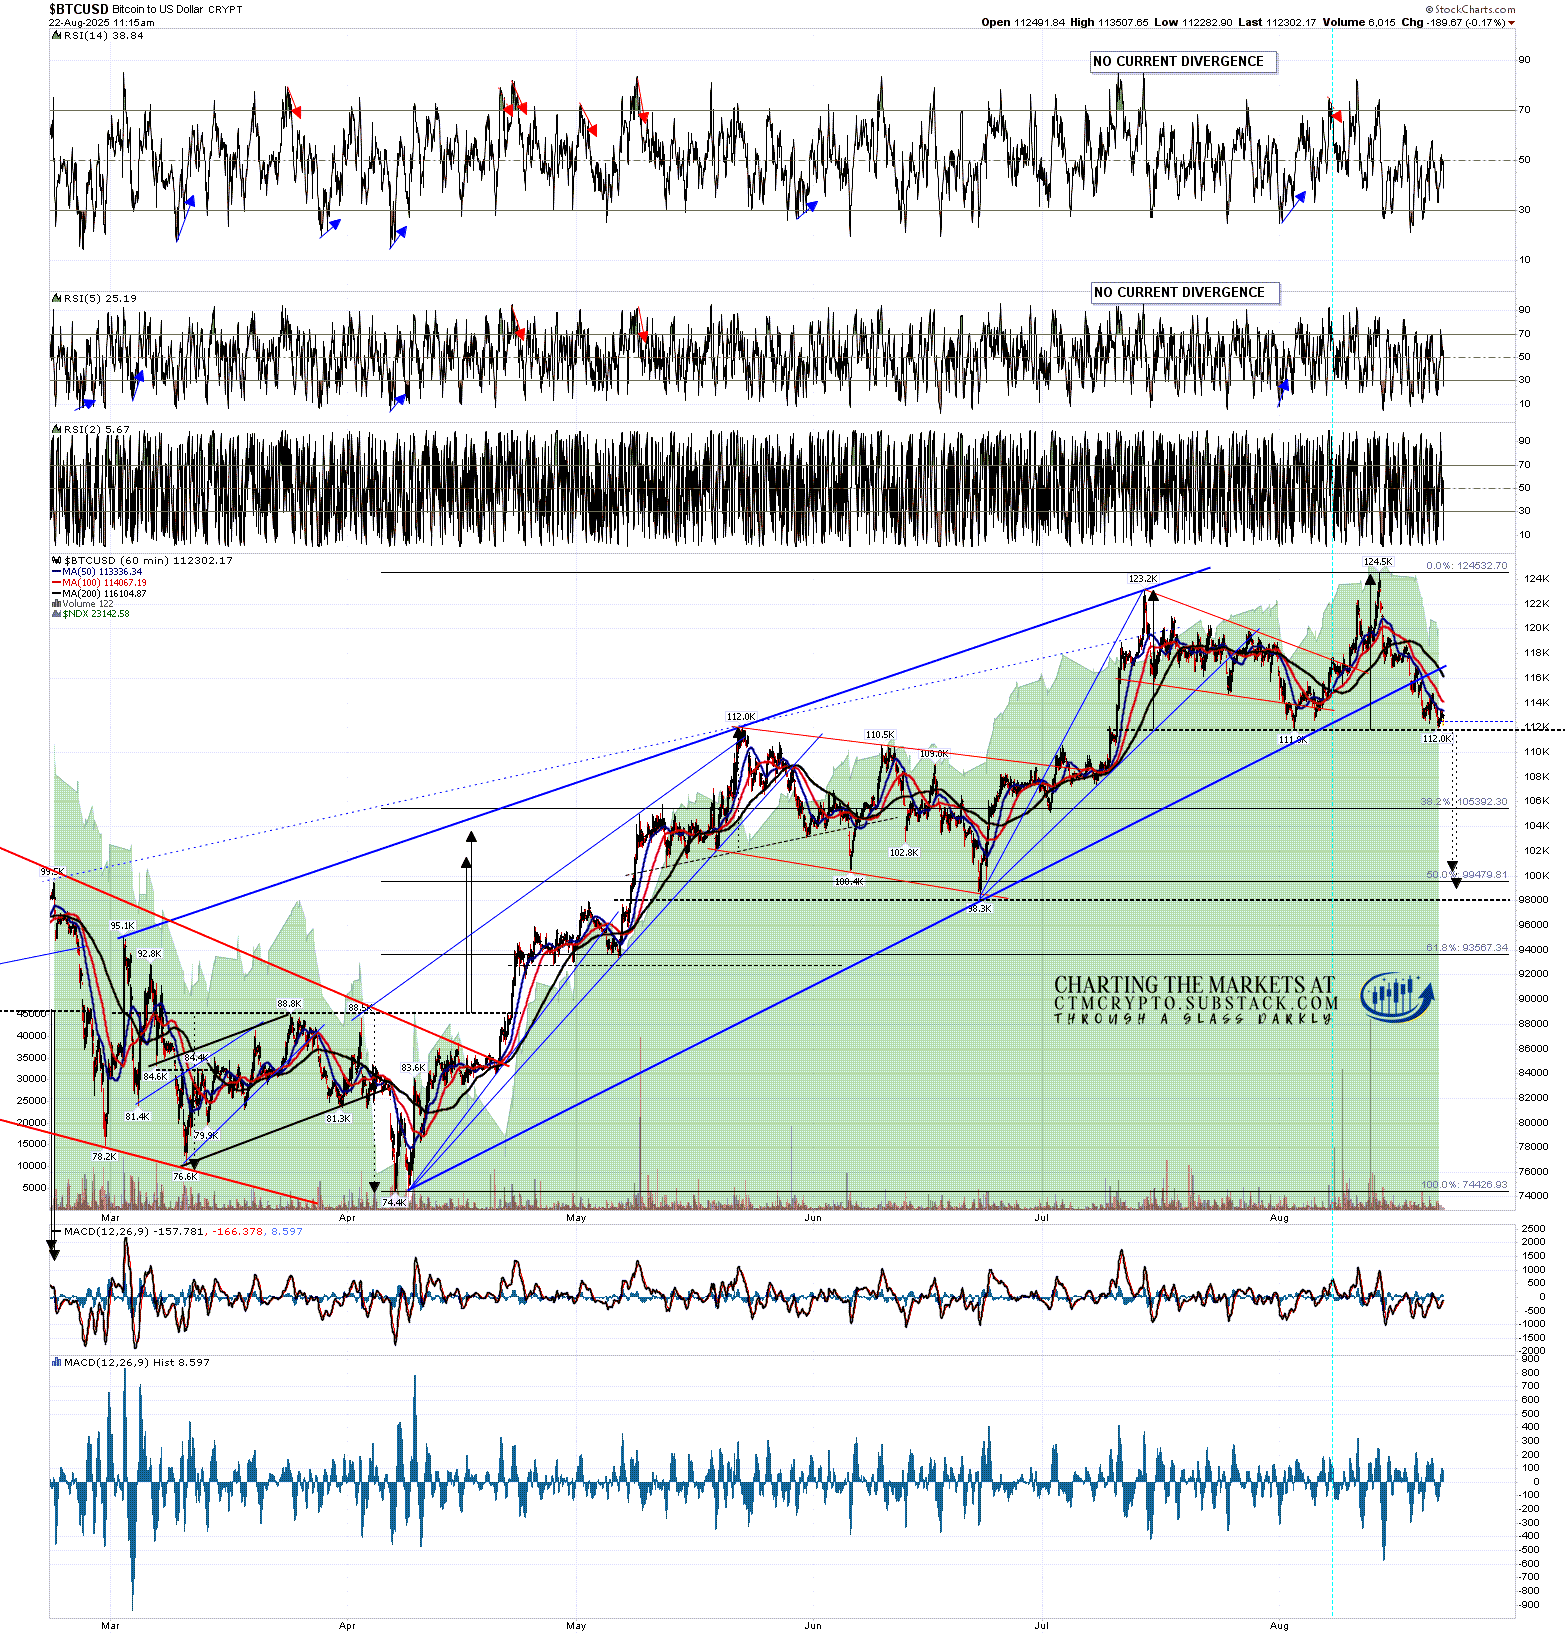
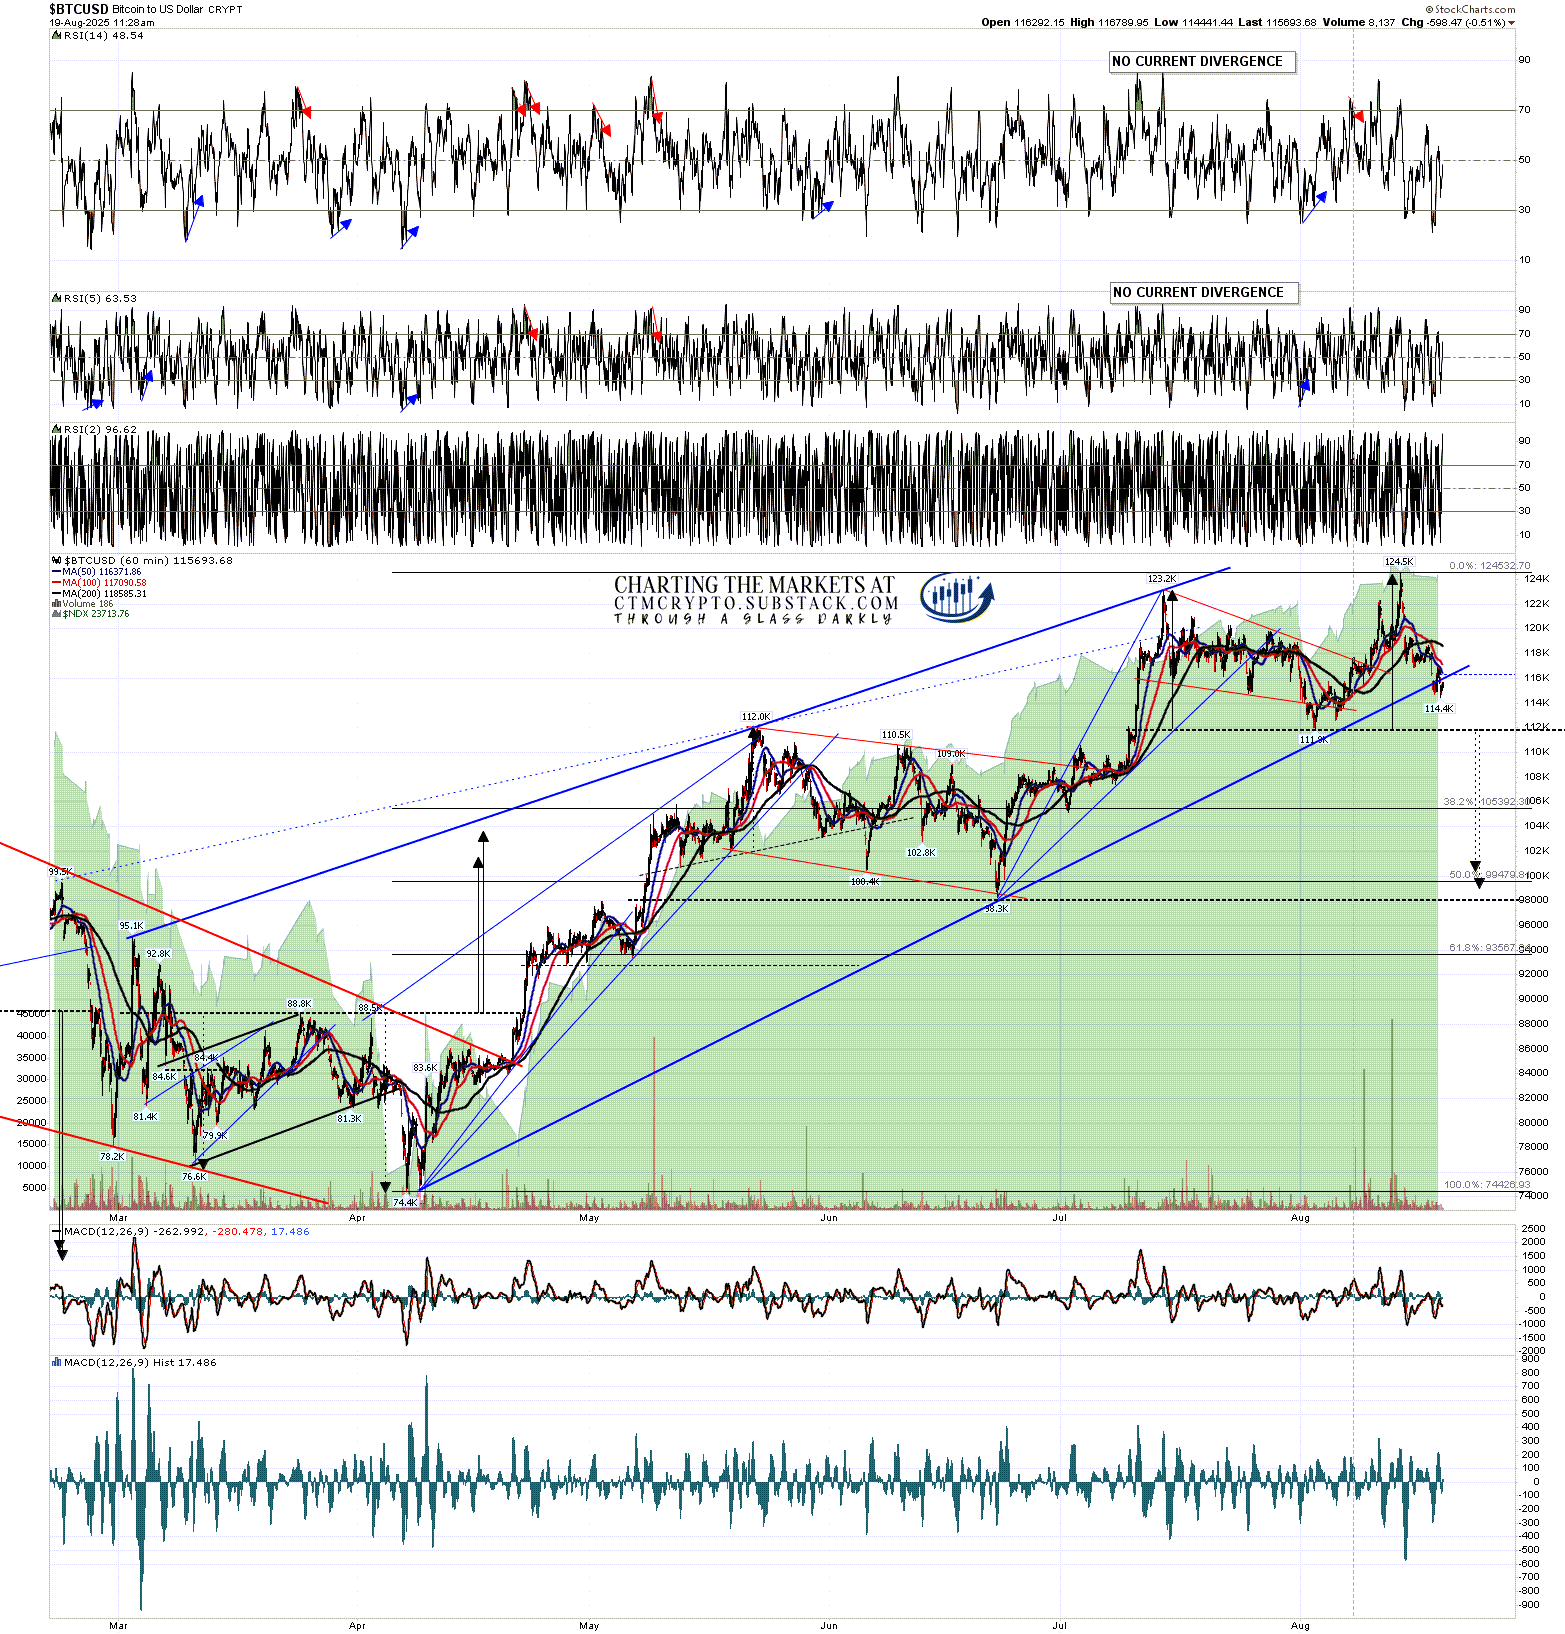
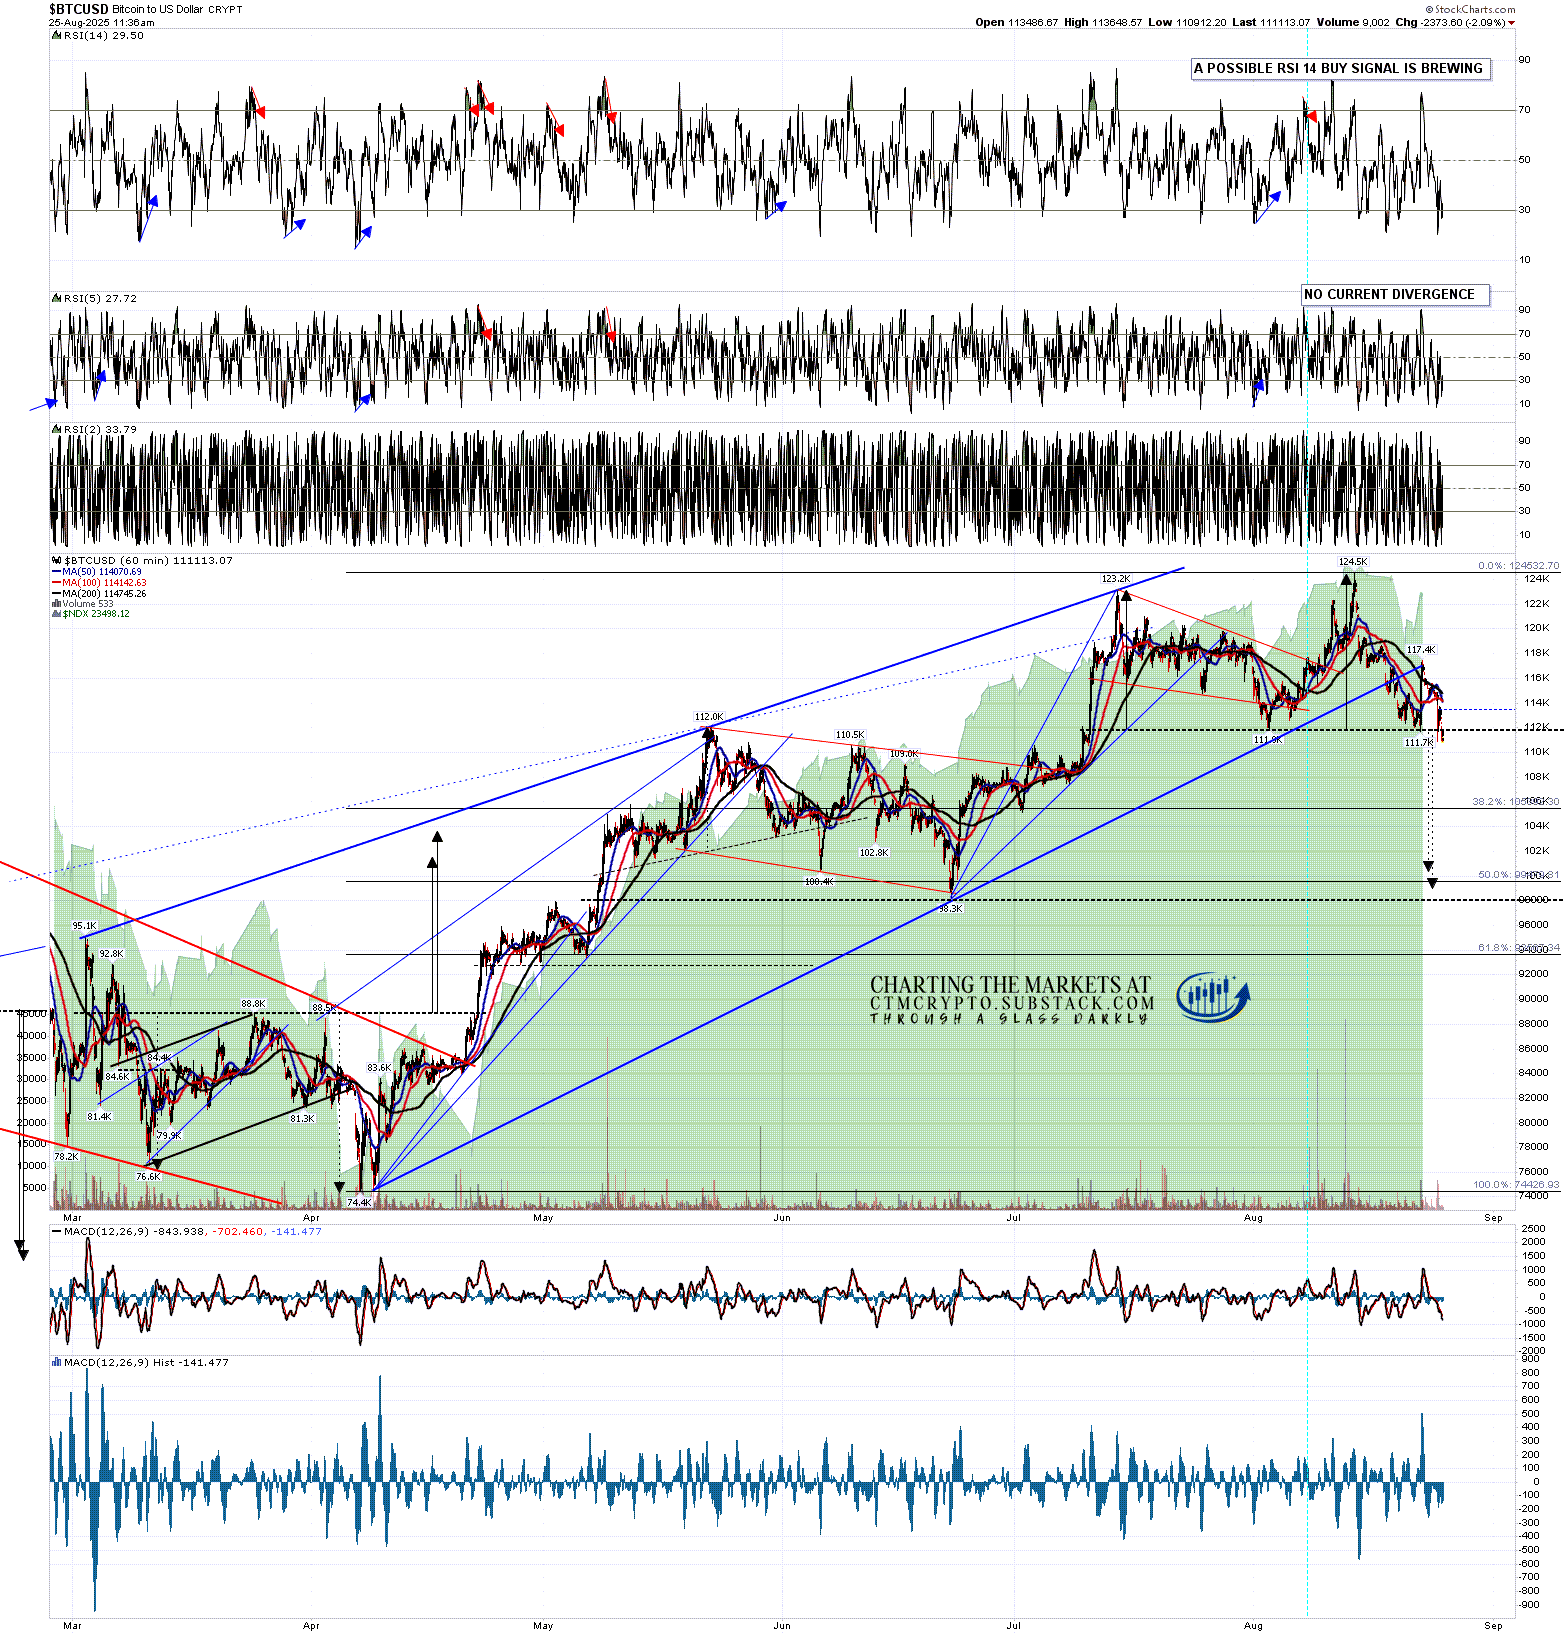
After Bitcoin failed at resistance a lower low was made, and on the bull side on the hourly chart, there is now a possible double bottom setup that on a sustained break over the weekend high at 117.4k would currently look for the 123.1k to 123.9k area, effectively looking for a retest of the all time high at 124.5k. There is also currently a possible hourly RSI 14 buy signal brewing.
On the bear side though the double top on Bitcoin had broken down with a target in the 99k to 100k area and, after a rally, has now made a lower low. The target area for this double top is close to the 50% retracement of the move up from the April low and just above the June low at 98.3k area. This is a very nice looking retracement setup.
BTCUSD 60min chart:
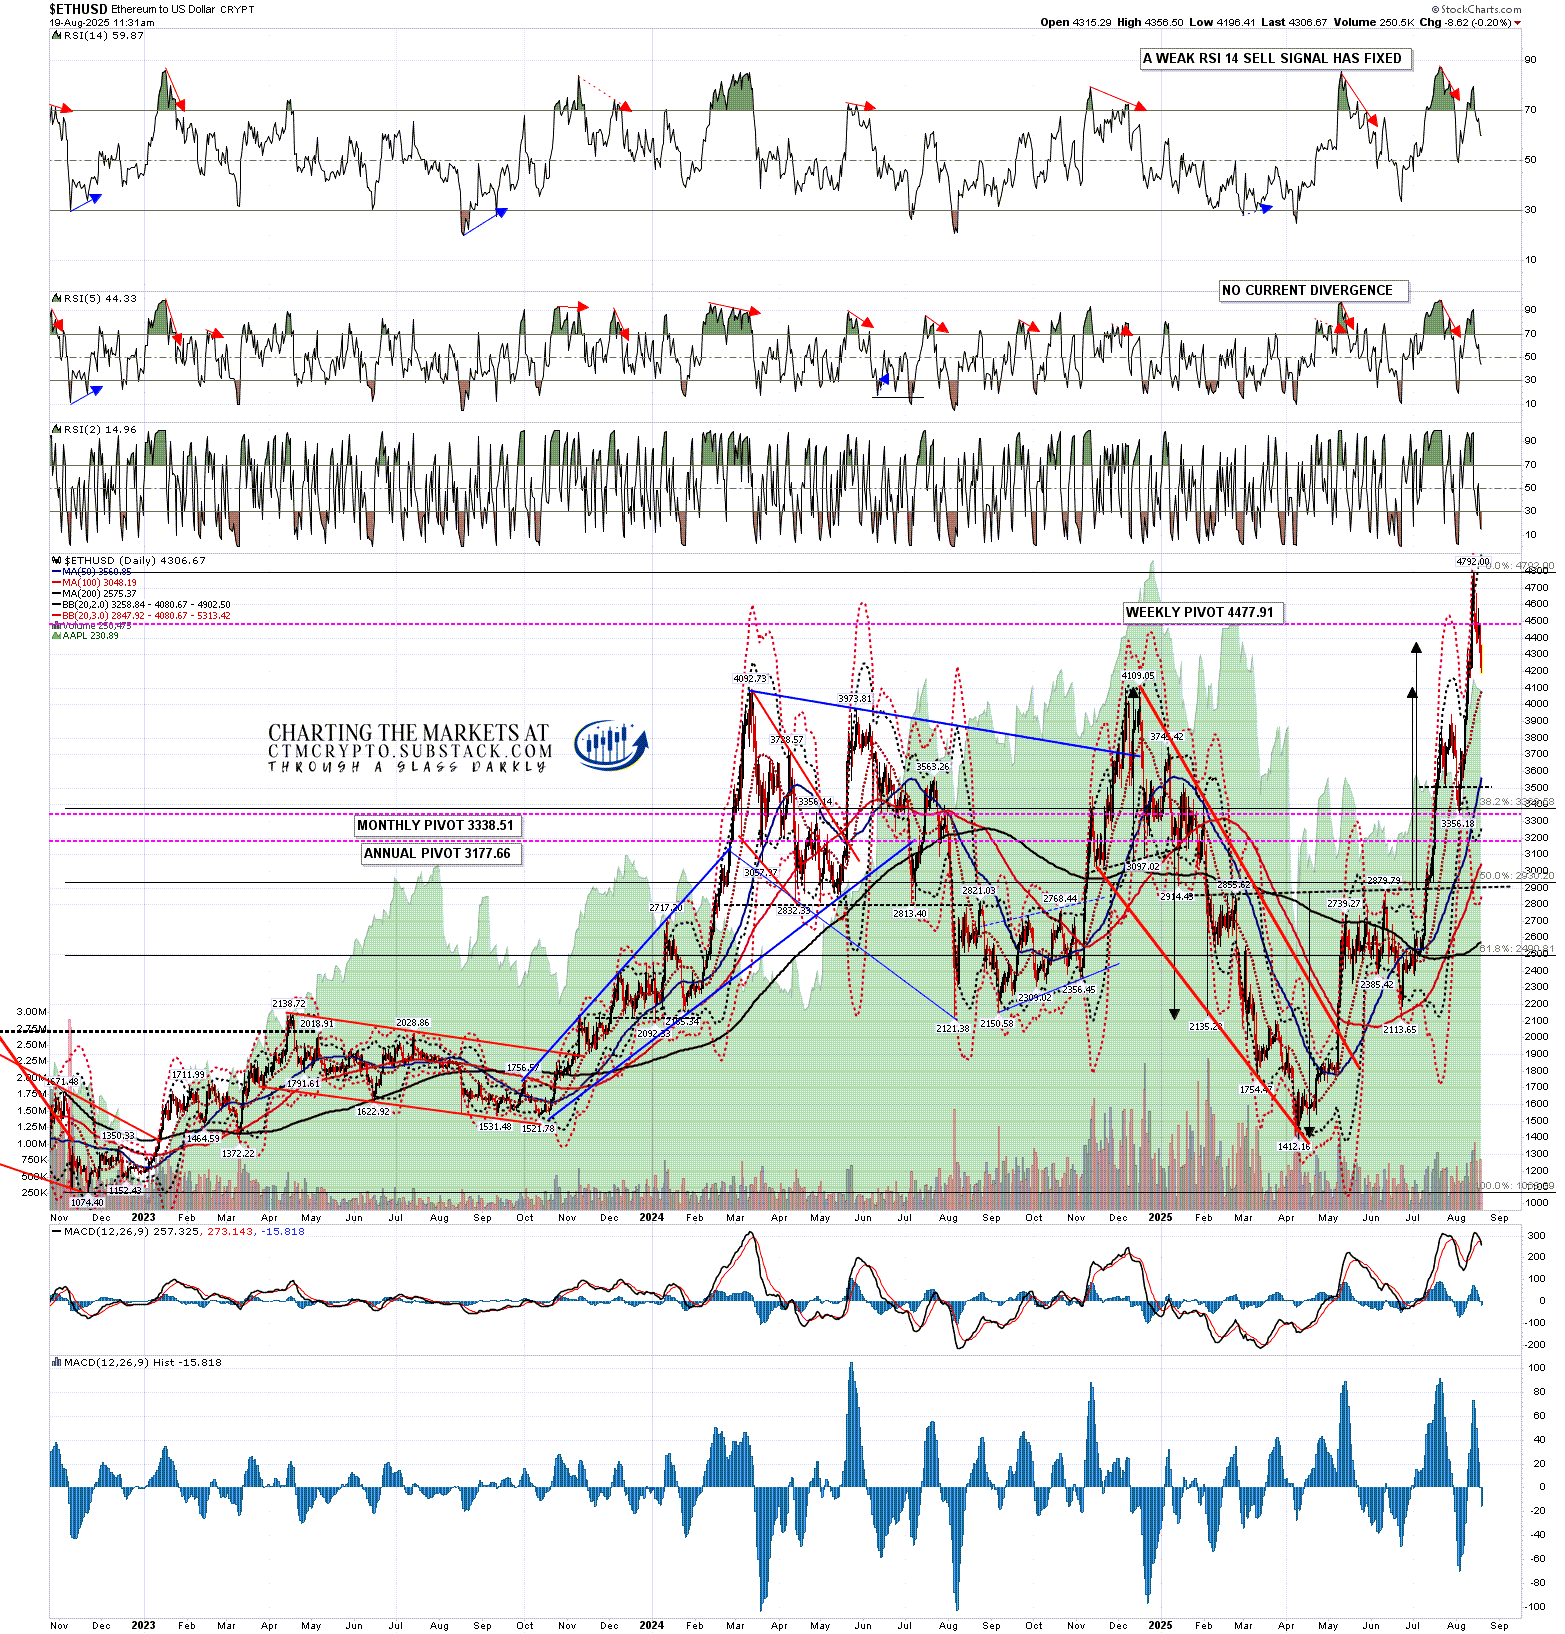
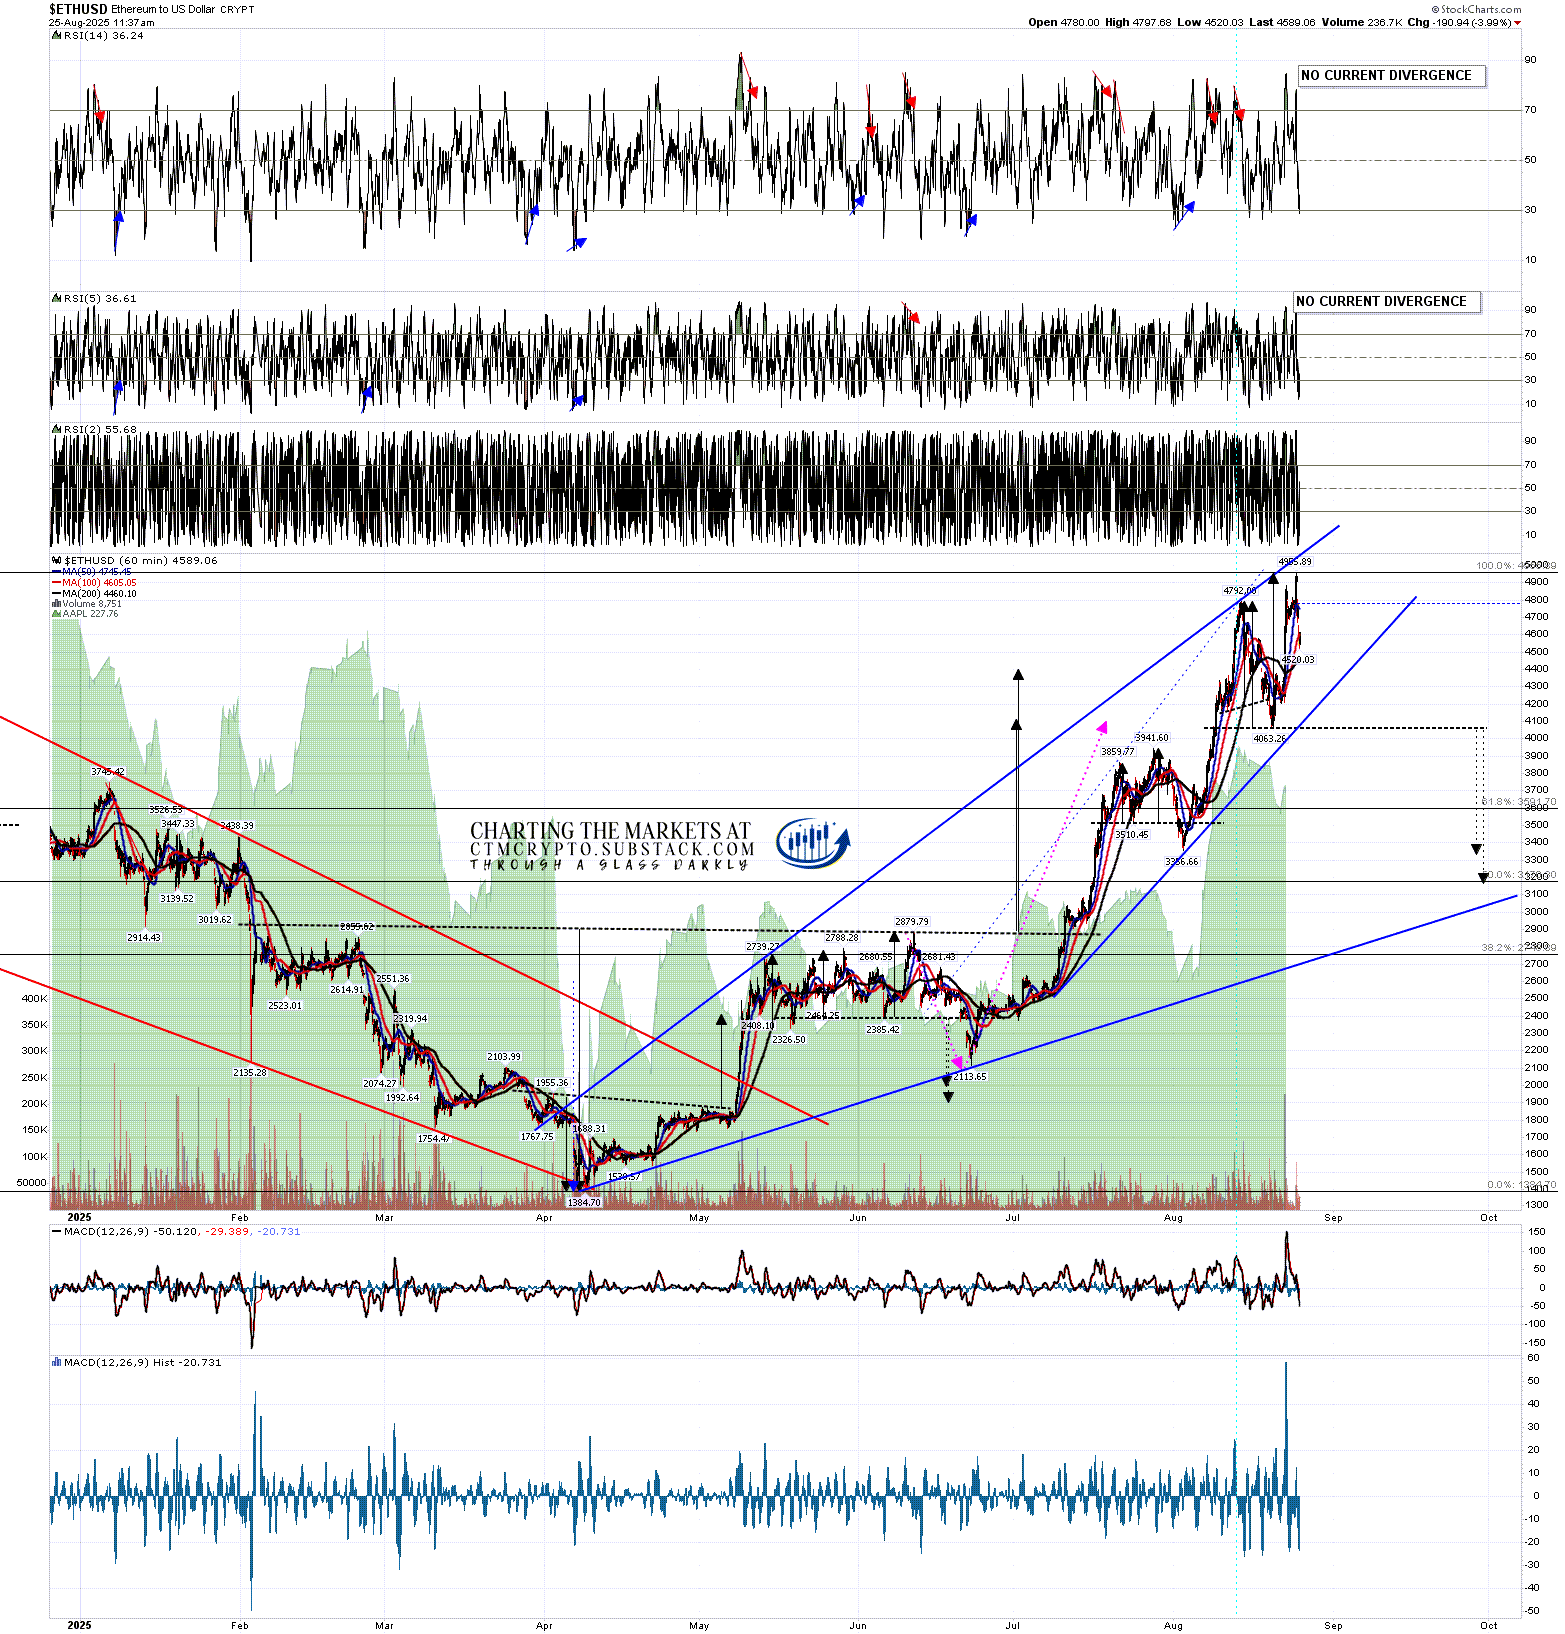
On Friday morning the only one of Bitcoin, Ethereum and Solana that had a good retracement setup was Bitcoin. That has now changed. On Ethereum there was unfinished business at a retest of the 2021 all time high at 4865.94, and that was resolved with the new all time high at 4955.89 over the weekend.
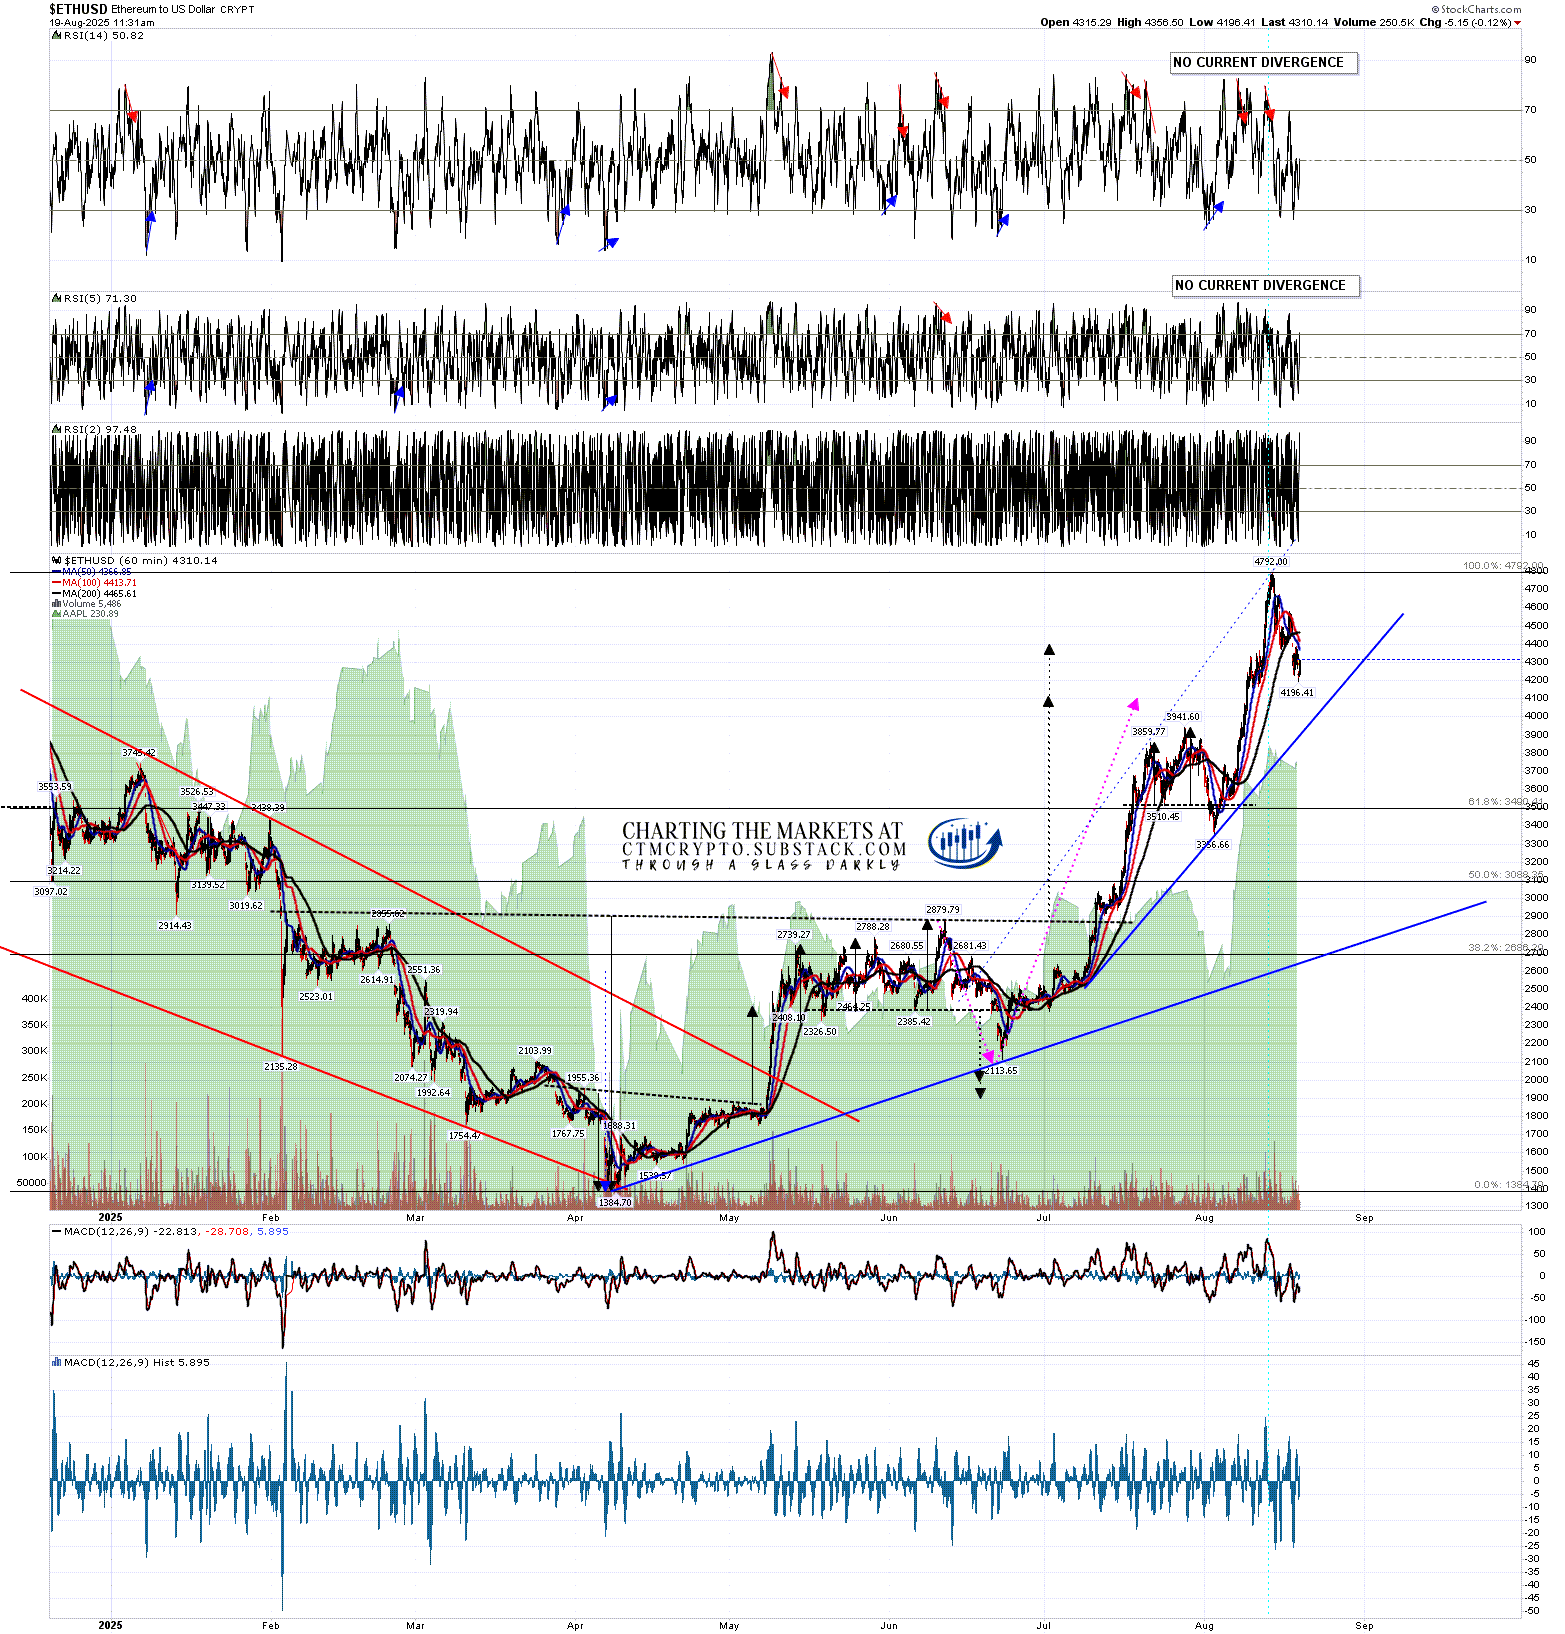
With that new all time high over the weekend, a possible double top setup has formed and, on a break back below last weeks low at 4063, the double top target would be in the 3150 to 3330 area. The lower target is very close to a 50% retracement of the move up from the April low.
ETHUSD 60min chart:
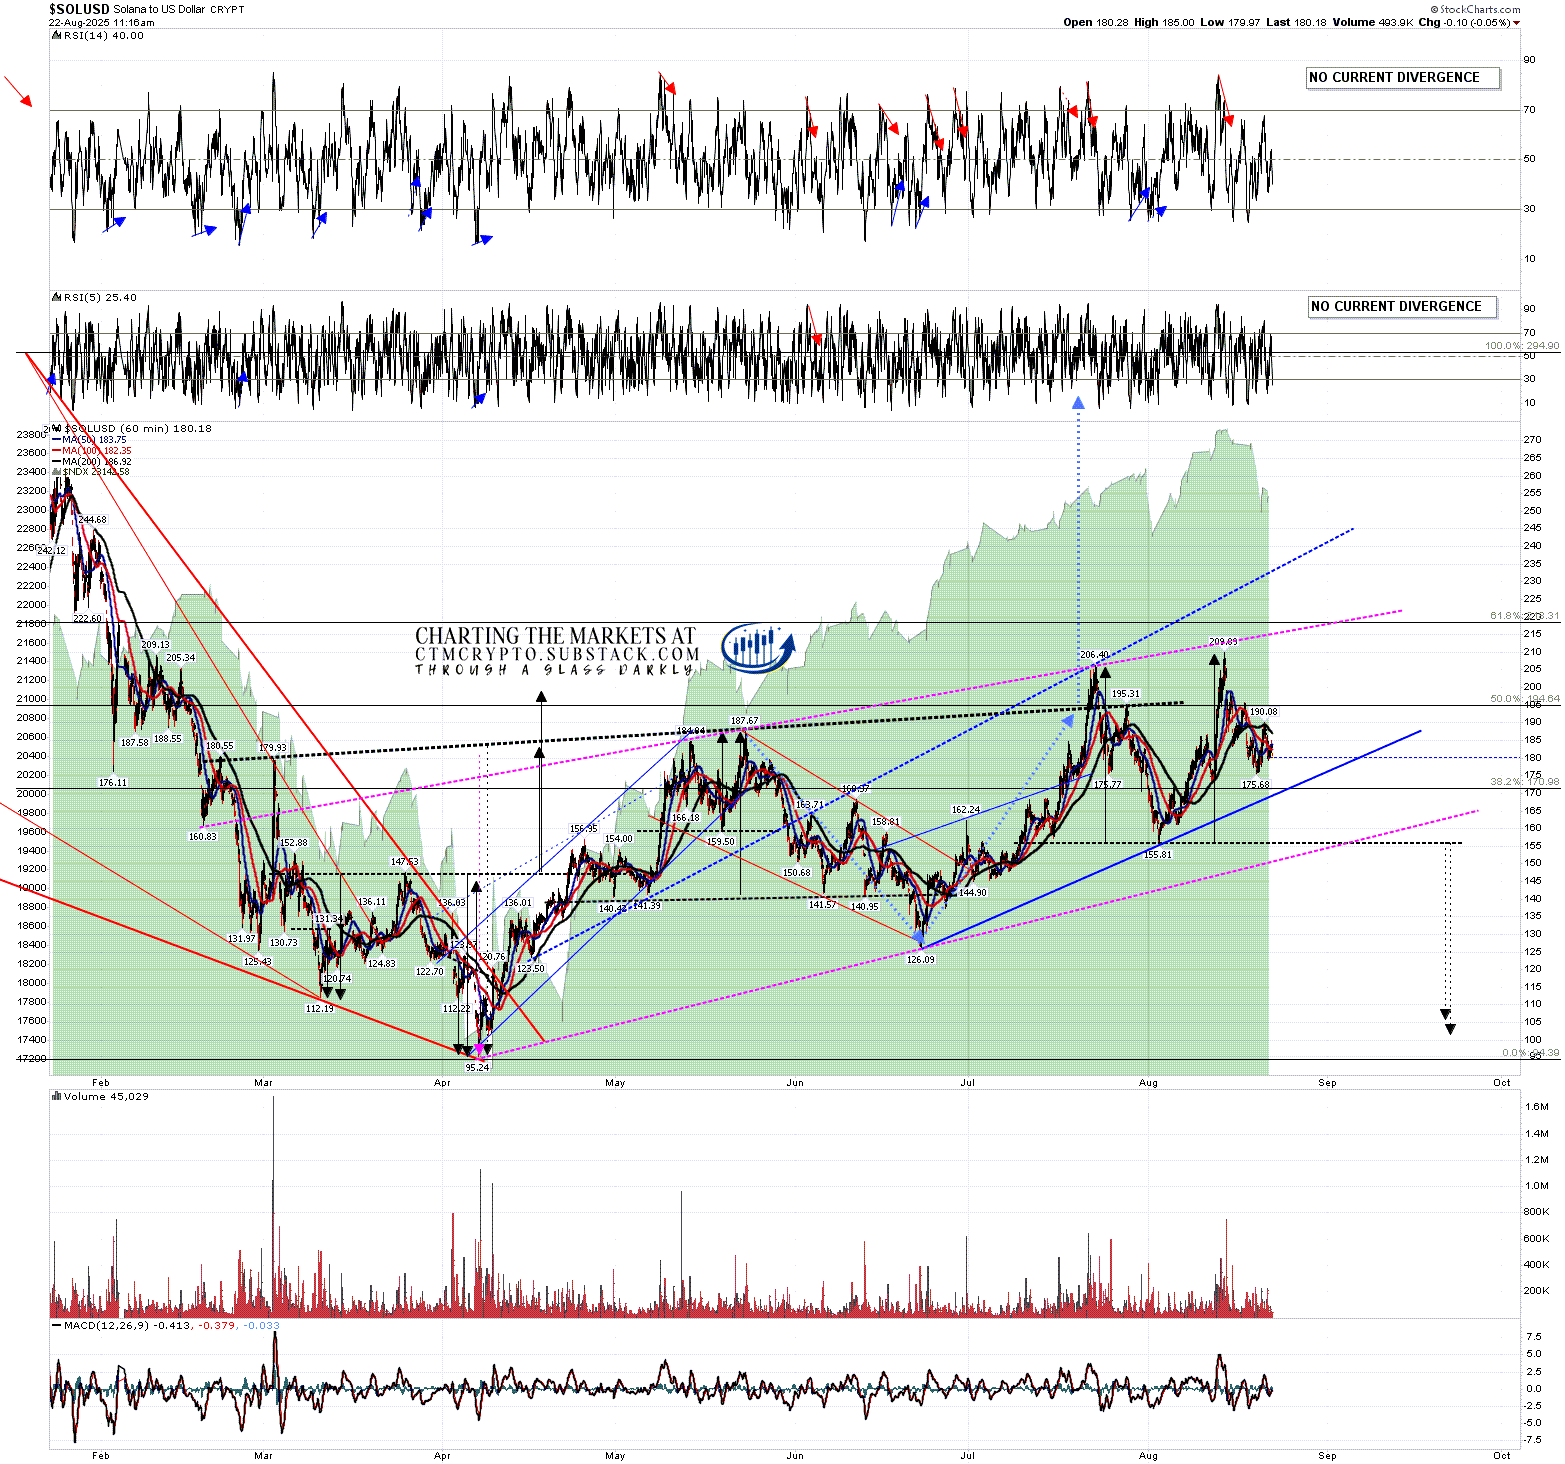
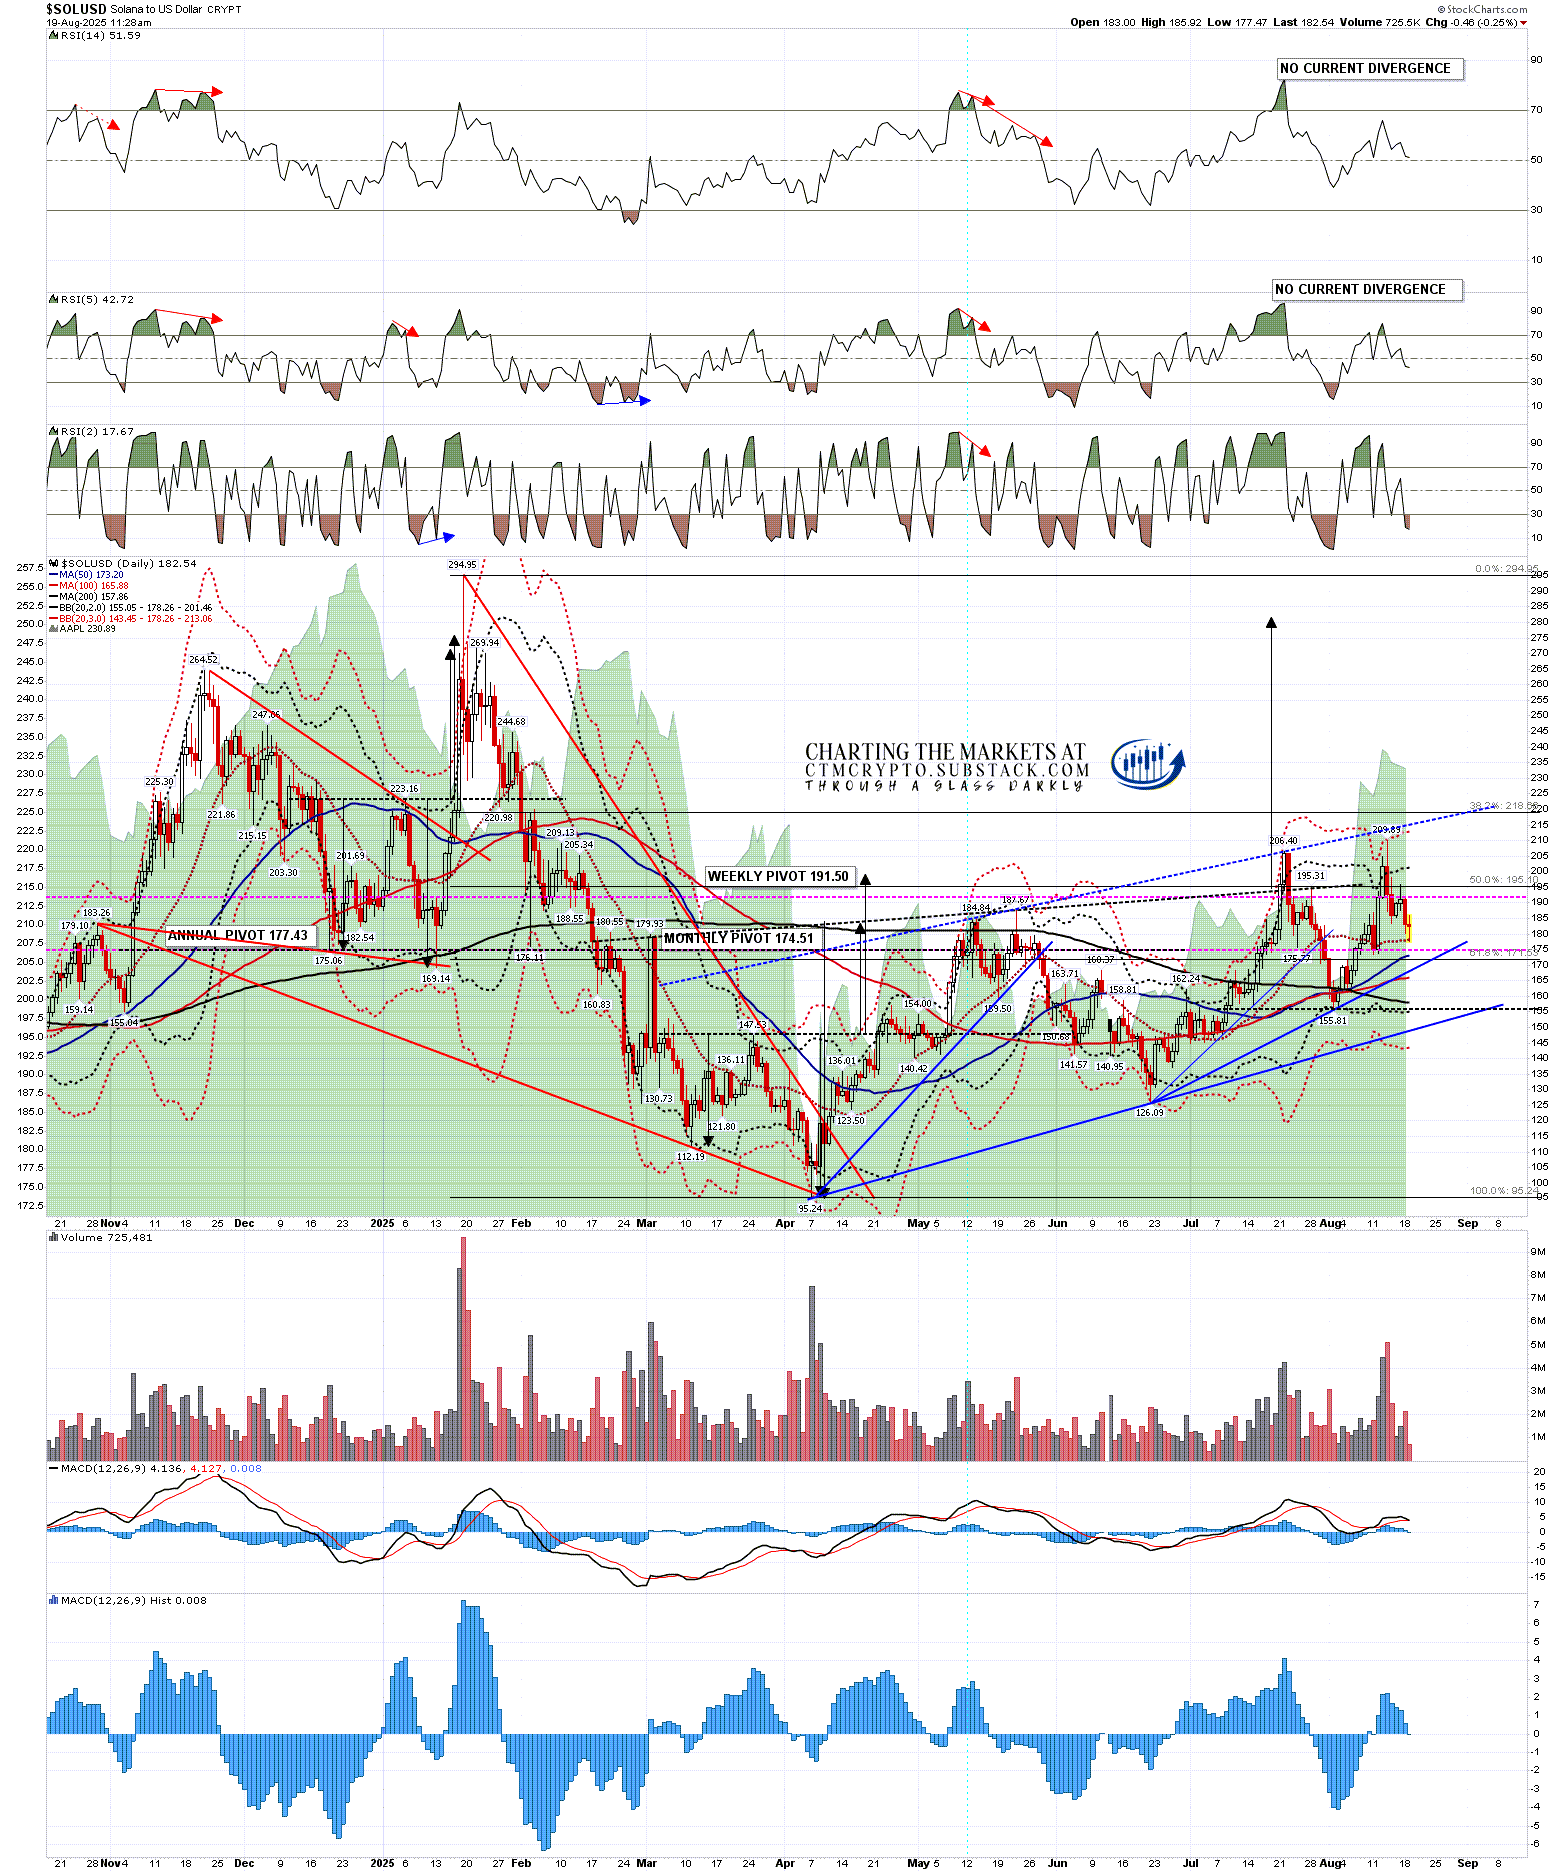
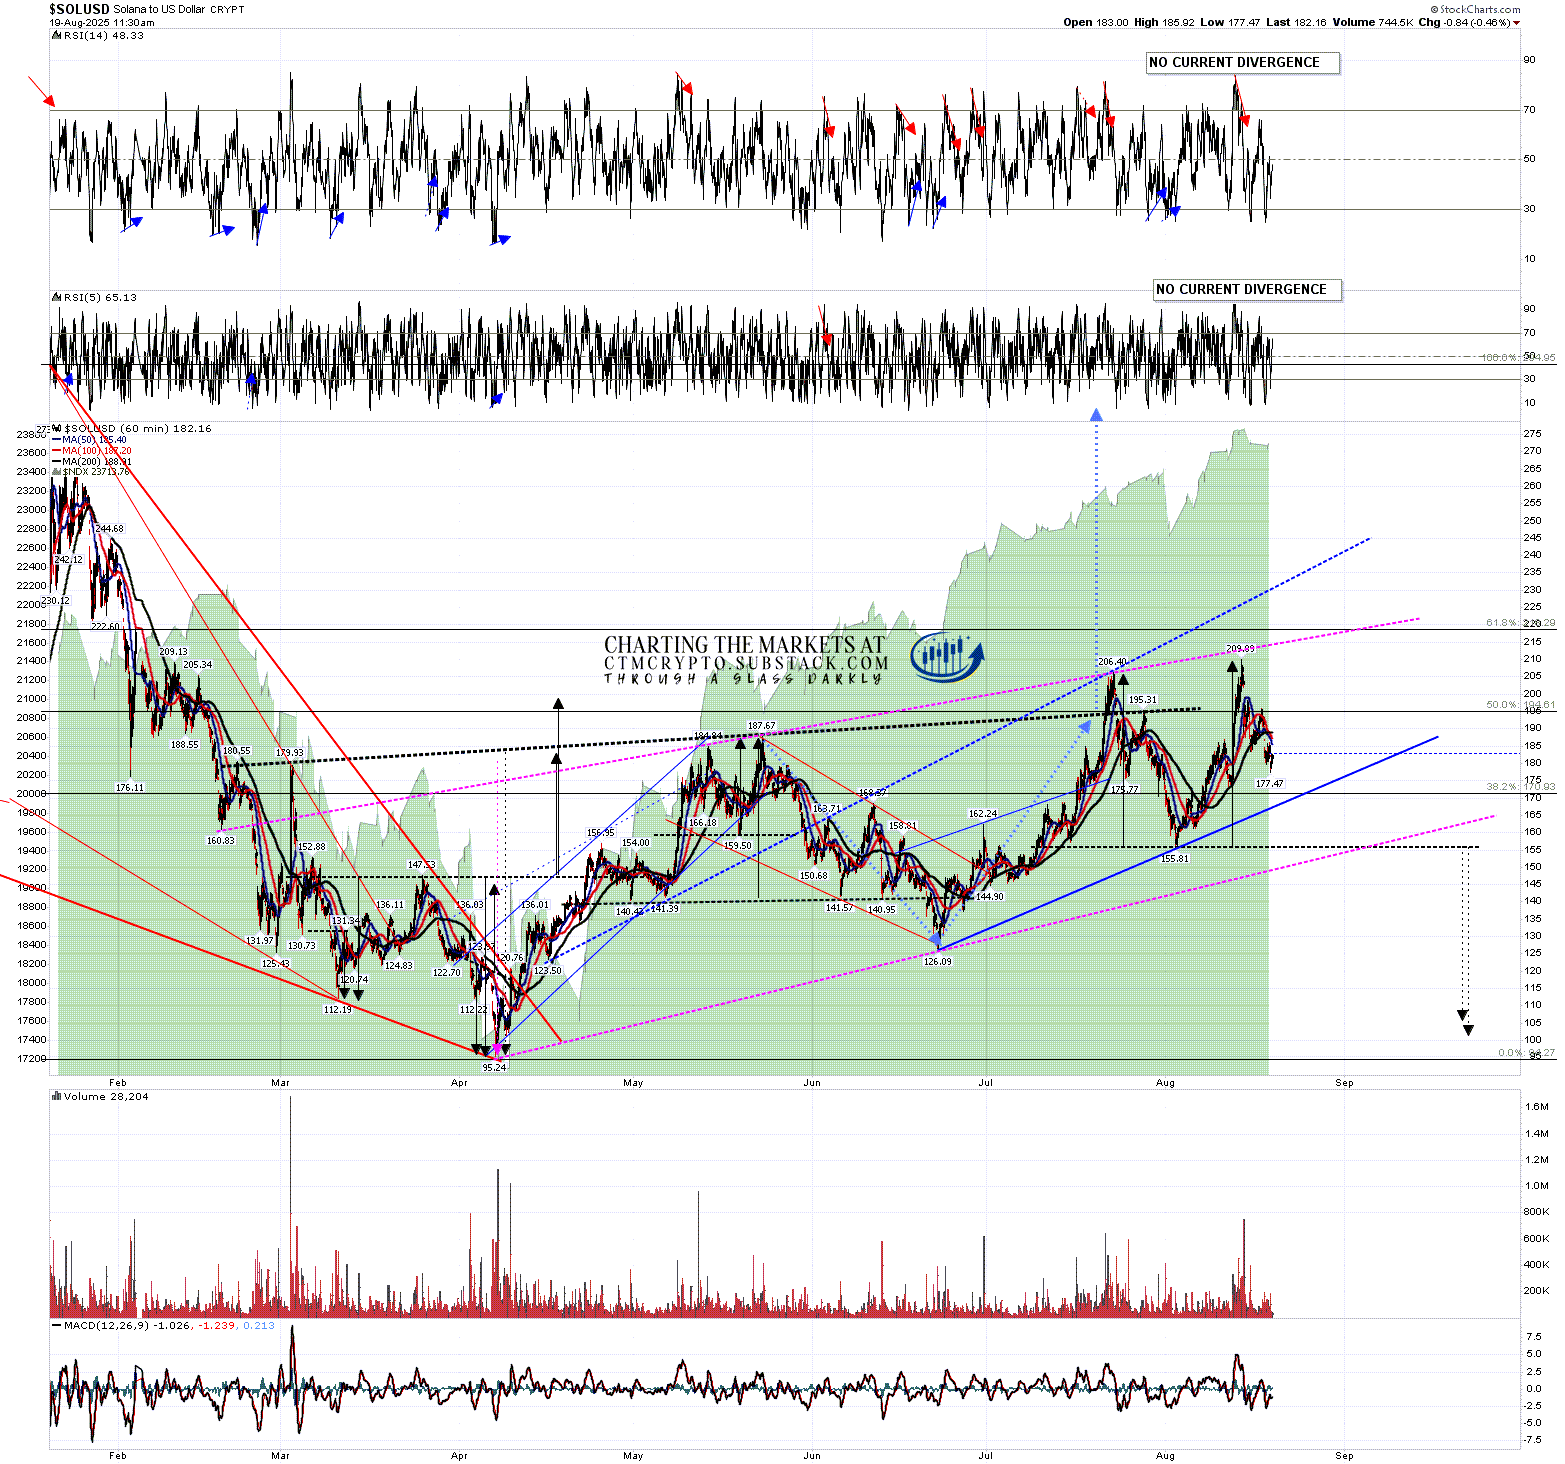
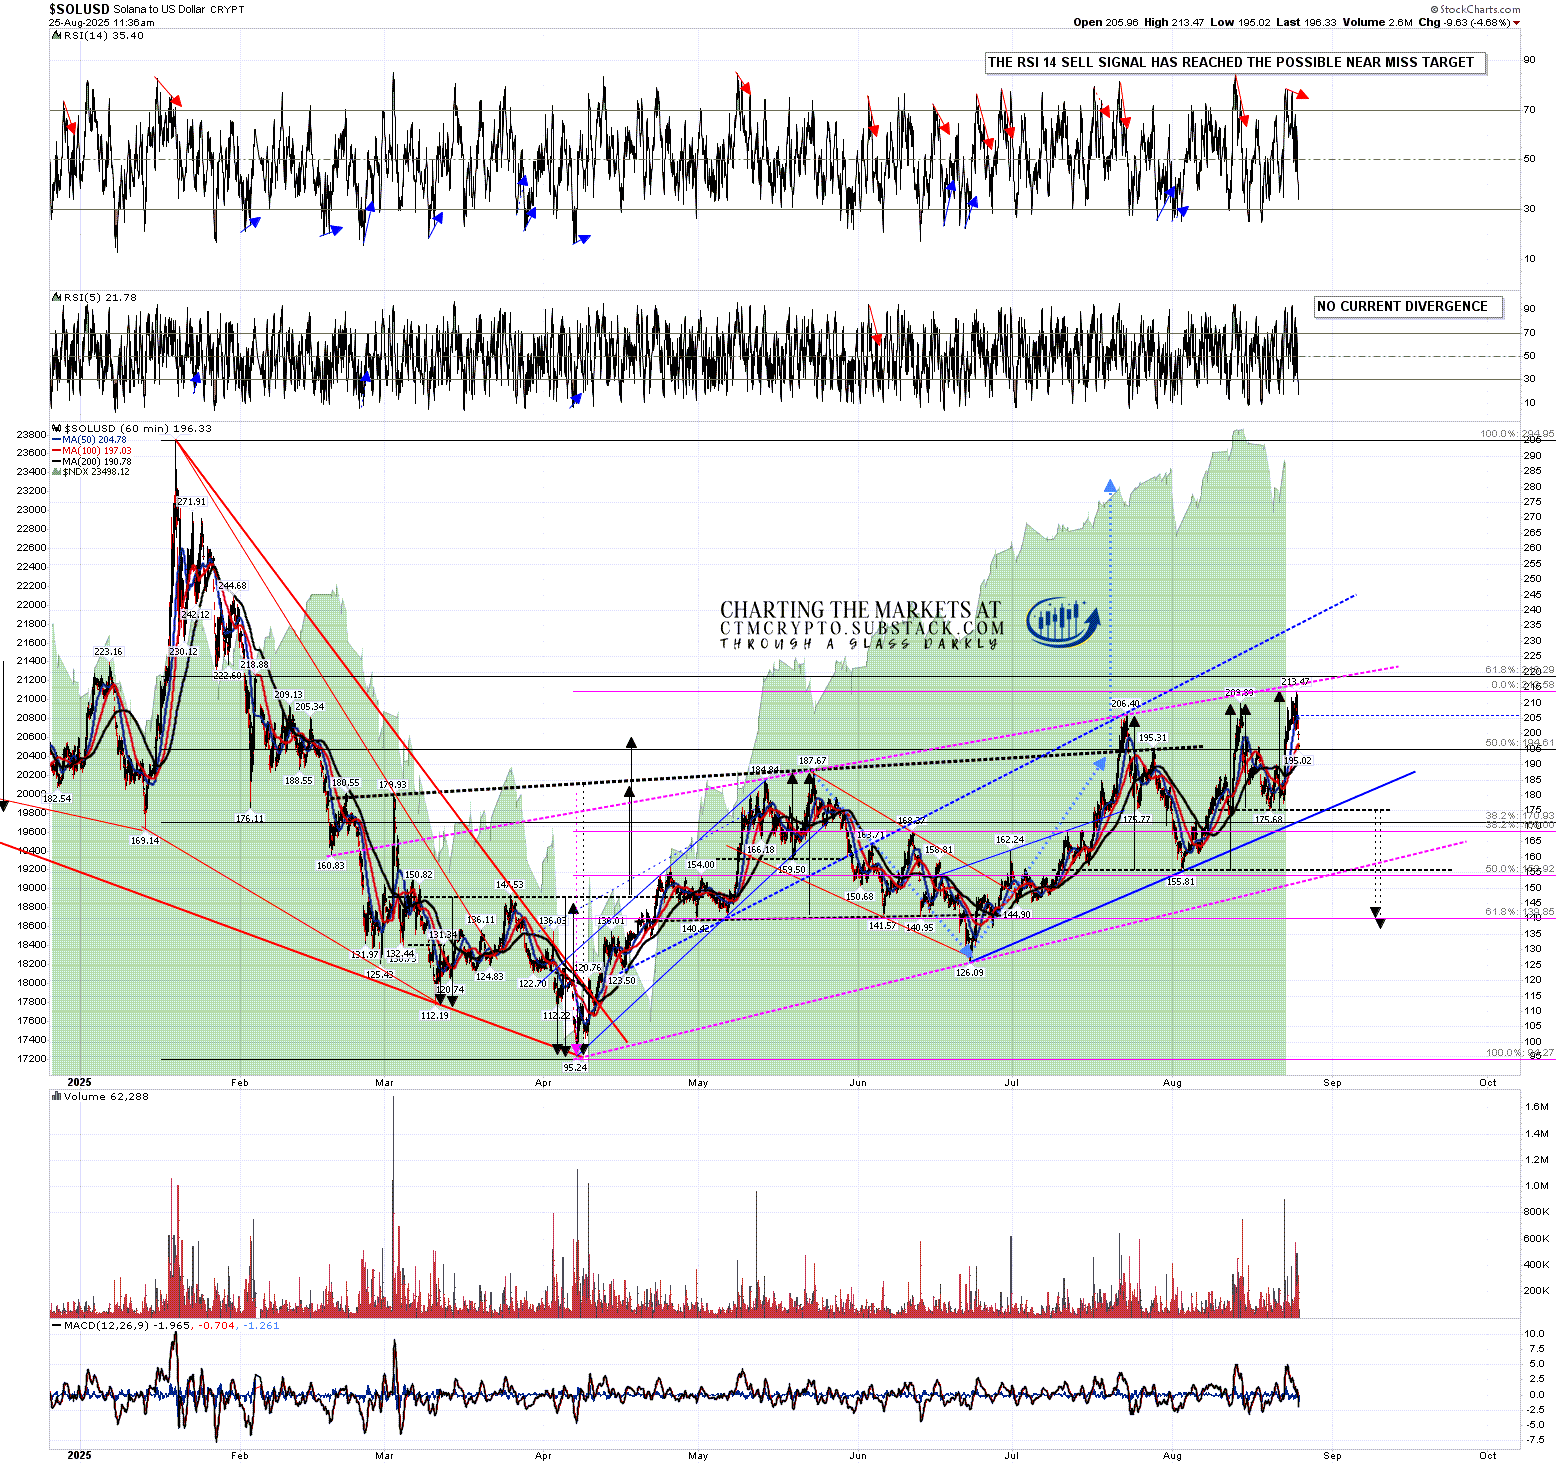
Solana made a new high for August over the weekend as well and a possible double top setup has also formed there. On a break back below last weeks low at 175.68, the double top target would be in the 137 to 140 area, close to a 61.8% retracement of the move up from the April low.
SOLUSD 60min chart:
Overall this is now a much better overall retracement setup than the one I was looking at on Friday morning, and most likely we will see which way this is likely to break this week and very possibly today. If Bitcoin breaks much below the weekly middle band at 108,010 then that will ruin the short term reversal (back up) setup and firmly fix the next target in the 99k to 100k area.
If Bitcoin returns to a retest of the all time high instead, that will likely ruin the double top setups on Ethereum and Solana and clear the way for continuation higher.
I posted the following note at the end of my post on 13th Jan:
My preferred scenario here is that we see a bullish consolidation either now or soon on Crypto that takes a few months and sets up the next big leg up on Crypto into a possible bull market high in late 2025.
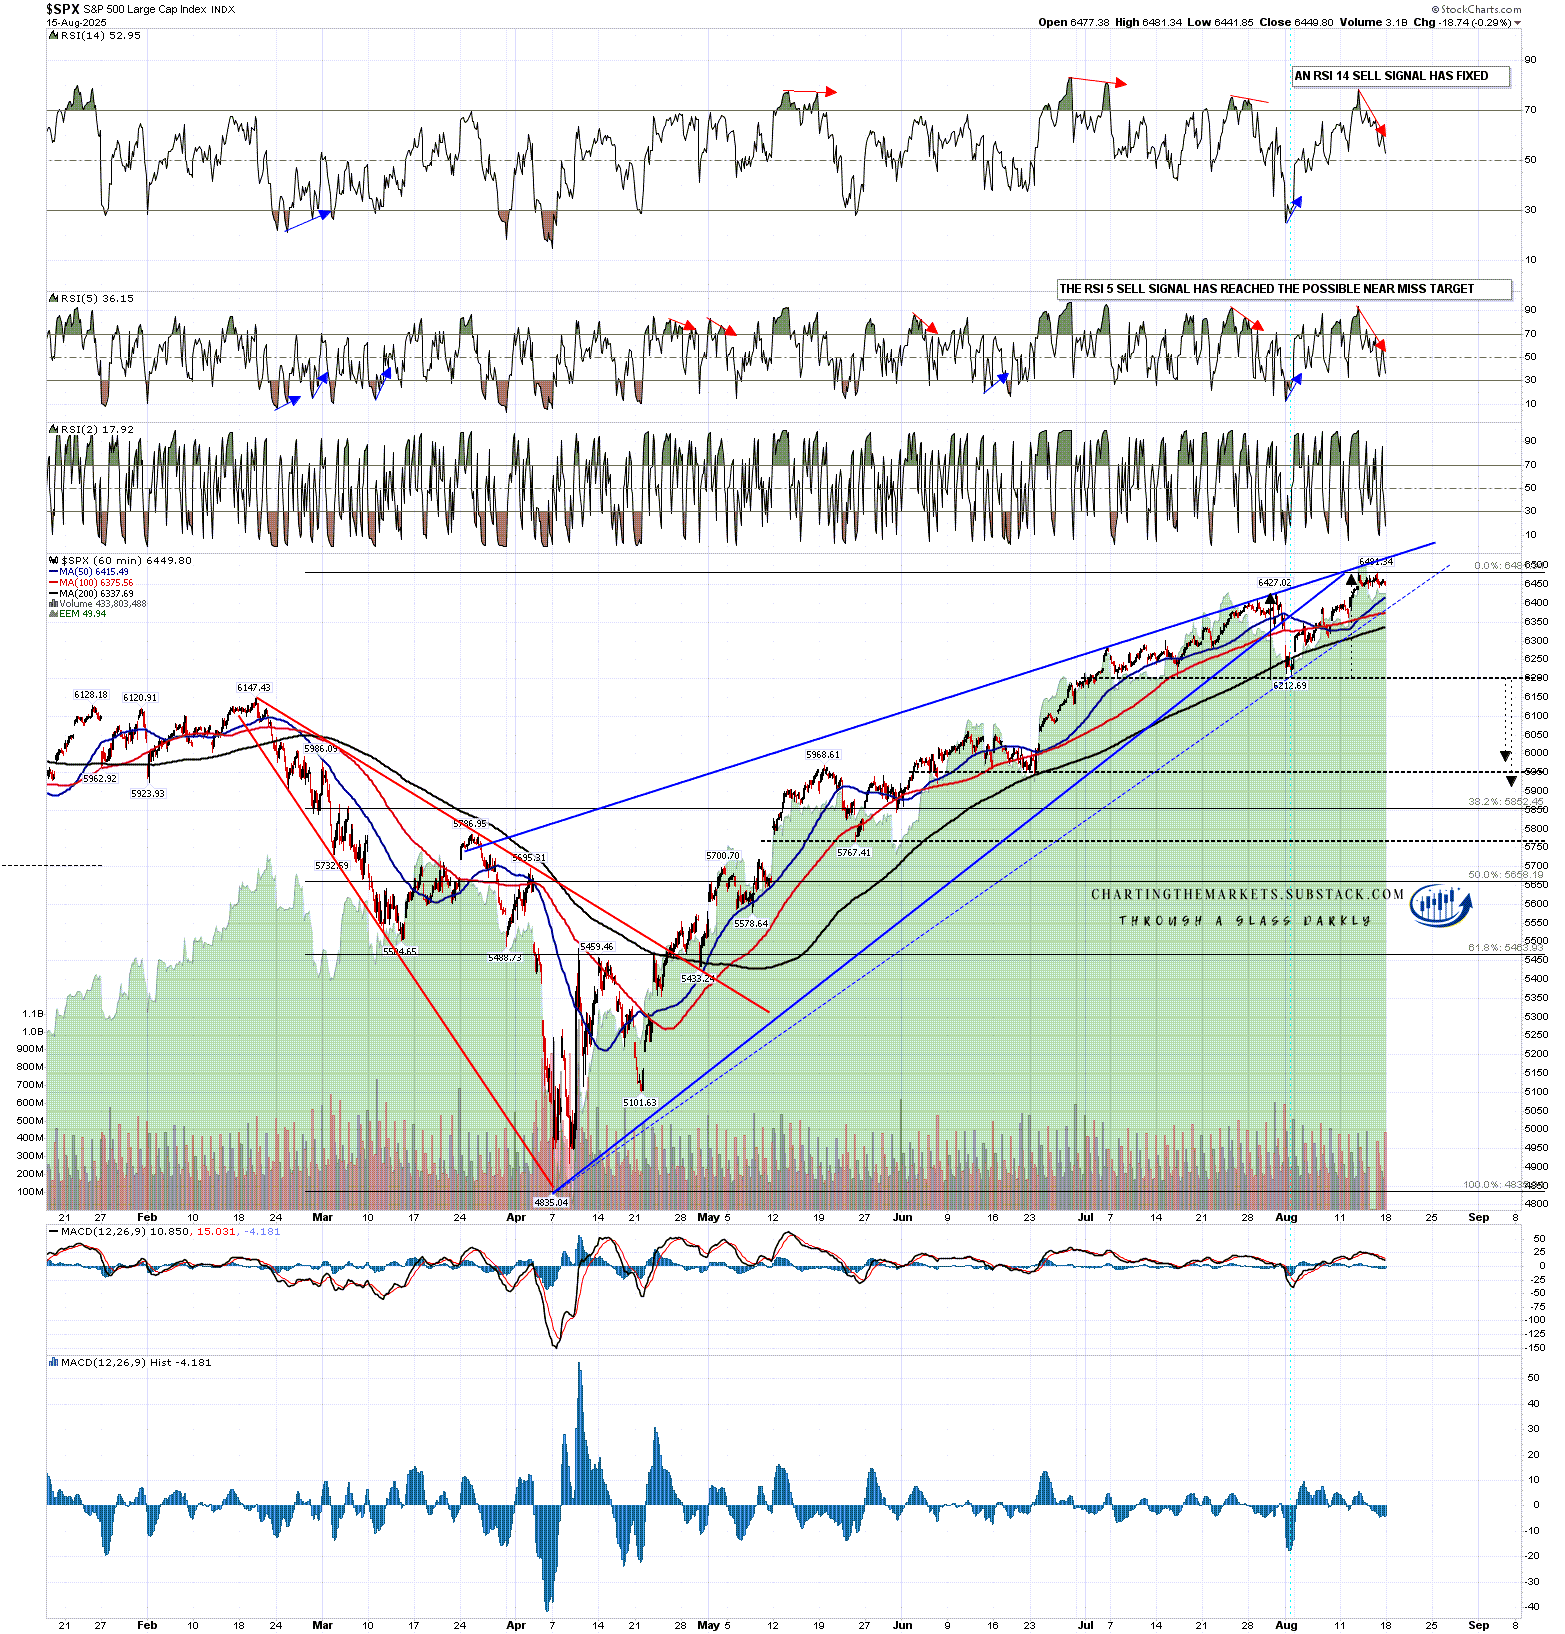
I still like this scenario for a possible overall bull market high on Crypto on or around the end of this year but, as I mentioned at the start, we have currently seen little evidence that Crypto can sustain a bullish move while equities are in a strong downtrend. I’m not seeing any strong evidence yet that the current inflection point on equity indices is the start of a strong downtrend but, if it should evolve into that, Crypto would likely be dragged down with it.
Since I started doing daily videos on Crypto early last year I’ve got Crypto direction right most of the time and more so than any other analyst anywhere that I’m aware of. I’m a very good analyst and all three of these instruments are very classical chartist friendly. I’m not much of a marketer though, and the free Crypto substack I set up last August still has less than 200 readers. I’d like to increase that readership and invite any suggestions on how I could do that.
I am thinking about setting up a second YouTube Crypto channel and recording videos giving likely market direction without requiring the viewers to have some knowlege of technical analysis to understand the videos. Comments on that and other suggestions very welcome.
If you’d like to see more of these posts and the other Crypto videos and information I post, please subscribe for free to my Crypto substack. I also do a premarket video every day on Crypto at 9.05am EST. If you’d like to see those I post the links every morning on my twitter, and the videos are posted shortly afterwards on my Youtube channel.