
In my post on the morning of Wednesday 30th July I was looking at the pattern setups on SPX, QQQ and DIA and saying that these delivered a very nice setup for at least a short time high forming there.
In my post on the morning of Friday 1st August I was looking at the first real signs of weakness on the US equity indices since the April low after the strong breaks of the daily middle bands on DIA and IWM on Thursday, and saying that confirmation was needed with further breaks of the daily middle bands on SPX and QQQ.
In my post on Sunday 3rd August I was looking at the strong breaks of the daily middle bands on SPX and QQQ on Friday and the closes well below the 3sd daily lower bands on DIA and IWM. I proposed a rally early this week to backtest the daily middle bands on SPX and QQQ while setting up high quality H&S right shoulders on both.
In my post on Tuesday 5th August I was looking at the modest breaks back over the daily middle bands on SPX and QQQ on Monday and noting that conversion of those to support would open possible all time high retests and hard fails there would strongly support the H&S patterns forming on both.
On Tuesday we saw a modest rejection back under the daily middle bands on SPX and QQQ, and yesterday we saw larger breaks back over those daily middle bands, with both DIA and IWM getting close to tests of their daily middle bands. Overnight
Could the possible H&S patterns I drew on Sunday still play out? Yes, but that would really require a strong rejection back below the daily middle bands on SPX and QQQ today, and we’re not seeing any sign of that happening yet. If it doesn’t happen then the obvious lean is that we see all time high retests on SPX and QQQ, possibly to make second highs on good quality double tops, and we could see the same on DIA, and perhaps also a retest of the July high on IWM, with the all time high there having been made in November last year.
Mainly I would be watching hourly divergences on all of these and the three high quality resistance trendlines I drew last week and I wanted to have a look at those trendlines today to show where those resistance levels are now.
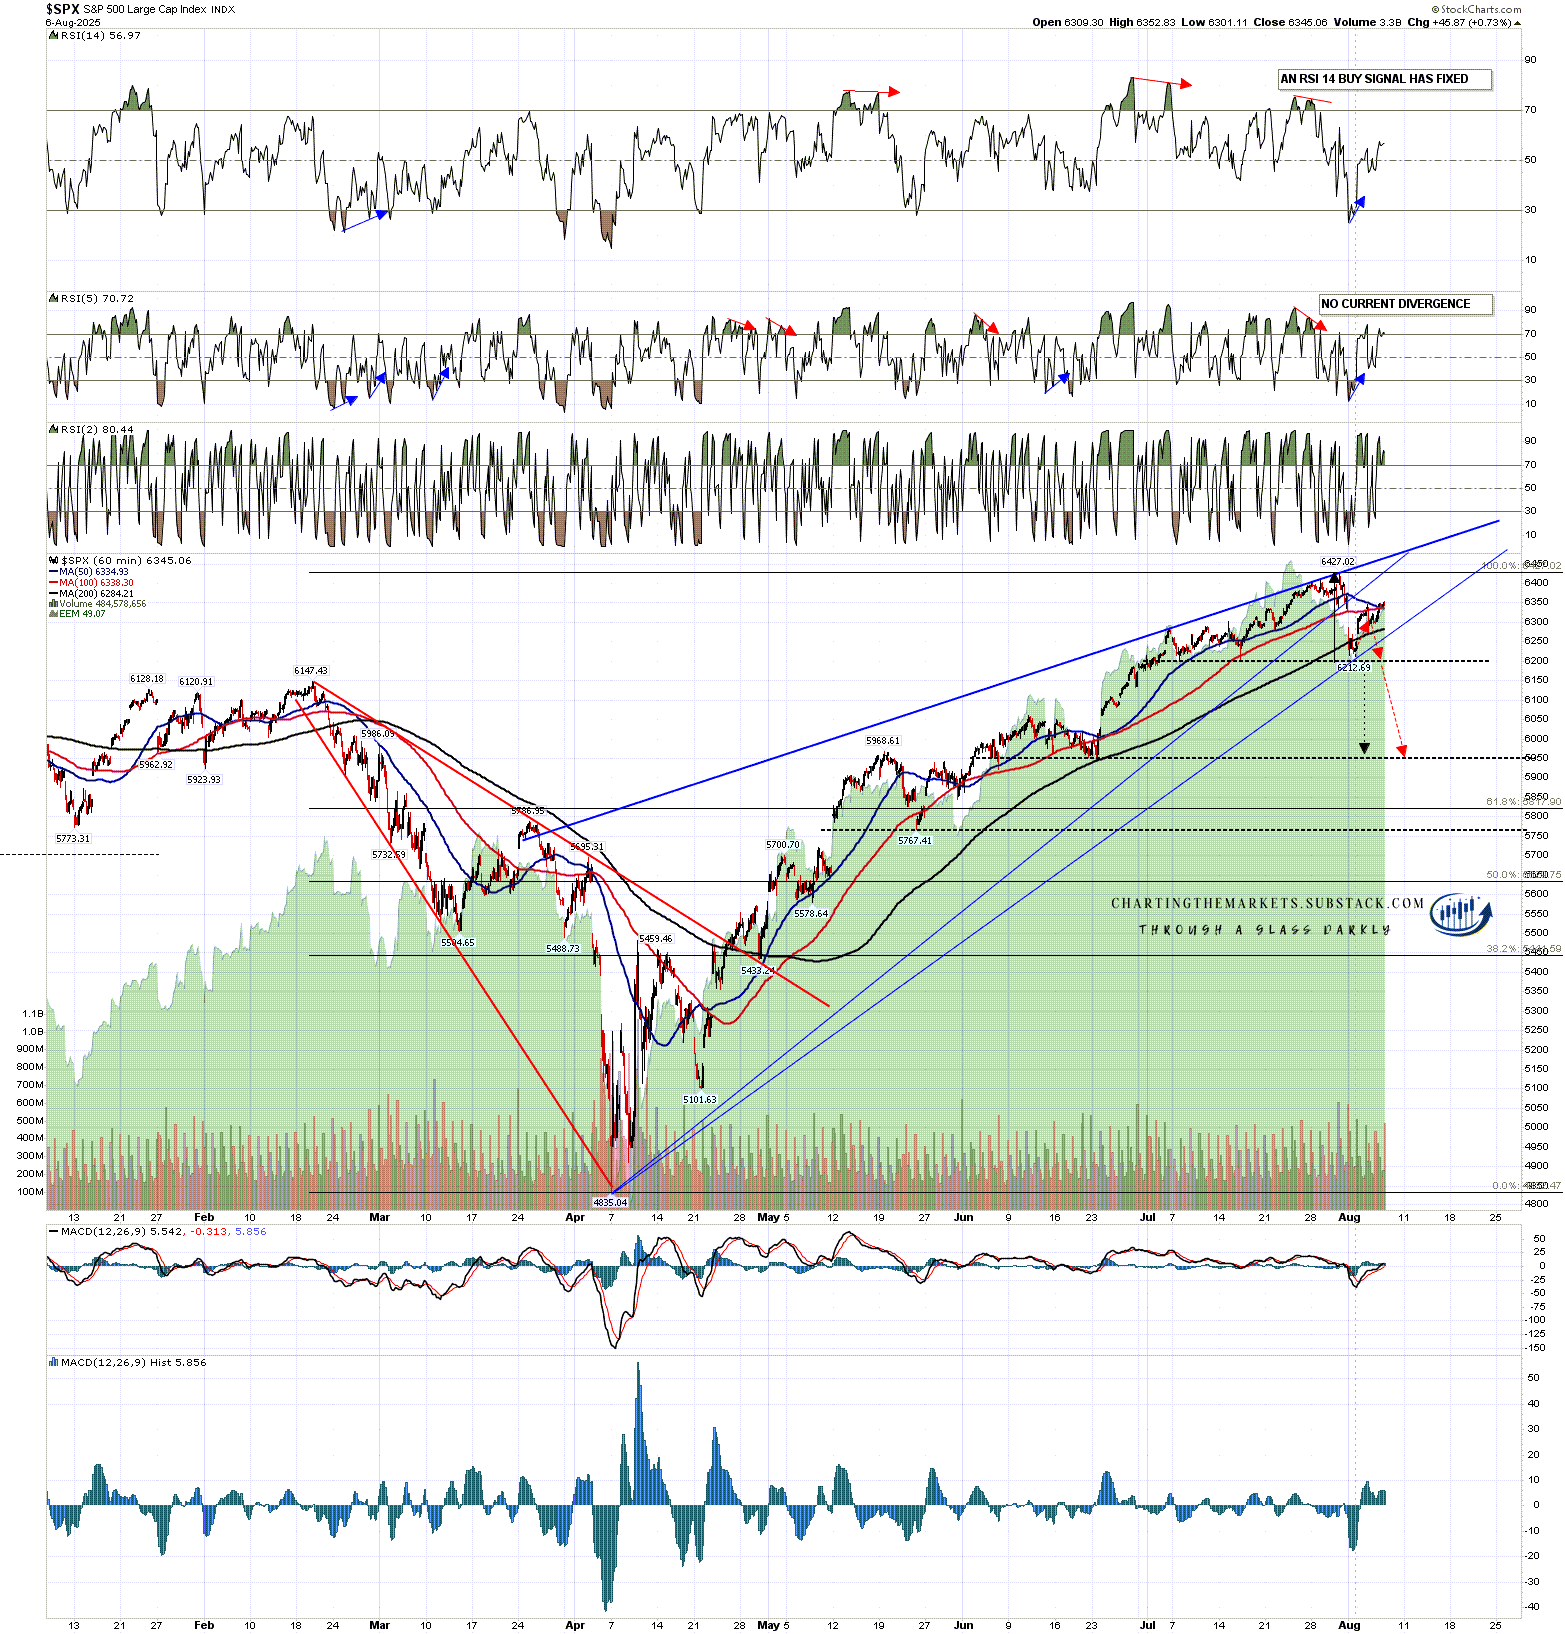
Firstly though, on the SPX daily chart there was a close thirty handles over the daily middle band yesterday and that was a solid break of about 0.5%. The break back over on QQQ (not shown) was a stronger break of about 1%.
SPX daily chart:

On SPX the resistance trendline is slightly changed by the final high last week from the one I posted last Wednesday but is still a high quality three touch resistance trendline. This may get overthrown bearishly of course on another test, but is the kind of trendline that, subject to an overthrow, I would expect to hold at least until we see a decent retracement of the move up from the April low, and we still haven’t seen one of those yet. This favors a topping pattern of some kind forming here regardless of what we see next.
A retest of the all time high would be at 6427.02 of course and if we see continuation on to the resistance trendline then that is currently in the 6485 area. If we see that trendline tested again then I would redraw the wedge support trendline through Friday’s low at 6212.69 as shown below.
SPX 60min chart:
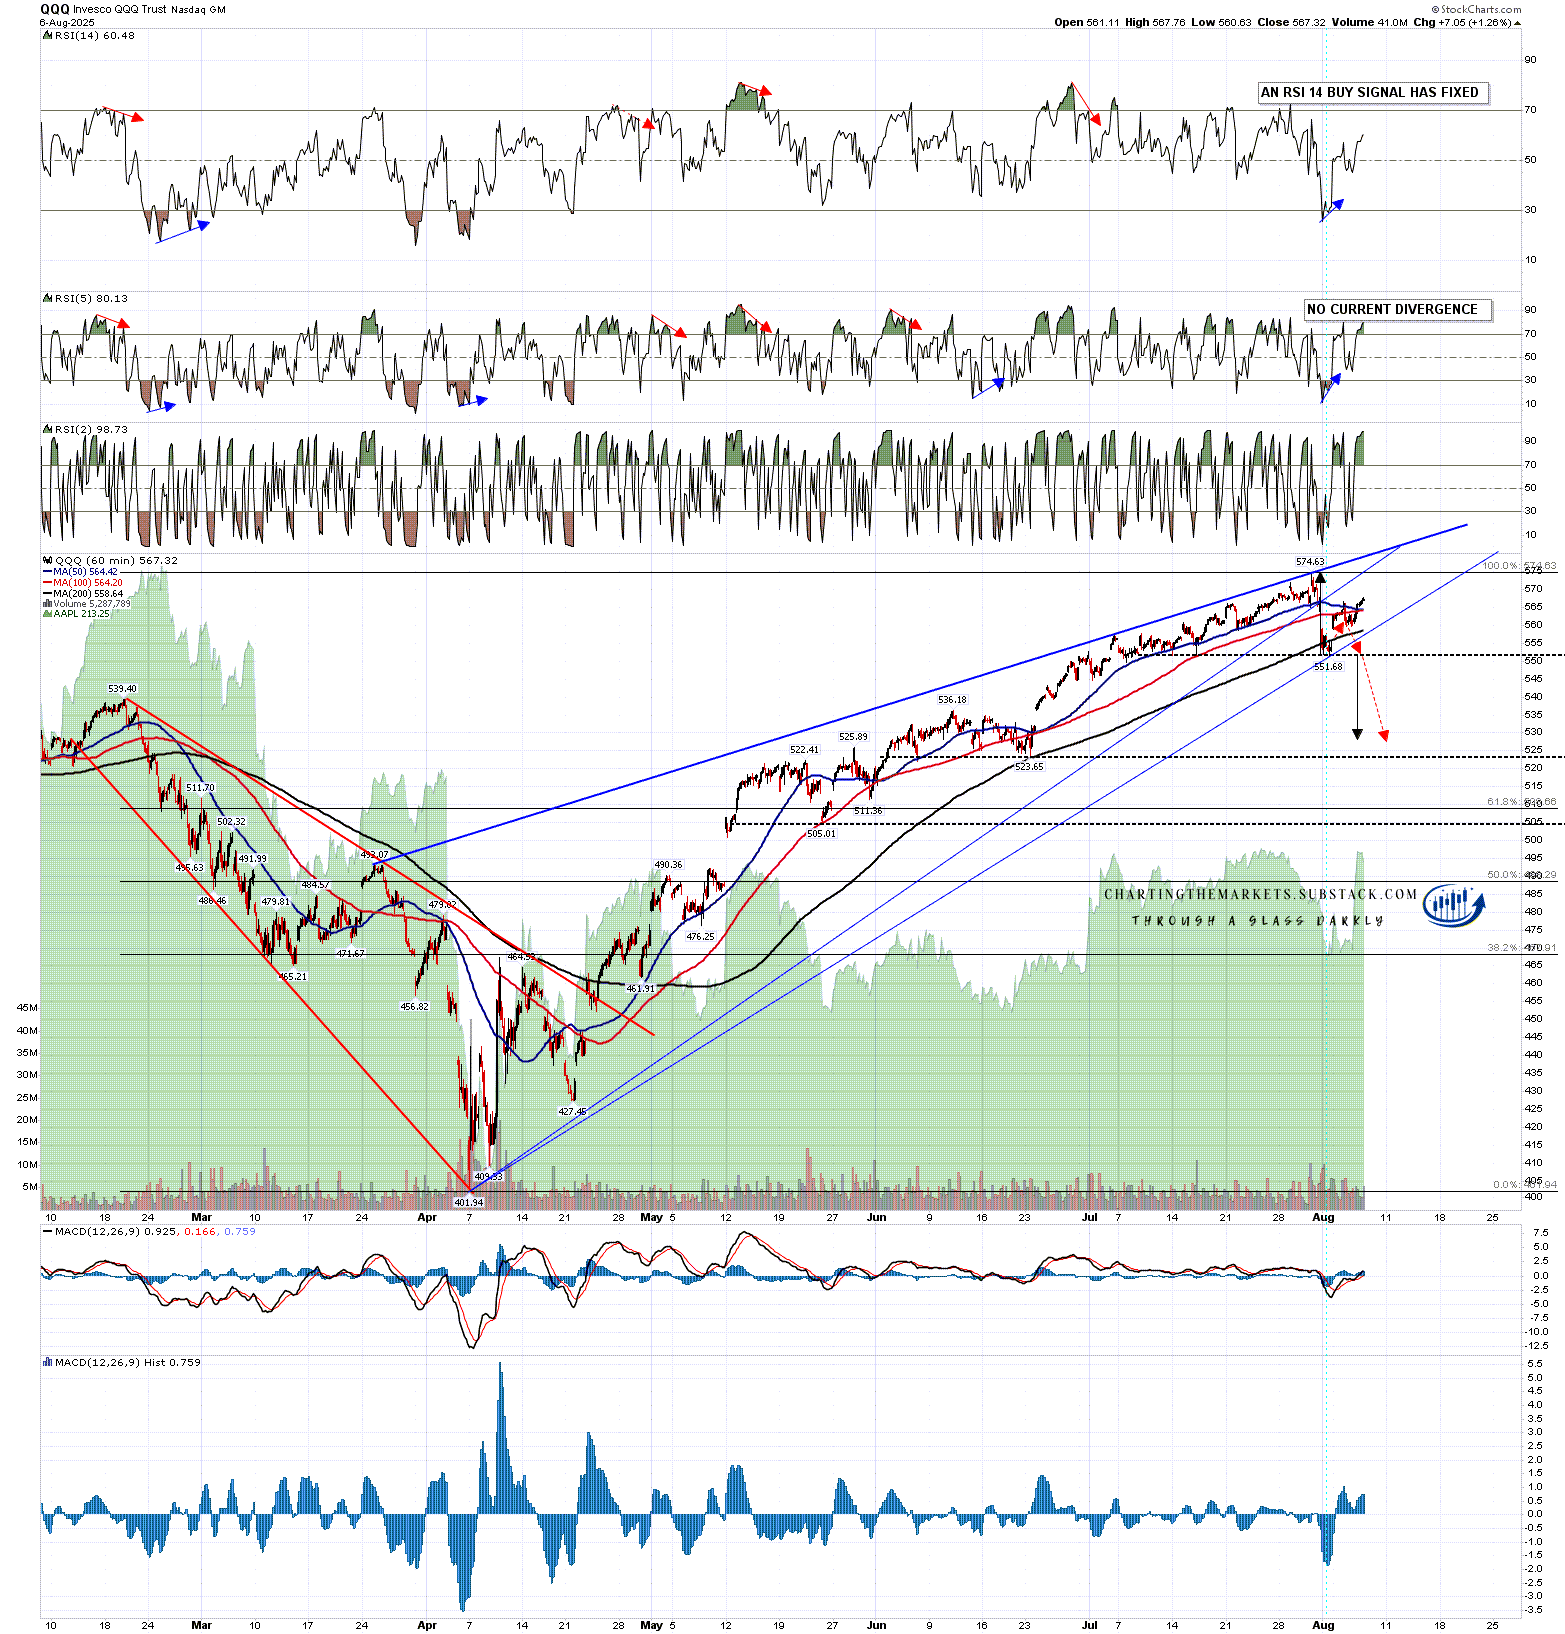
On QQQ the resistance trendline is the same on one I posted on Wednesday last week and is also a high quality three touch resistance trendline. This may get overthrown bearishly of course on another test, but is the kind of trendline that, subject to an overthrow, I would expect to hold at least until we see a decent retracement of the move up from the April low, and we still haven’t seen one of those yet. This favors a topping pattern of some kind forming here regardless of what we see next.
A retest of the all time high would be at 547.63 and if we see continuation on to the resistance trendline then that is currently in the 595 area. If we see that trendline tested again then I would redraw the wedge support trendline through Friday’s low at 551.68 as shown below.
QQQ 60min chart:
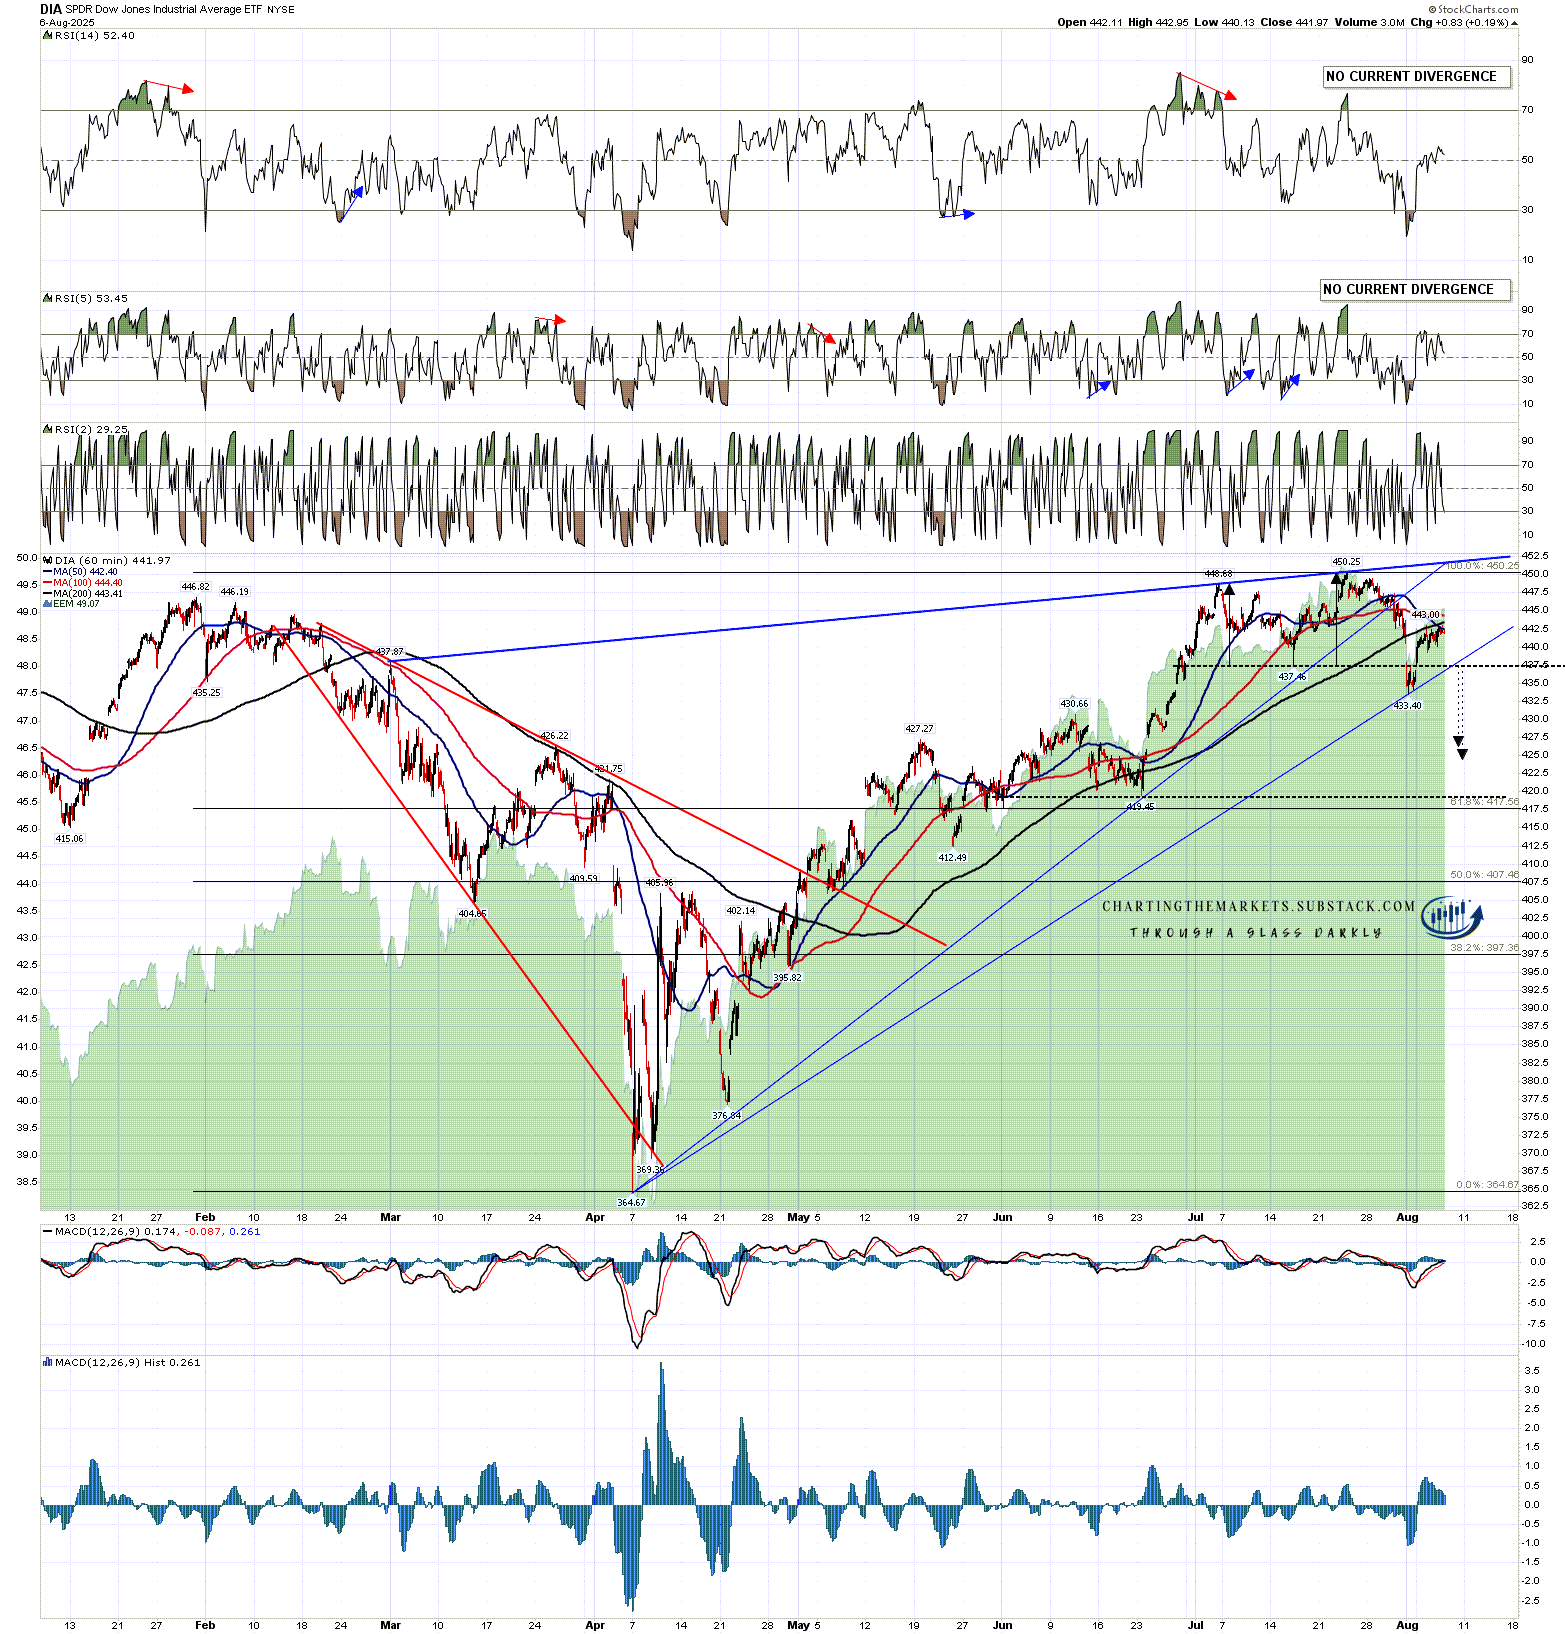
On DIA the resistance trendline is the same on one I posted on Wednesday last week and is also a high quality three touch resistance trendline. This may get overthrown bearishly of course on another test, but is the kind of trendline that, subject to an overthrow, I would expect to hold at least until we see a decent retracement of the move up from the April low, and we still haven’t seen one of those yet. This favors a topping pattern of some kind forming here regardless of what we see next.
A retest of the all time high would be at 450.25 and if we see continuation on to the resistance trendline then that is currently in the 452 area. If we see that trendline tested again then I would redraw the wedge support trendline through Friday’s low at 443.40 as shown below.
DIA 60min chart:
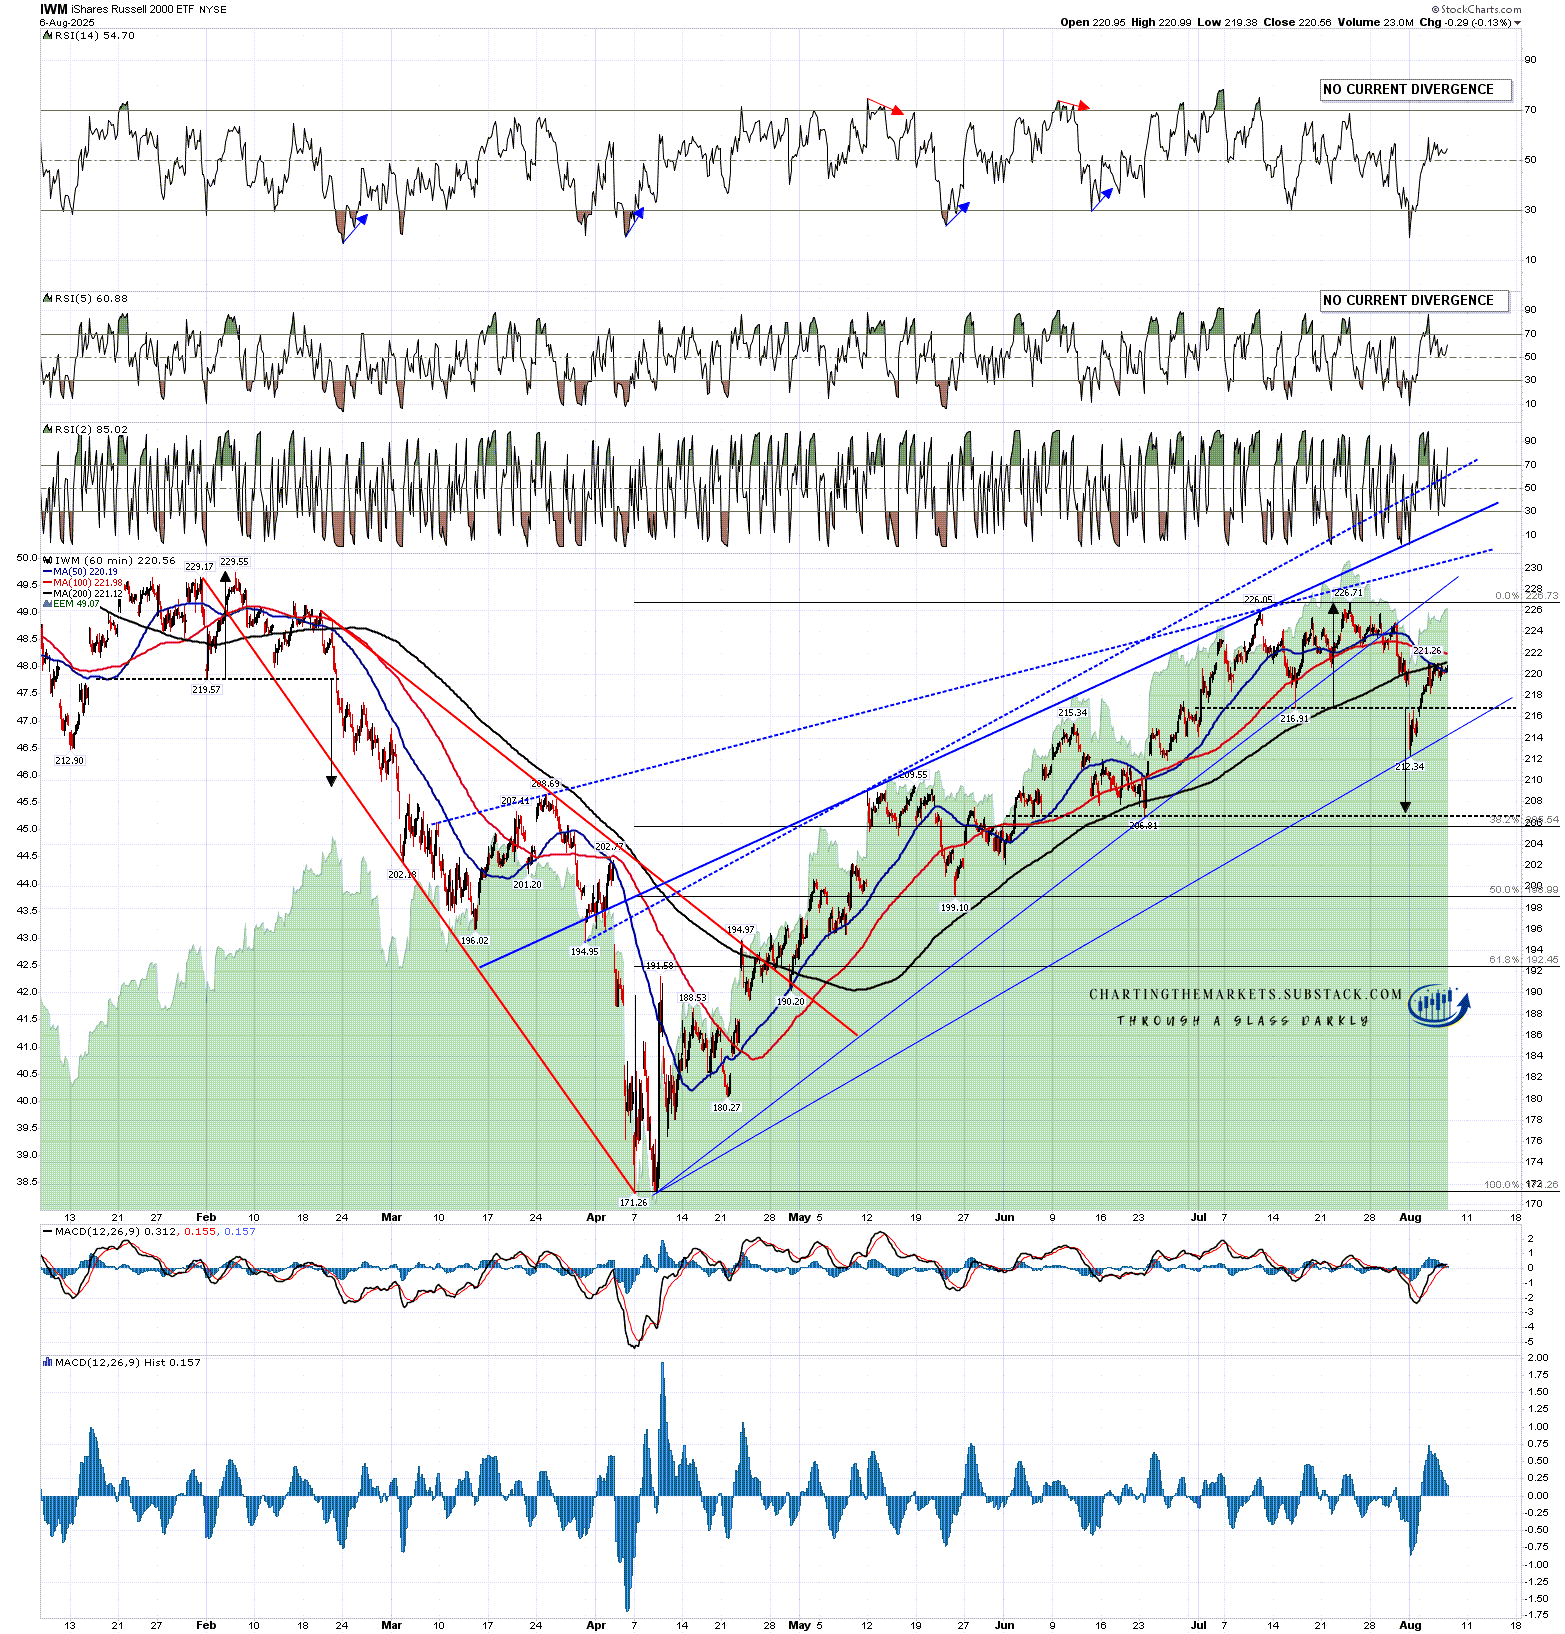
IWM is the exception here as there is no three touch resistance trendline established, though I have drawn in two possible higher probability options for that in dotted lines on the chart below. There is a third option of course which would be a retest and fail at the current (solid) resistance trendline.
There target area options on IWM are therefore less clear but a retest of the July high would be at 226.71 and would set up a decent looking double top. The all time high made in November last year is at 243.04 and isn’t an obvious target yet.
IWM 60min chart:
So what’s the takeaway for today?
The H&S scenarios on SPX and QQQ could still play out but that would really require a hard rejection below their daily middle bands today. In the absence of that we will likely see all time high retests on both soon. If seen both could go higher, but there is high quality trendline resistance not far above on both that I would expect to see hold, though those might get overthrown bearishly as a high formed there.
There are two last points to mention here. The first is that one thing I see a lot at significant highs (and inversely at lows) is a first hard break below support, then a high retest, and then a harder fail. If you’ve been reading my work for years then this is what I call the low before the high. We may well be seeing that here and the three strong resistance trendlines above support that. There is nothing inherently bullish about a high retest, as every double top requires one.
The other point to mention is this. The weakest three month period of the year is August through October and that is the reason that so many significant lows over many years happen in or close to October. We are due at least a significant retracement on equity indices soon and this is the obvious period to see that. I’ll be watching for that carefully.
A few weeks ago I posted some bigger picture trendline targets that I thought could be reached this year on SPX and NDX. These aren’t in imminent danger of being reached but have definitely go a lot closer since then. I’ll be looking at both of those in my next post.
If you like my analysis and would like to see more, please take a free subscription at my chartingthemarkets substack, where I publish these posts first. I also do a premarket video every day on equity indices, bonds, currencies, energies, precious commodities and other commodities at 8.45am EST, but only for paying subscribers. Other places to find me are my twitter, and my Youtube channel.
No comments:
Post a Comment