
NOTE: The charts below are all showing the new monthly pivots.
In my post on Wednesday morning I was looking at the pattern setups on SPX, QQQ and DIA and saying that these delivered a very nice setup for at least a short time high forming here. Yesterday we saw the first real signs of weakness since the early April low.
I’ve looked in many previous posts at the importance of daily middle band support or resistance in strong trends and I looked at that in this uptrend a few weeks ago. Until yesterday there had been no meaningful closing breaks of the daily middle band support on SPX, QQQ, DIA or IWM since these indices broke back above those in late April. That changed with very strong closing breaks below the daily middle bands on DIA and IWM yesterday.
On DIA there was a slight break below the daily middle band at the close on Wednesday and a strong break below yesterday with a close on the daily lower band. An RSI 14 sell signal has fixed and I’m expecting that to make target over coming days and weeks.
DIA daily chart:
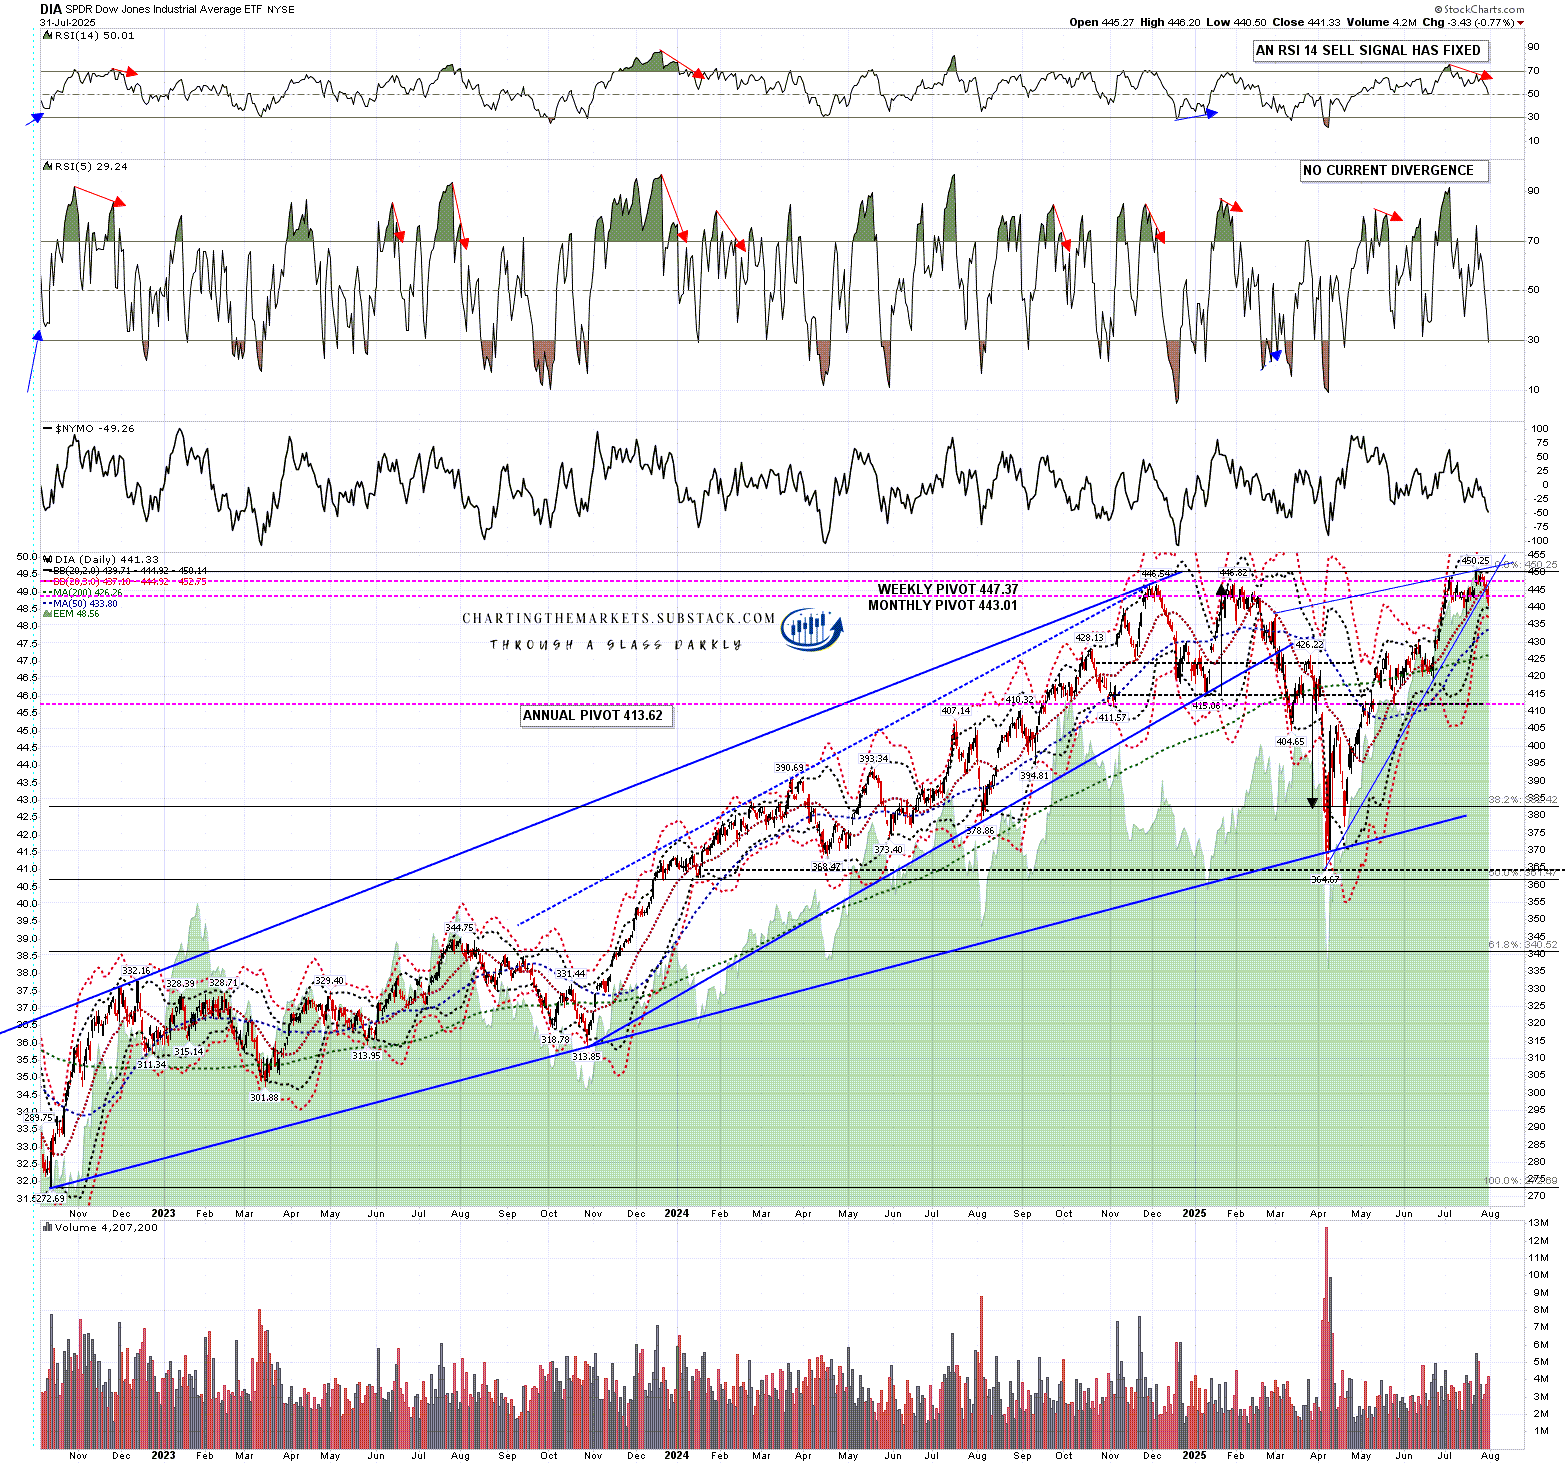
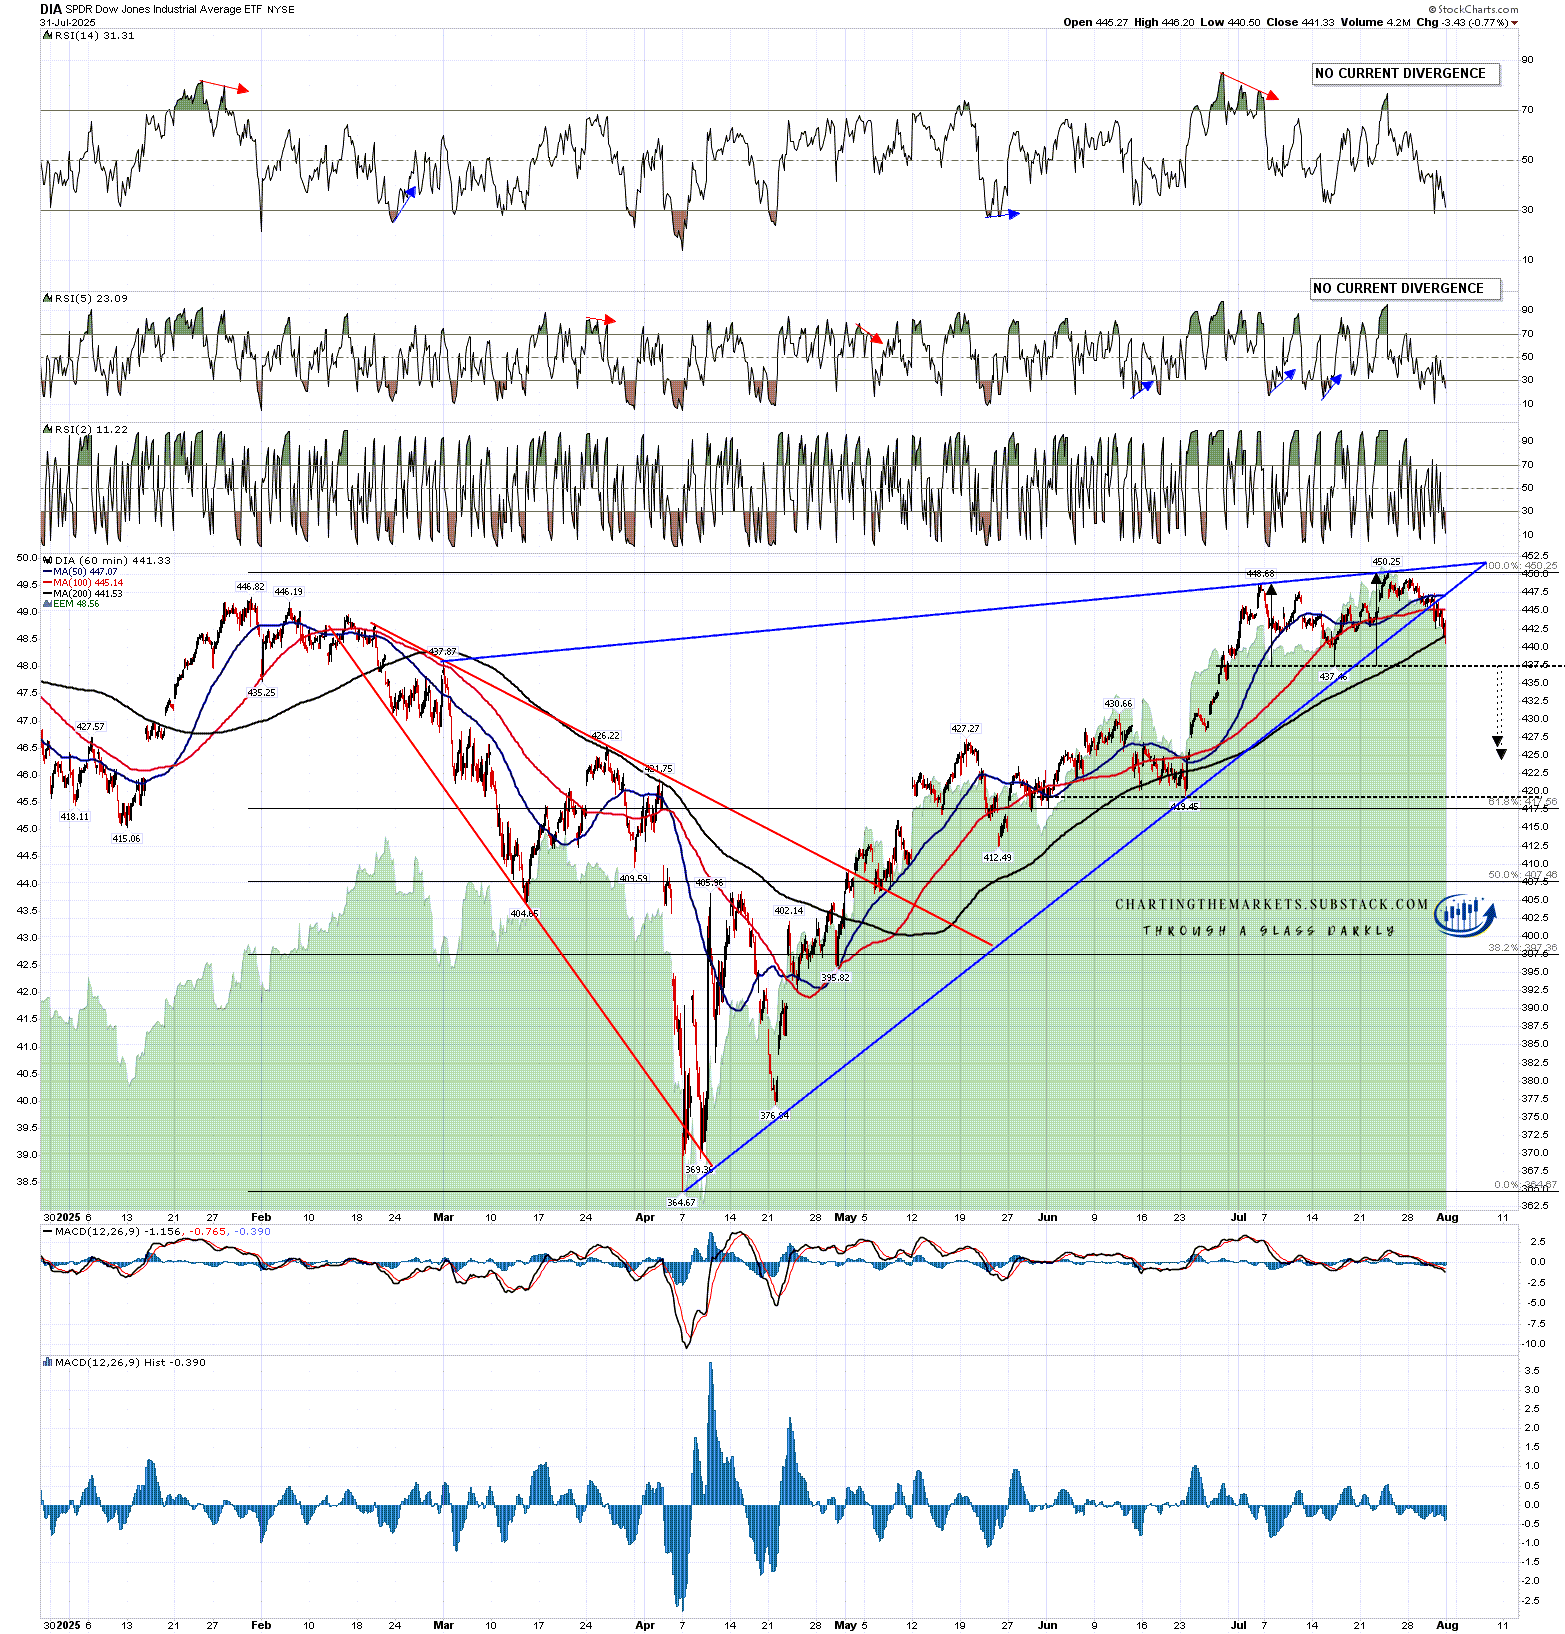
There is a high quality double top already formed on DIA and subject to the employment numbers this morning delivering a substantial rally before the RTH open it currently looks as though this double top will likely break down towards a 425 - 426.5 target range at the open. A possible bigger picture target would be the possible H&S neckline in the 419.45 area.
DIA 60min chart:
On IWM there was a slight break below the daily middle band at the close on Wednesday and a strong break below yesterday with a close on the daily lower band. The daily RSI 5 sell signal reached target yesterday and there is also a weak RSI 14 sell signal fixed and I’m expecting that to make target over coming days and weeks.
IWM daily chart:
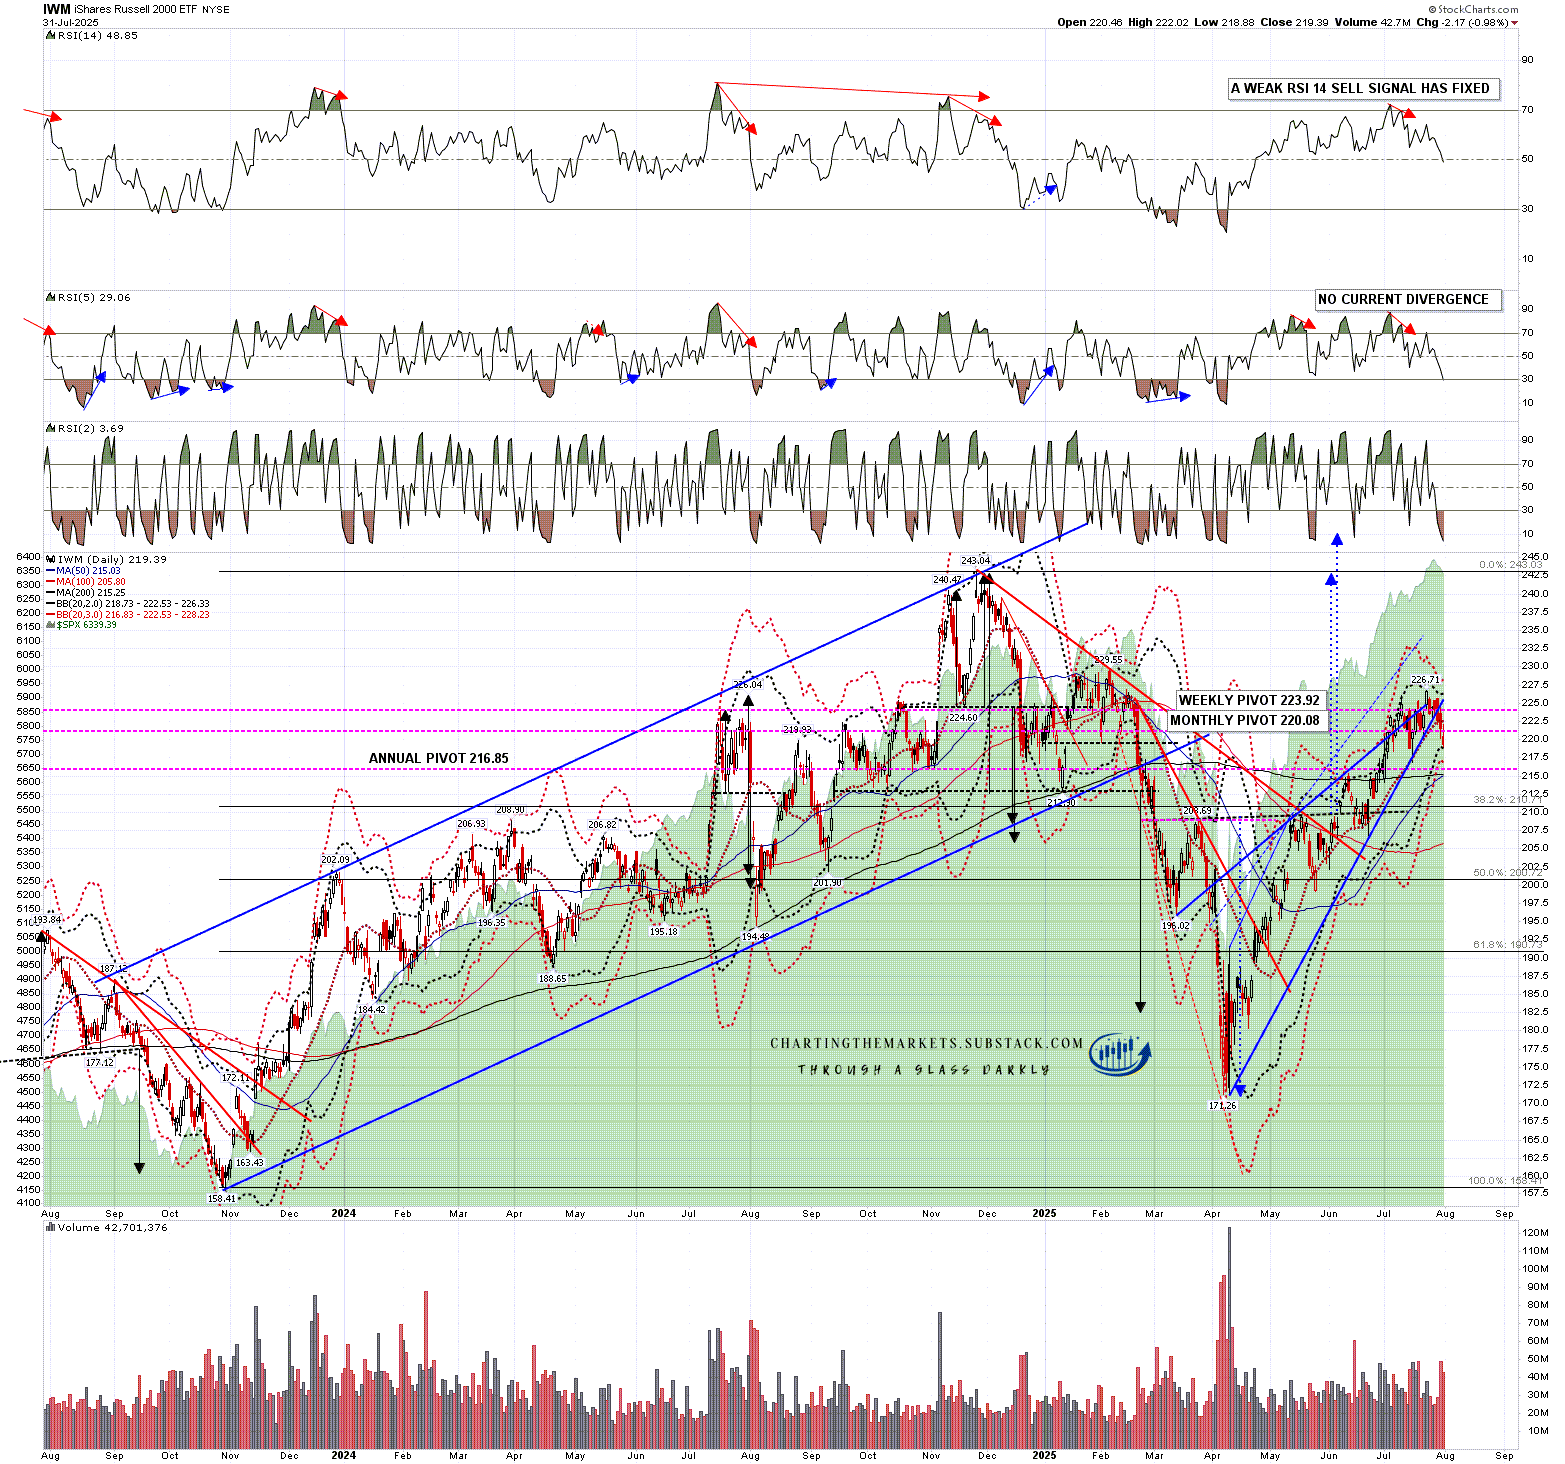
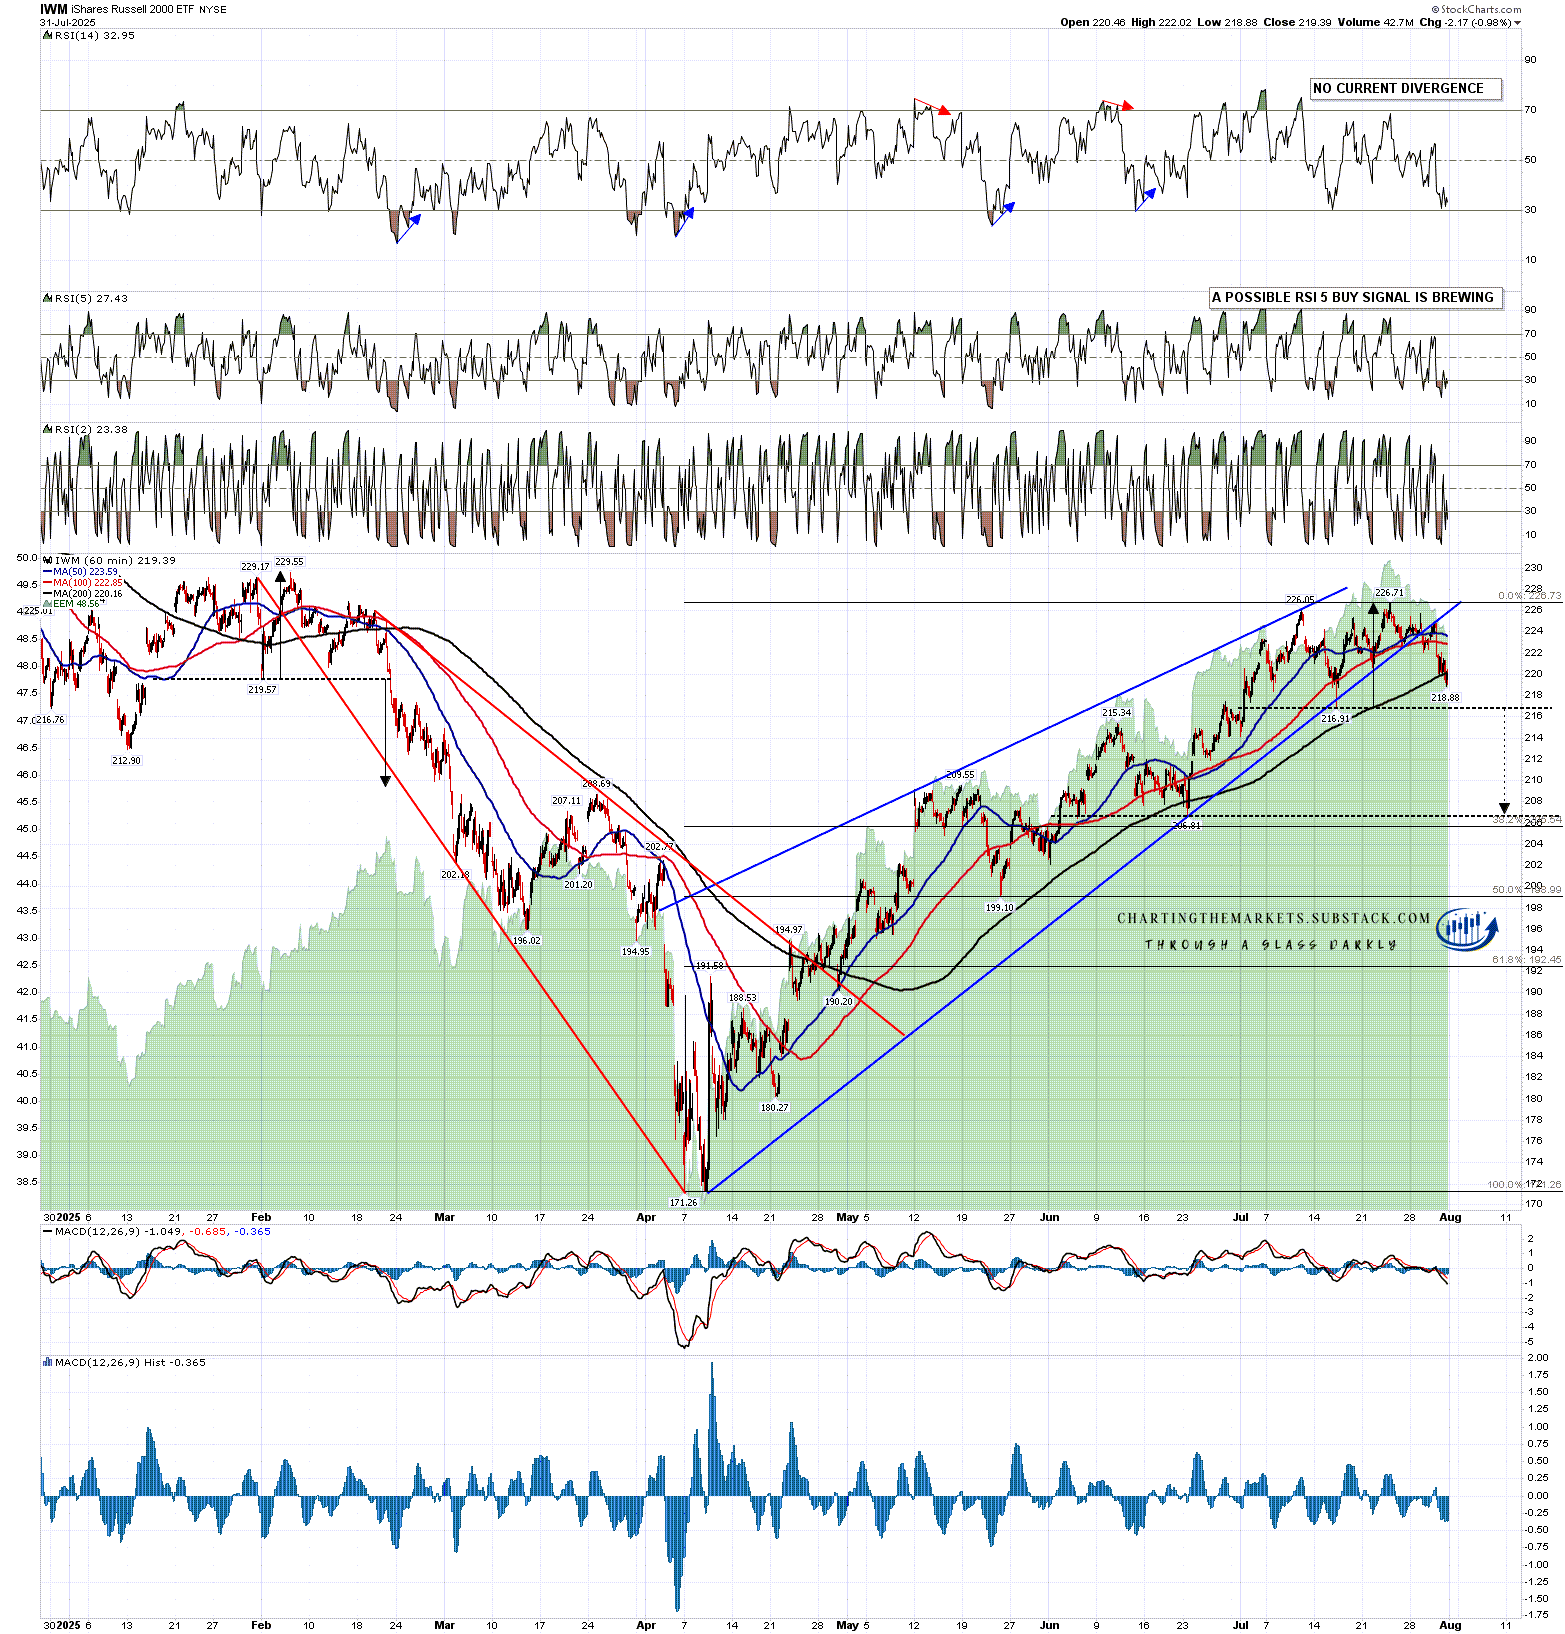
There is a high quality double top already formed on IWM and subject to the employment numbers this morning delivering a substantial rally before the RTH open it currently looks as though this double top will likely break down at the open towards a 207-8 target range. That is a close match with the possible bigger picture target at the possible H&S neckline in the 206.81 area.
IWM 60min chart:
SPX and QQQ have been leading this uptrend and neither of those has delivered a daily middle band test yet. For this to be a retracement of any significant size, those daily middle bands will need to be broken and converted into resistance.
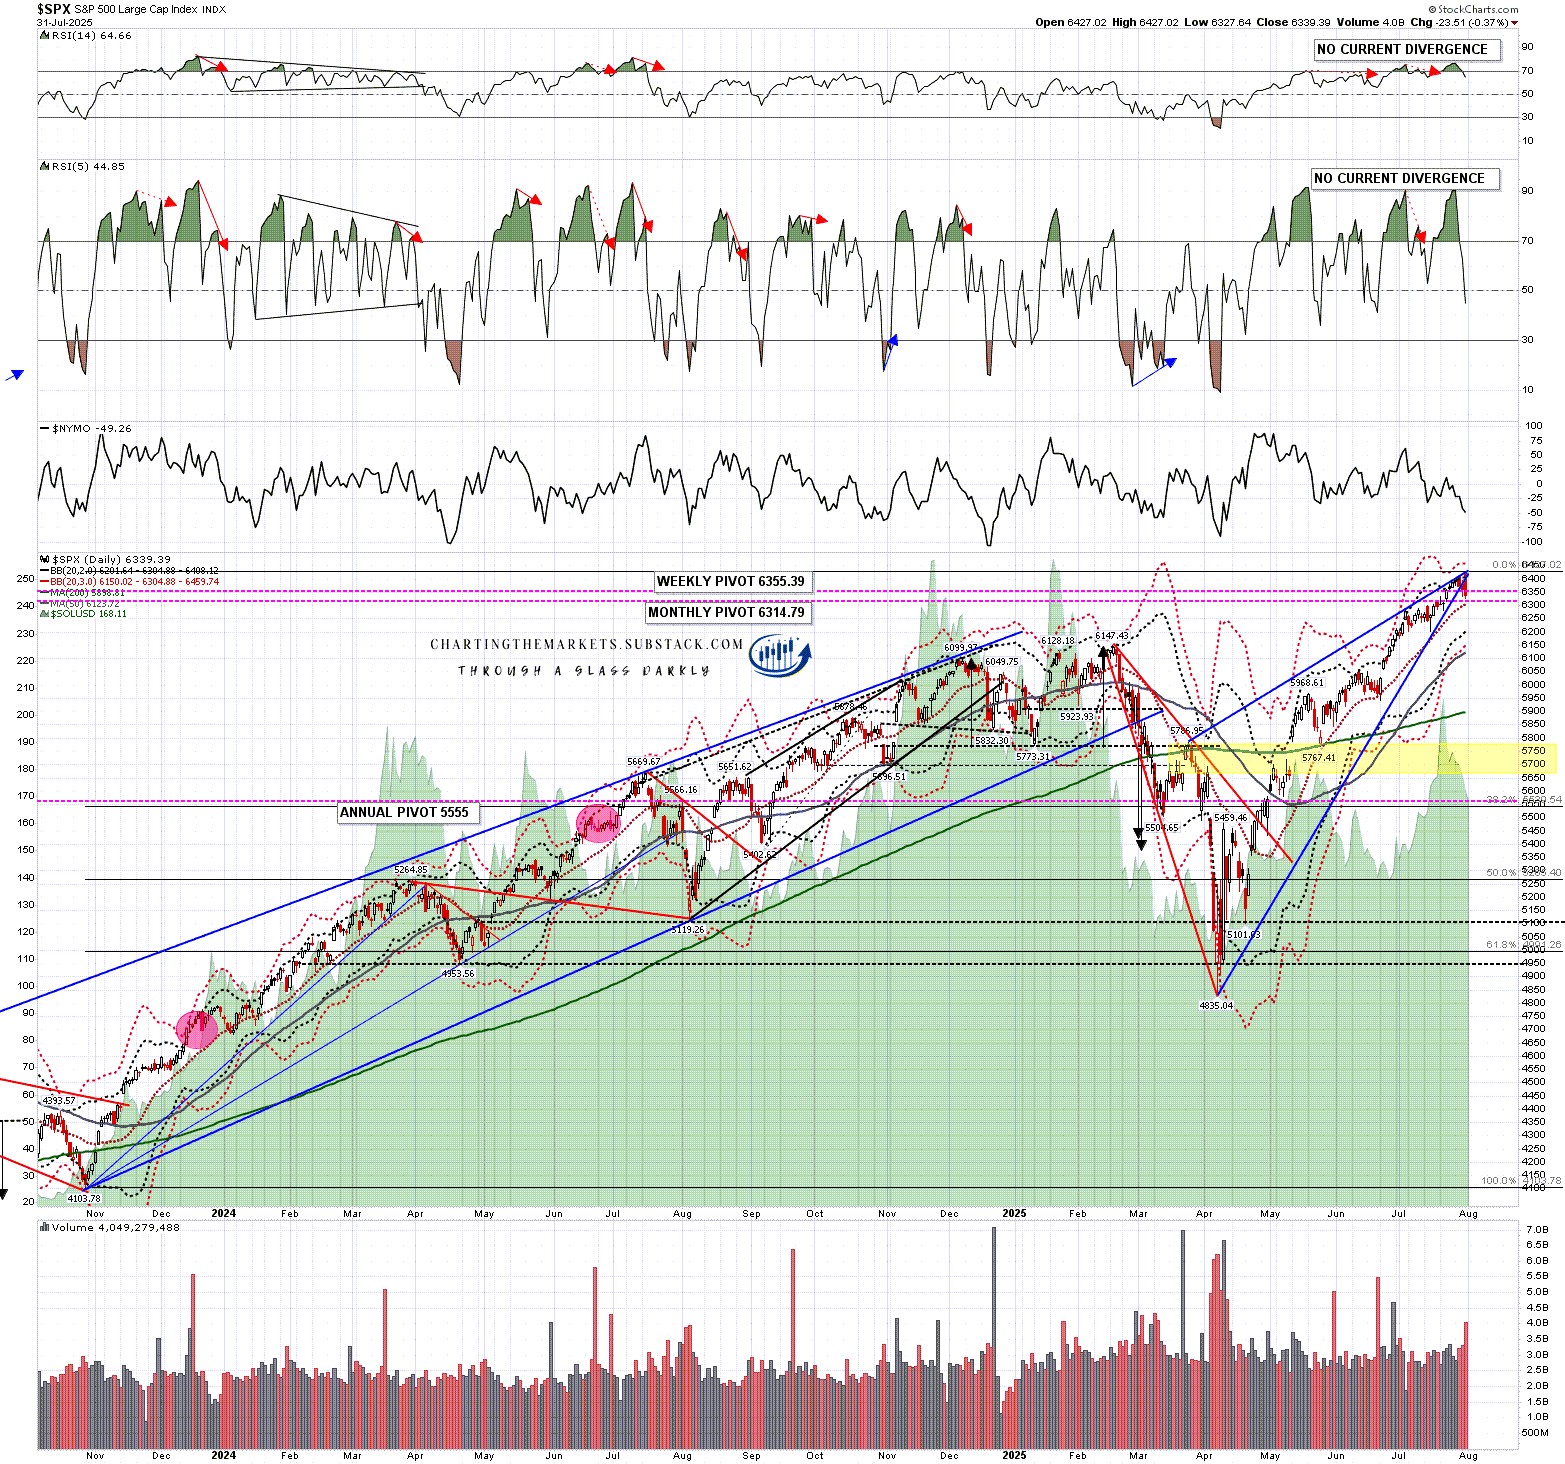
SPX support is at the new monthly pivot at 6314.79 and the daily middle band, currently at 6305. There is no topping pattern of any real size developed yet on SPX but a very small double top setup broke down yesterday with a target area at 6247-65. I’m watching the possible H&S necklines in the 6282 and 6202 areas.
We saw the high retest yesterday that I was looking for in my post on Wednesday but SPX then failed hard and SPX closed lower on the day. That means that while there was theoretical negative RSI 14 divergence on that high, there was no actual second lower high on the RSI 14. In the absence of a further high retest there is therefore no daily sell signal brewing or fixed on SPX
SPX daily chart:
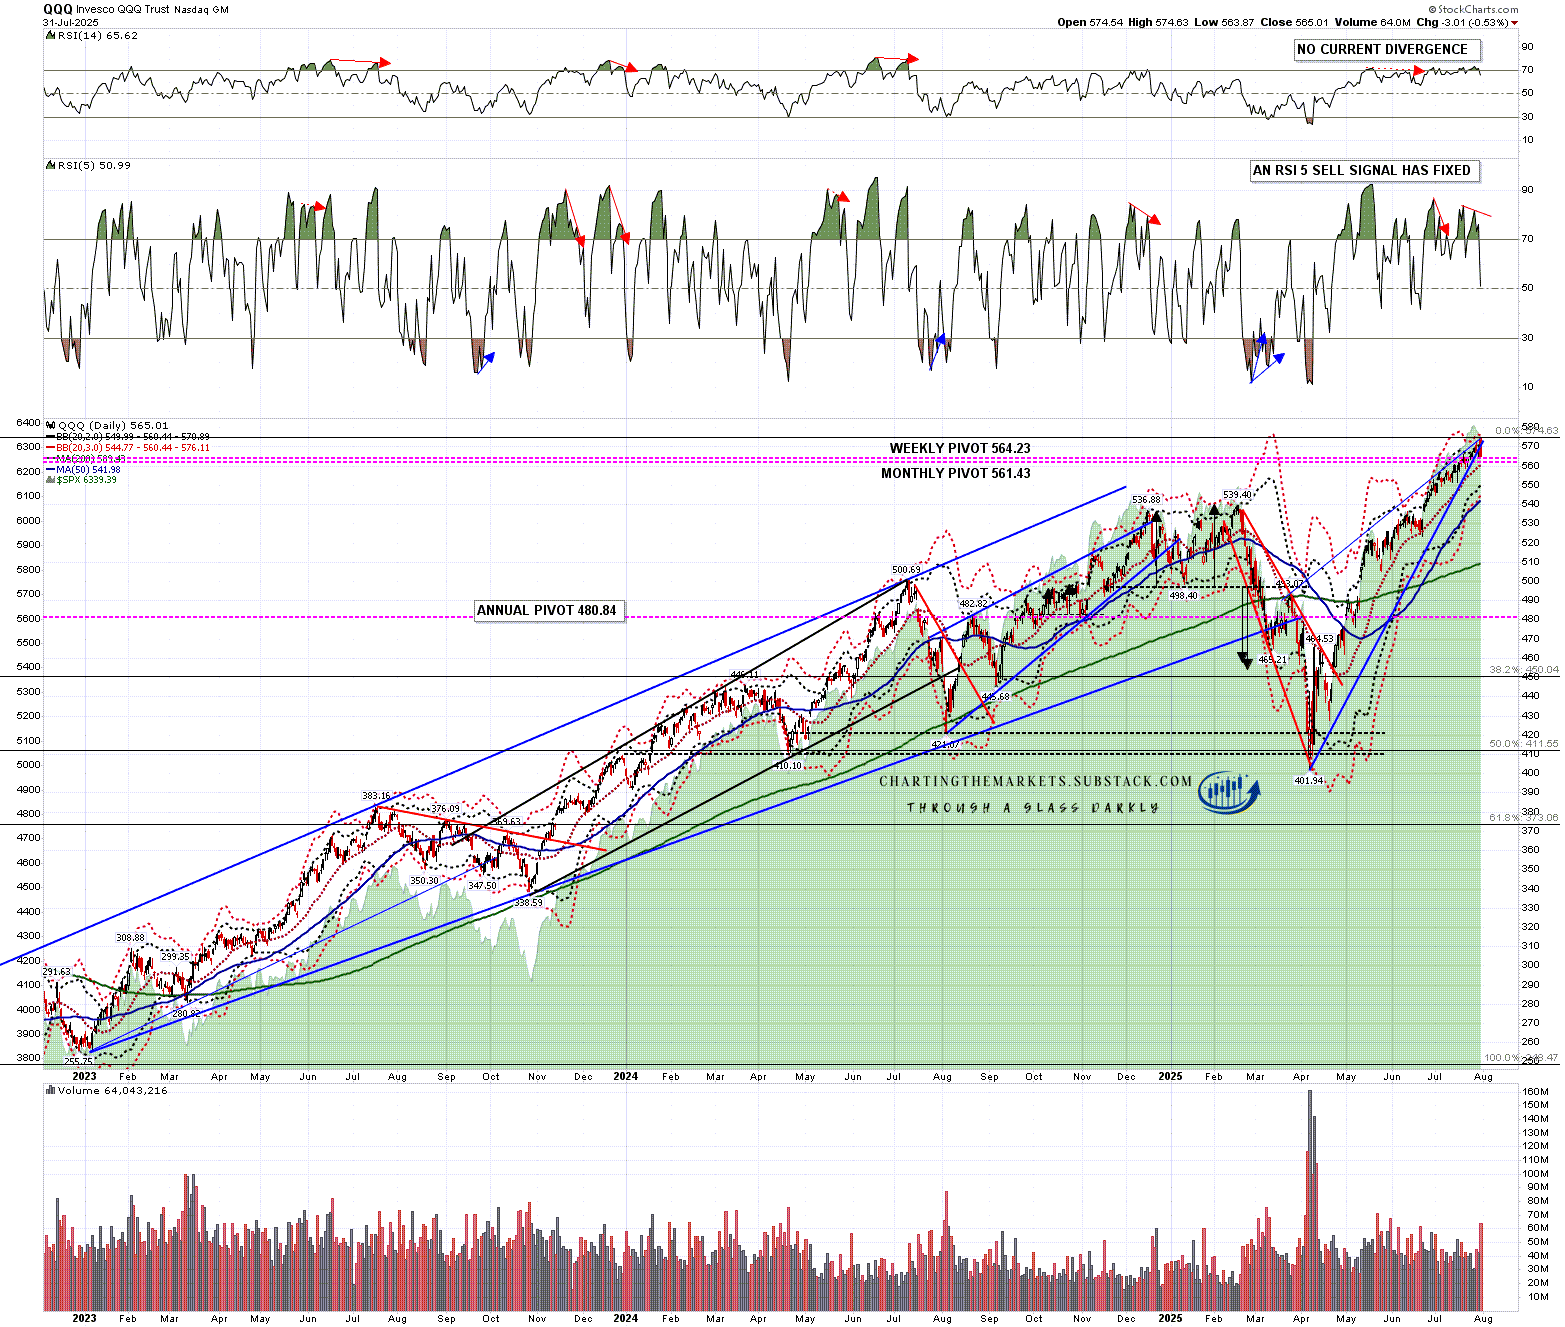
On QQQ support is at the new monthly pivot at 561.43 and the daily middle band, currently at 560.55. There is no topping pattern developed yet on QQQ, but I’ll be watching the possible H&S necklines in the 558.61 and 551.56 areas.
On QQQ a daily RSI 5 sell signal has fixed and I’m expecting that to make target in the coming days and weeks before this retracement ends.
QQQ daily chart:
I think equity indices are in the early stages of a significant retracement here that will ideally retrace around 50% of the move up from the April lows before at least retesting the current highs.
I’m not looking for a more serious high to form yet and was very encouraged by the strong GDP number on Wednesday which is helping my preferred scenario that equities don’t make a bigger high before the end of the year.
Everyone have a great weekend. :-)
If you like my analysis and would like to see more, please take a free subscription at my chartingthemarkets substack, where I publish these posts first. I also do a premarket video every day on equity indices, bonds, currencies, energies, precious commodities and other commodities at 8.45am EST, but only for paying subscribers. Other places to find me are my twitter, and my Youtube channel.
No comments:
Post a Comment