
In my post on the morning of Wednesday 30th July I was looking at the pattern setups on SPX, QQQ and DIA and saying that these delivered a very nice setup for at least a short time high forming there.
In my post on the morning of Friday 1st August I was looking at the first real signs of weakness on the US equity indices since the April low after the strong breaks of the daily middle bands on DIA and IWM on Thursday, and saying that confirmation was needed with further breaks of the daily middle bands on SPX and QQQ.
In my post on Sunday 3rd August I was looking at the strong breaks of the daily middle bands on SPX and QQQ on Friday and the closes well below the 3sd daily lower bands on DIA and IWM. I proposed a rally early this week to backtest the daily middle bands on SPX and QQQ while setting up high quality H&S right shoulders on both.
So here we are at another significant short term inflection point. The rally yesterday formed those right shoulders and delivered slight closing breaks back over the daily middle bands on SPX and QQQ. If those H&S patterns on SPX and QQQ are going to continue to form and break down then what we should see here is a hard break back down back below the daily middle bands on SPX and QQQ ideally today or, after a consolidation day today, tomorrow.
If on the other hand we see a strong further move up today then the next likely target would be retests of the all time highs on SPX and QQQ, very possibly to set up double tops on both.
SPX daily chart:
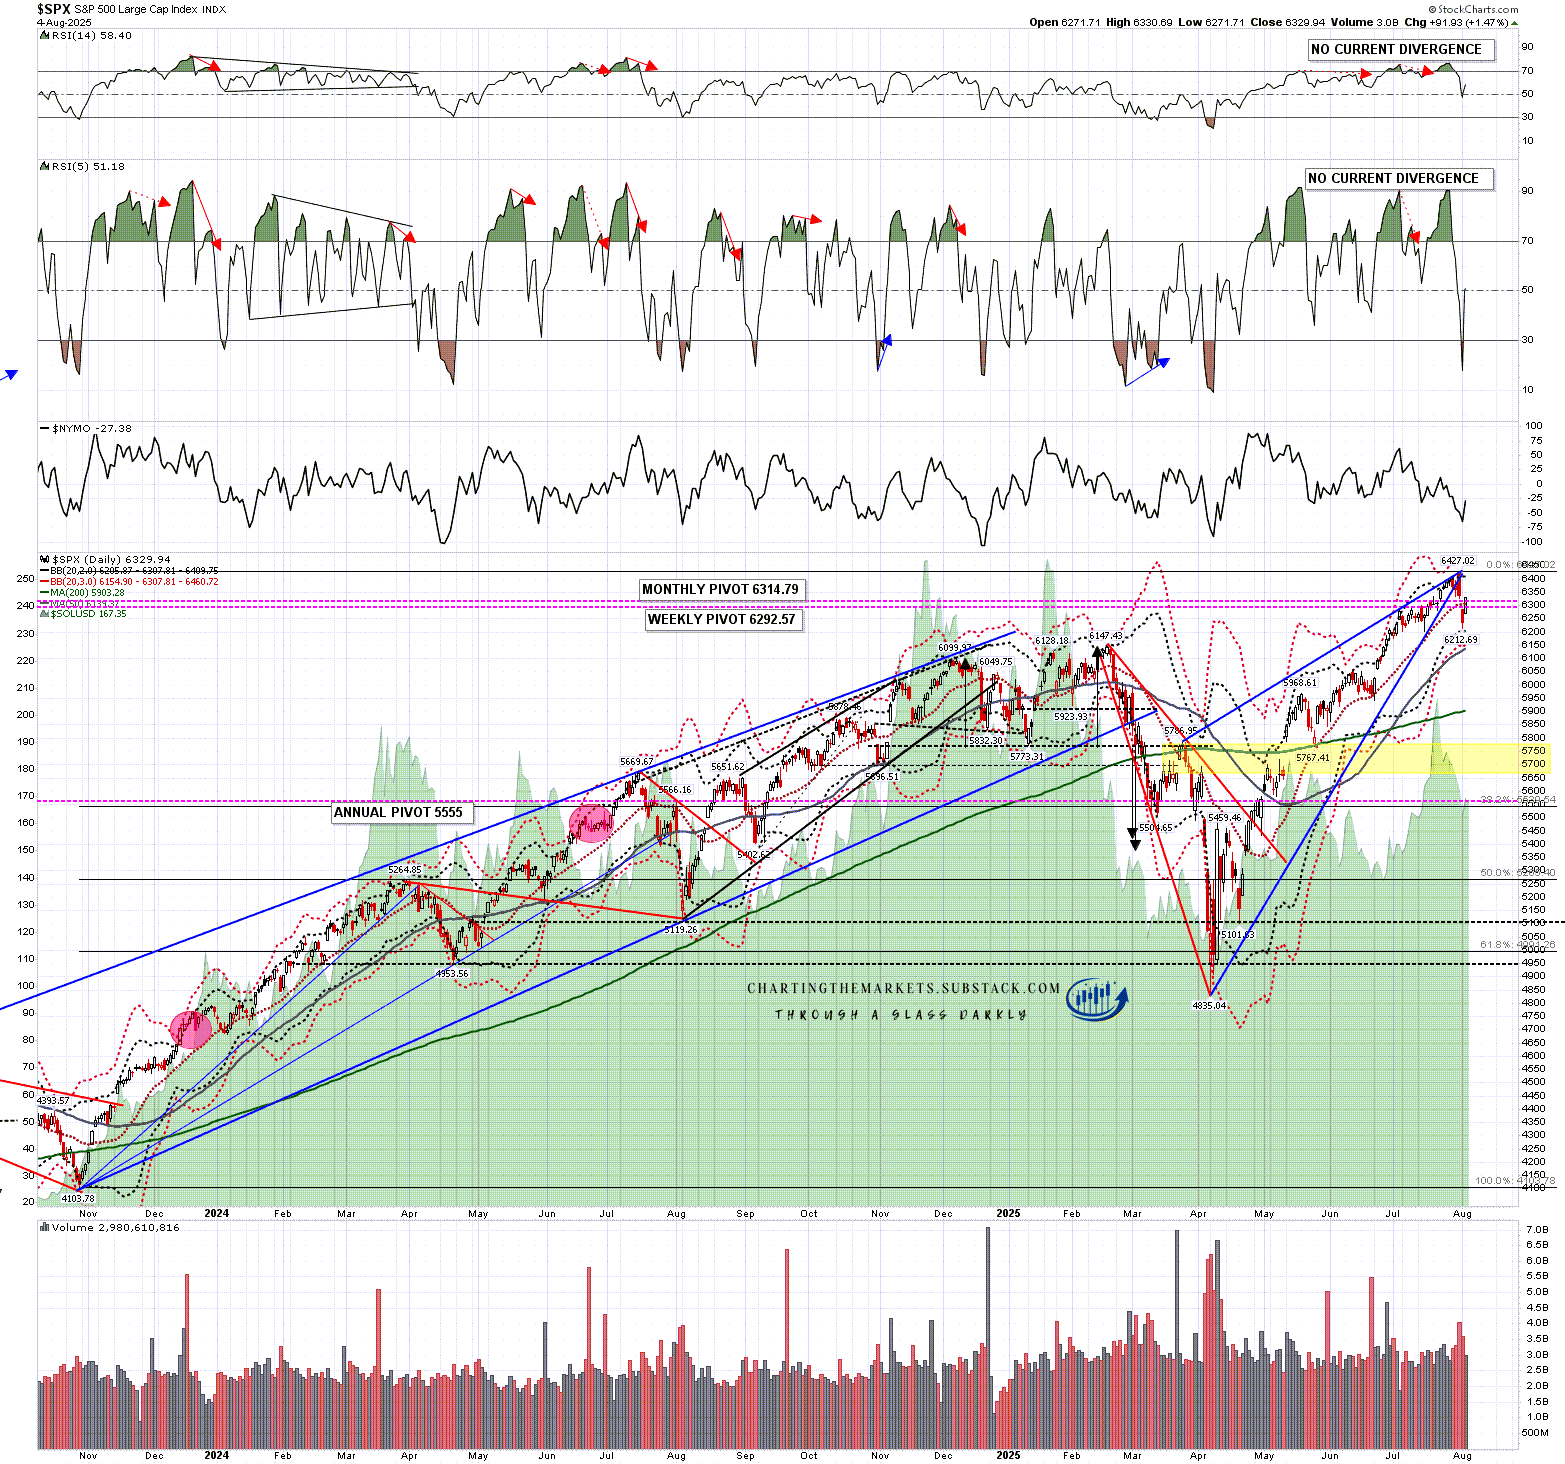
If we do see a hard fail here and the possible H&S on SPX breaks down then the target would be in the in the 5950 area, close to the lower possible H&S neckline that I’ve been showing on this chart.
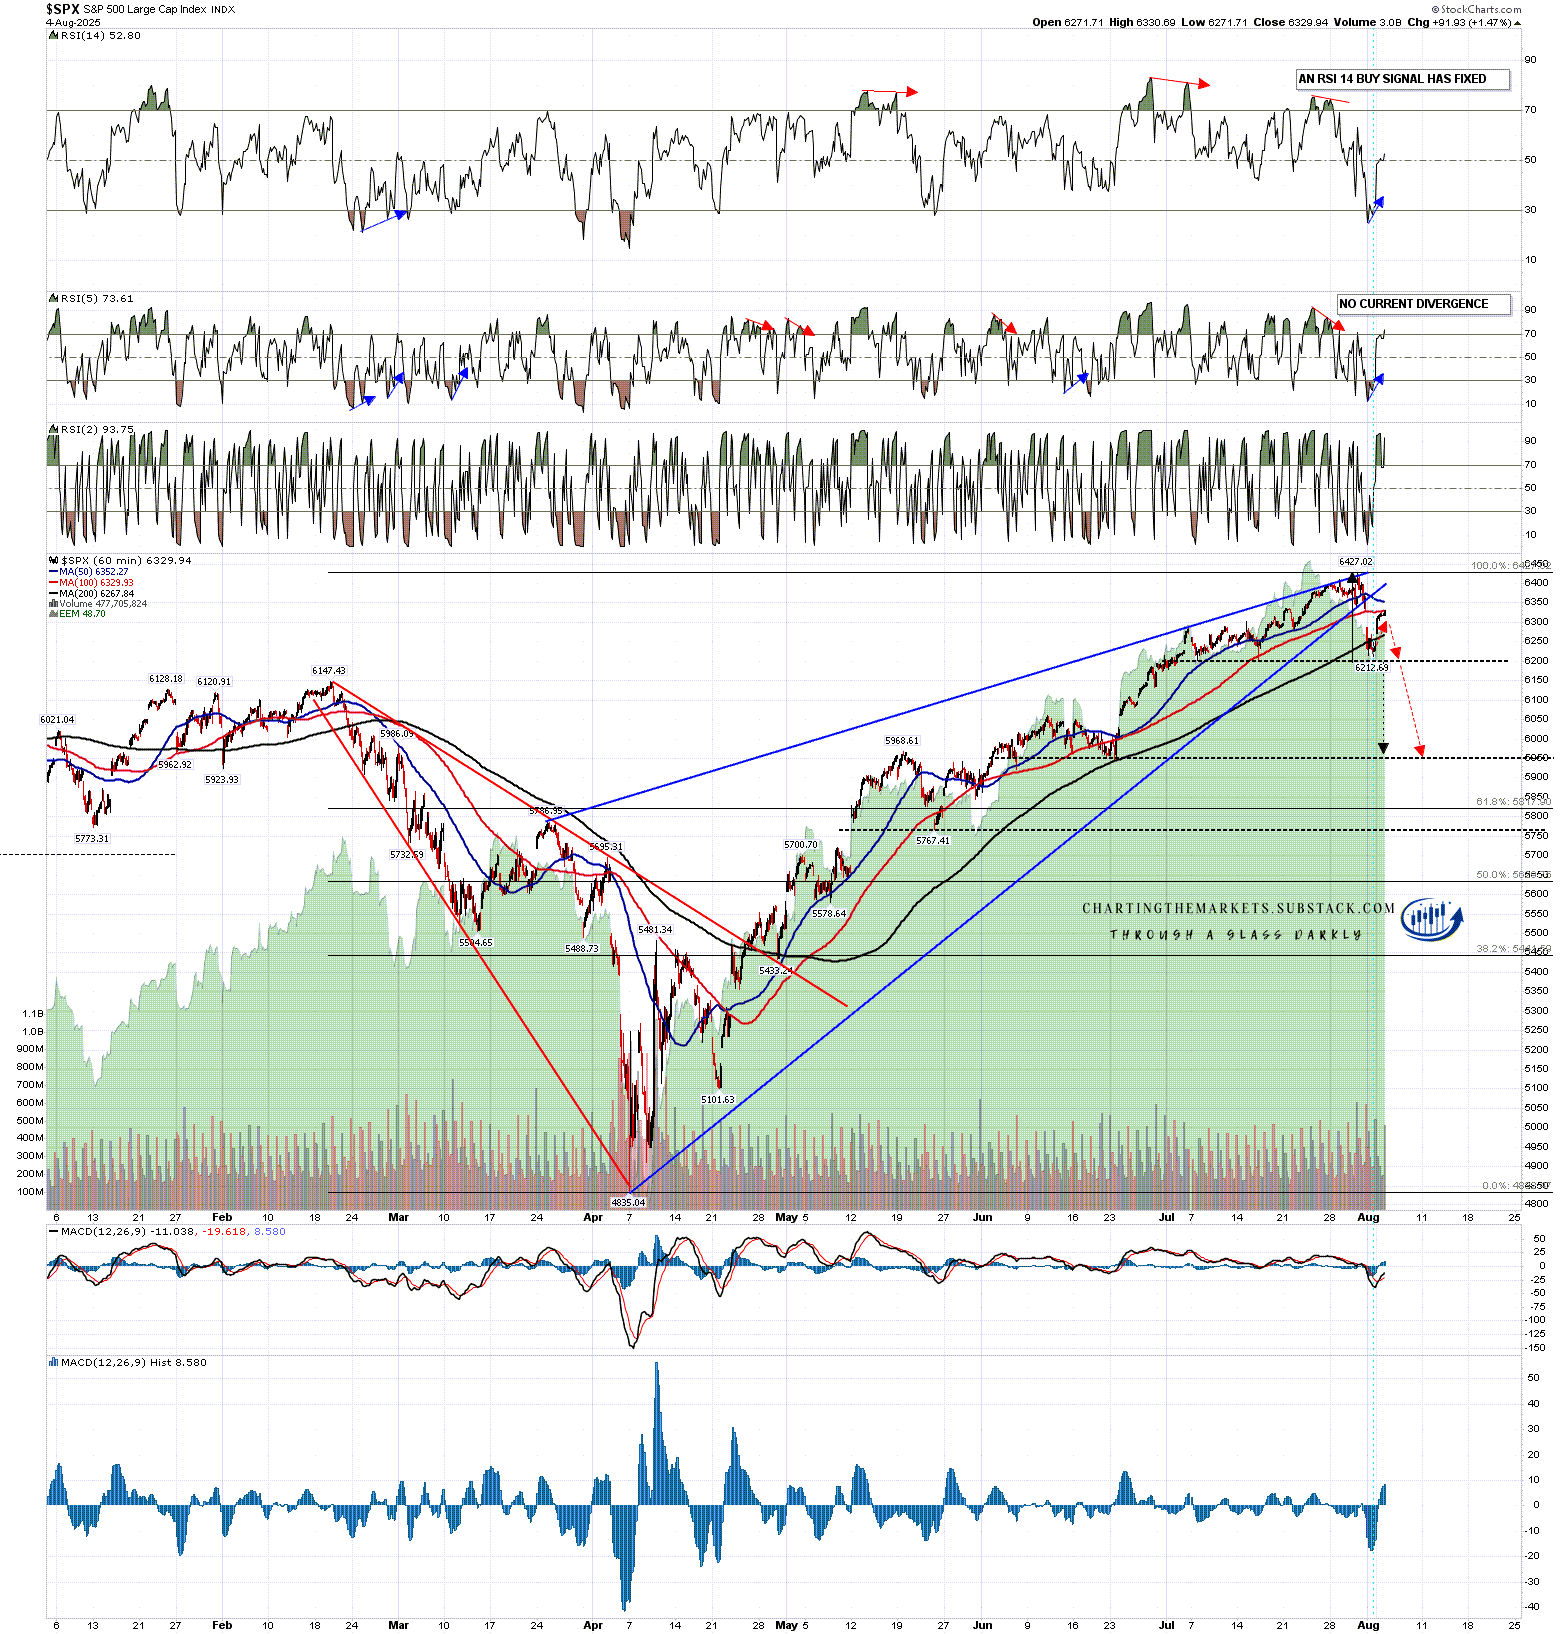
SPX 60min chart:
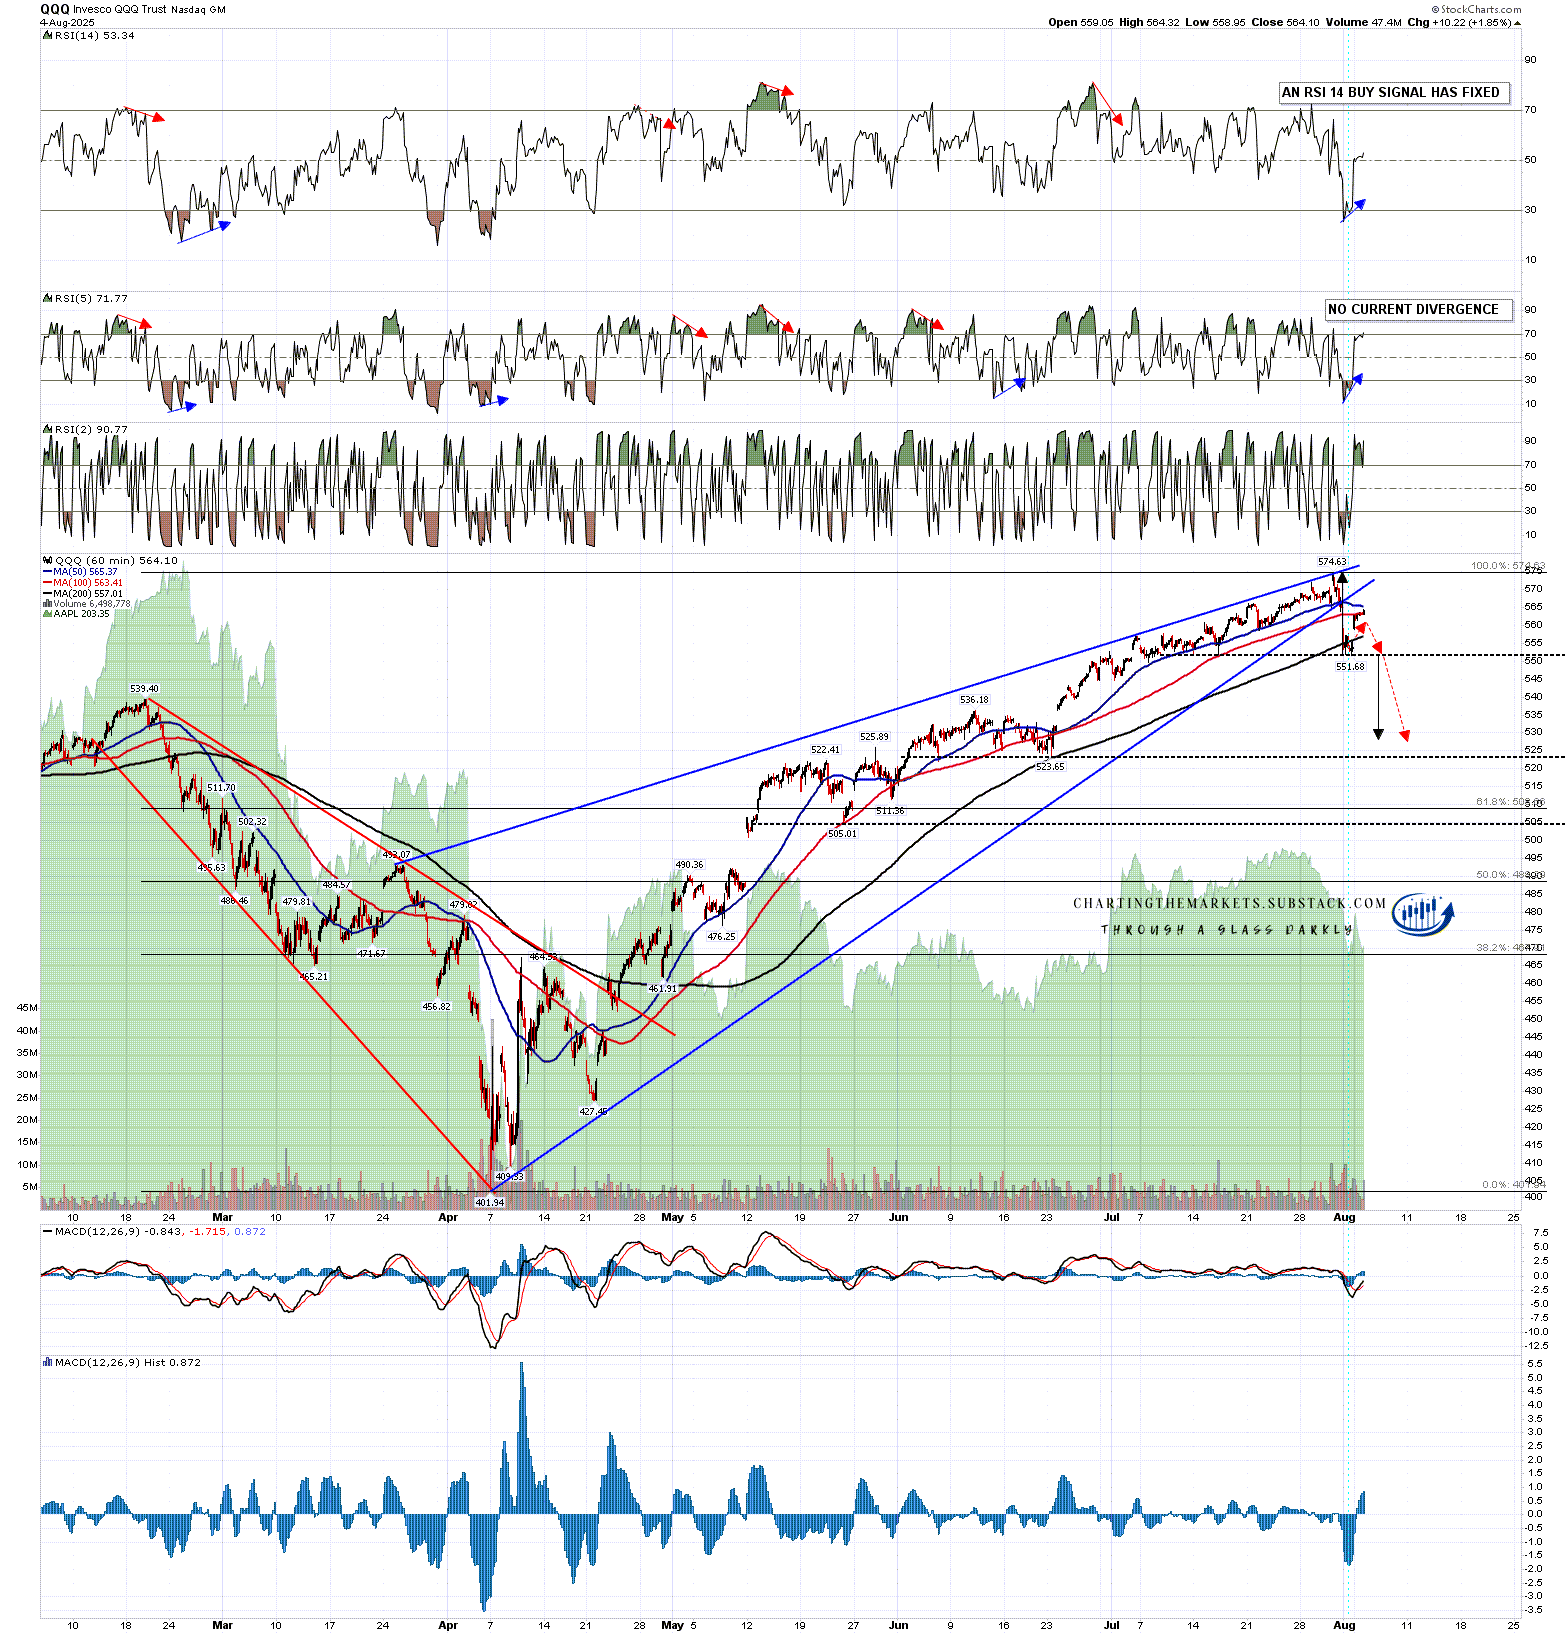
If we do see a hard fail here and the possible H&S on QQQ breaks down then the target would be in the in the 527 area, not far above the lower possible H&S neckline in the 523.65 area that I’ve been showing on this chart.
QQQ 60min chart:
On DIA and IWM double tops have broken down and I still like those. However if SPX and QQQ proceed to retest their all time highs from here then we could see the same on these.
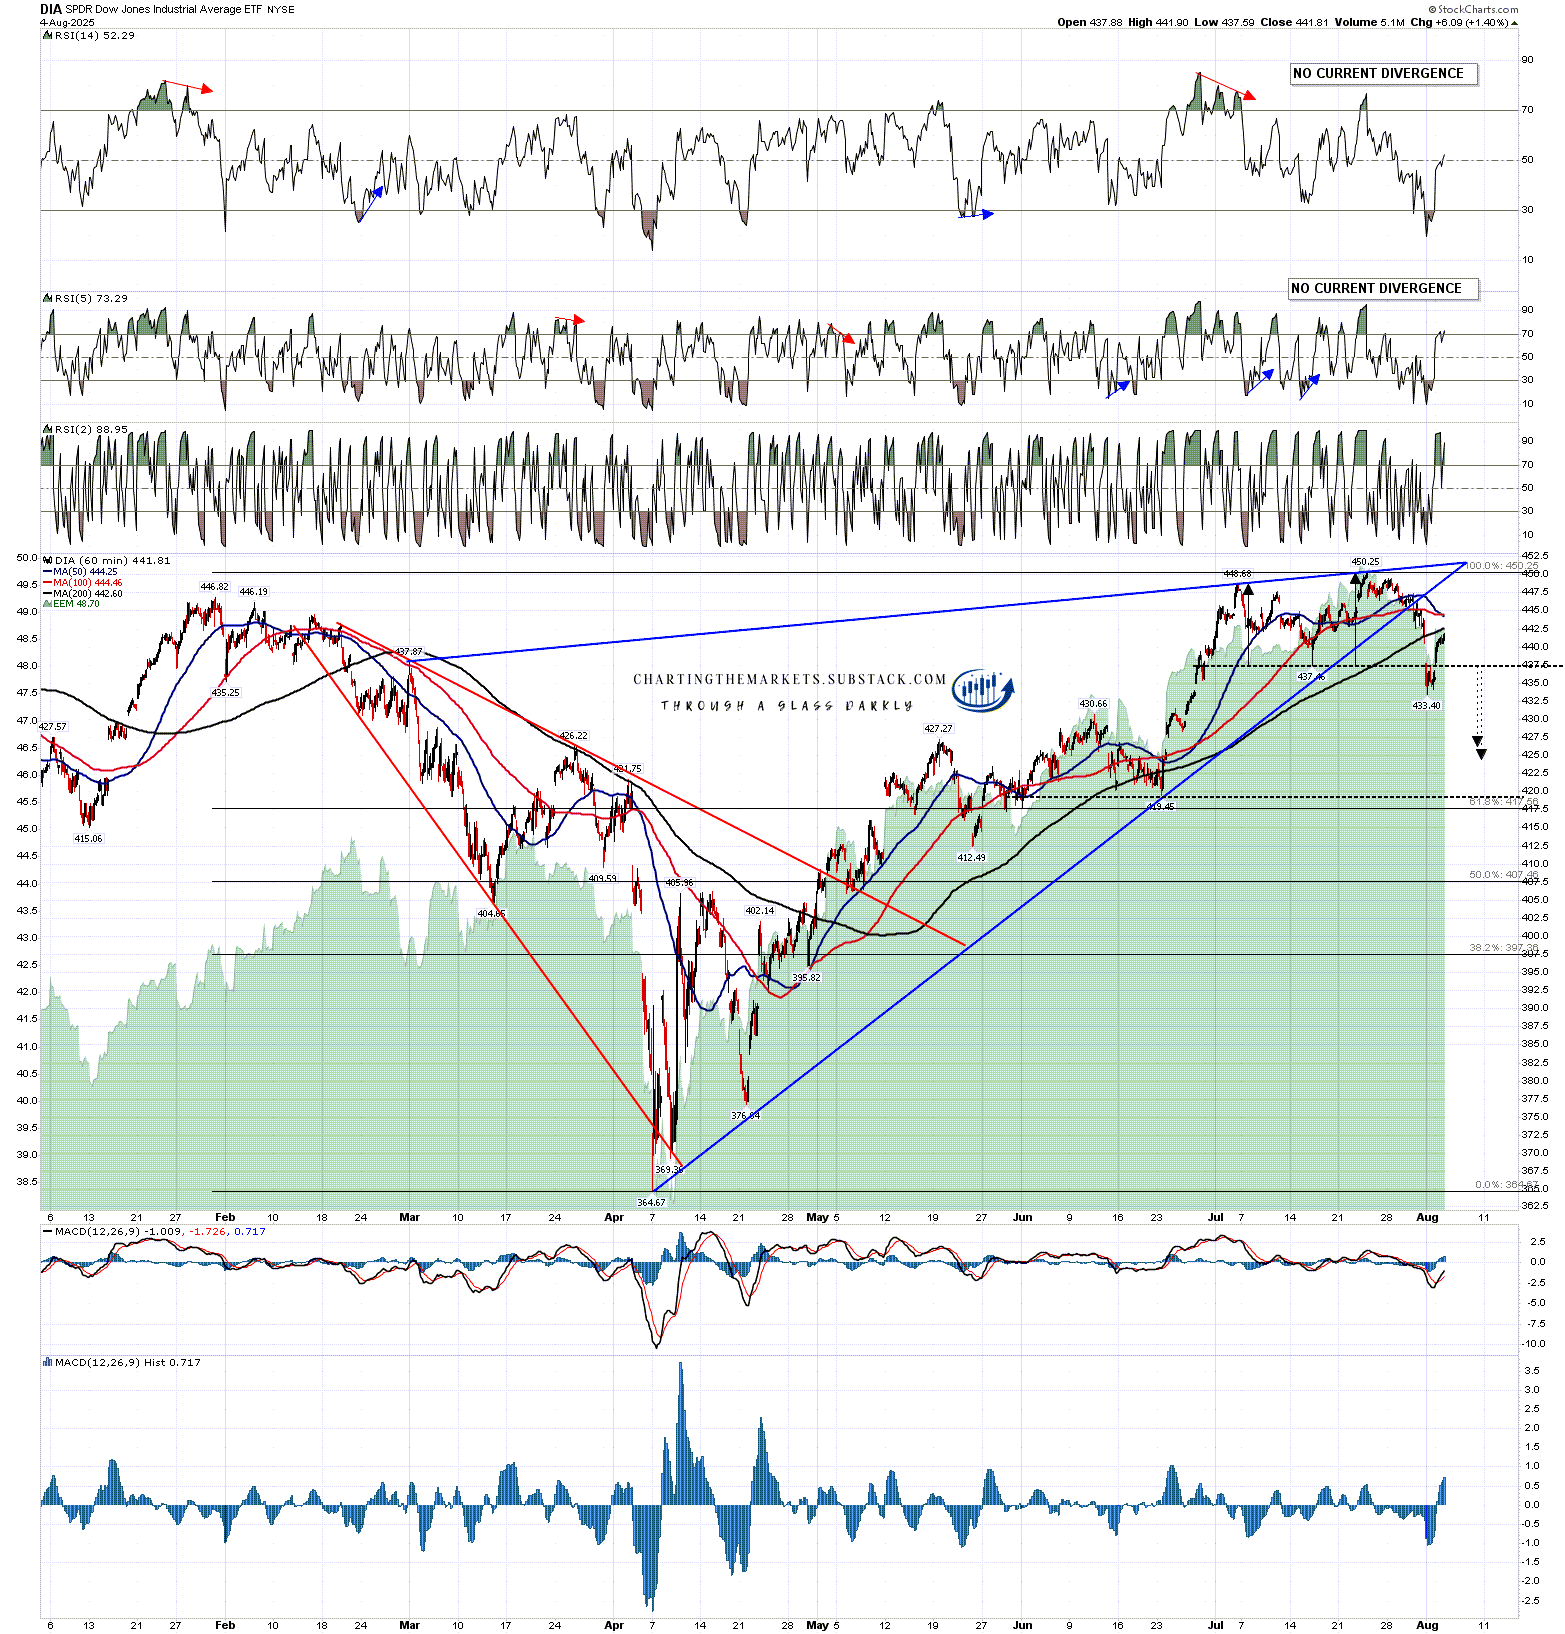
In the short term double tops and H&S patterns often see strong rallies after breaks down before heading to their targets and there is really nothing yet to suggest that this isn’t what is happening here. However there is a key level that I’m watching here which is the double resistance at the 200 hour MA at 442.60 and the 50 hour MA at 444.25. If that double resistance is broken and converted to support then a retest of the all time high at 450.25 would become likely.
DIA 60min chart:
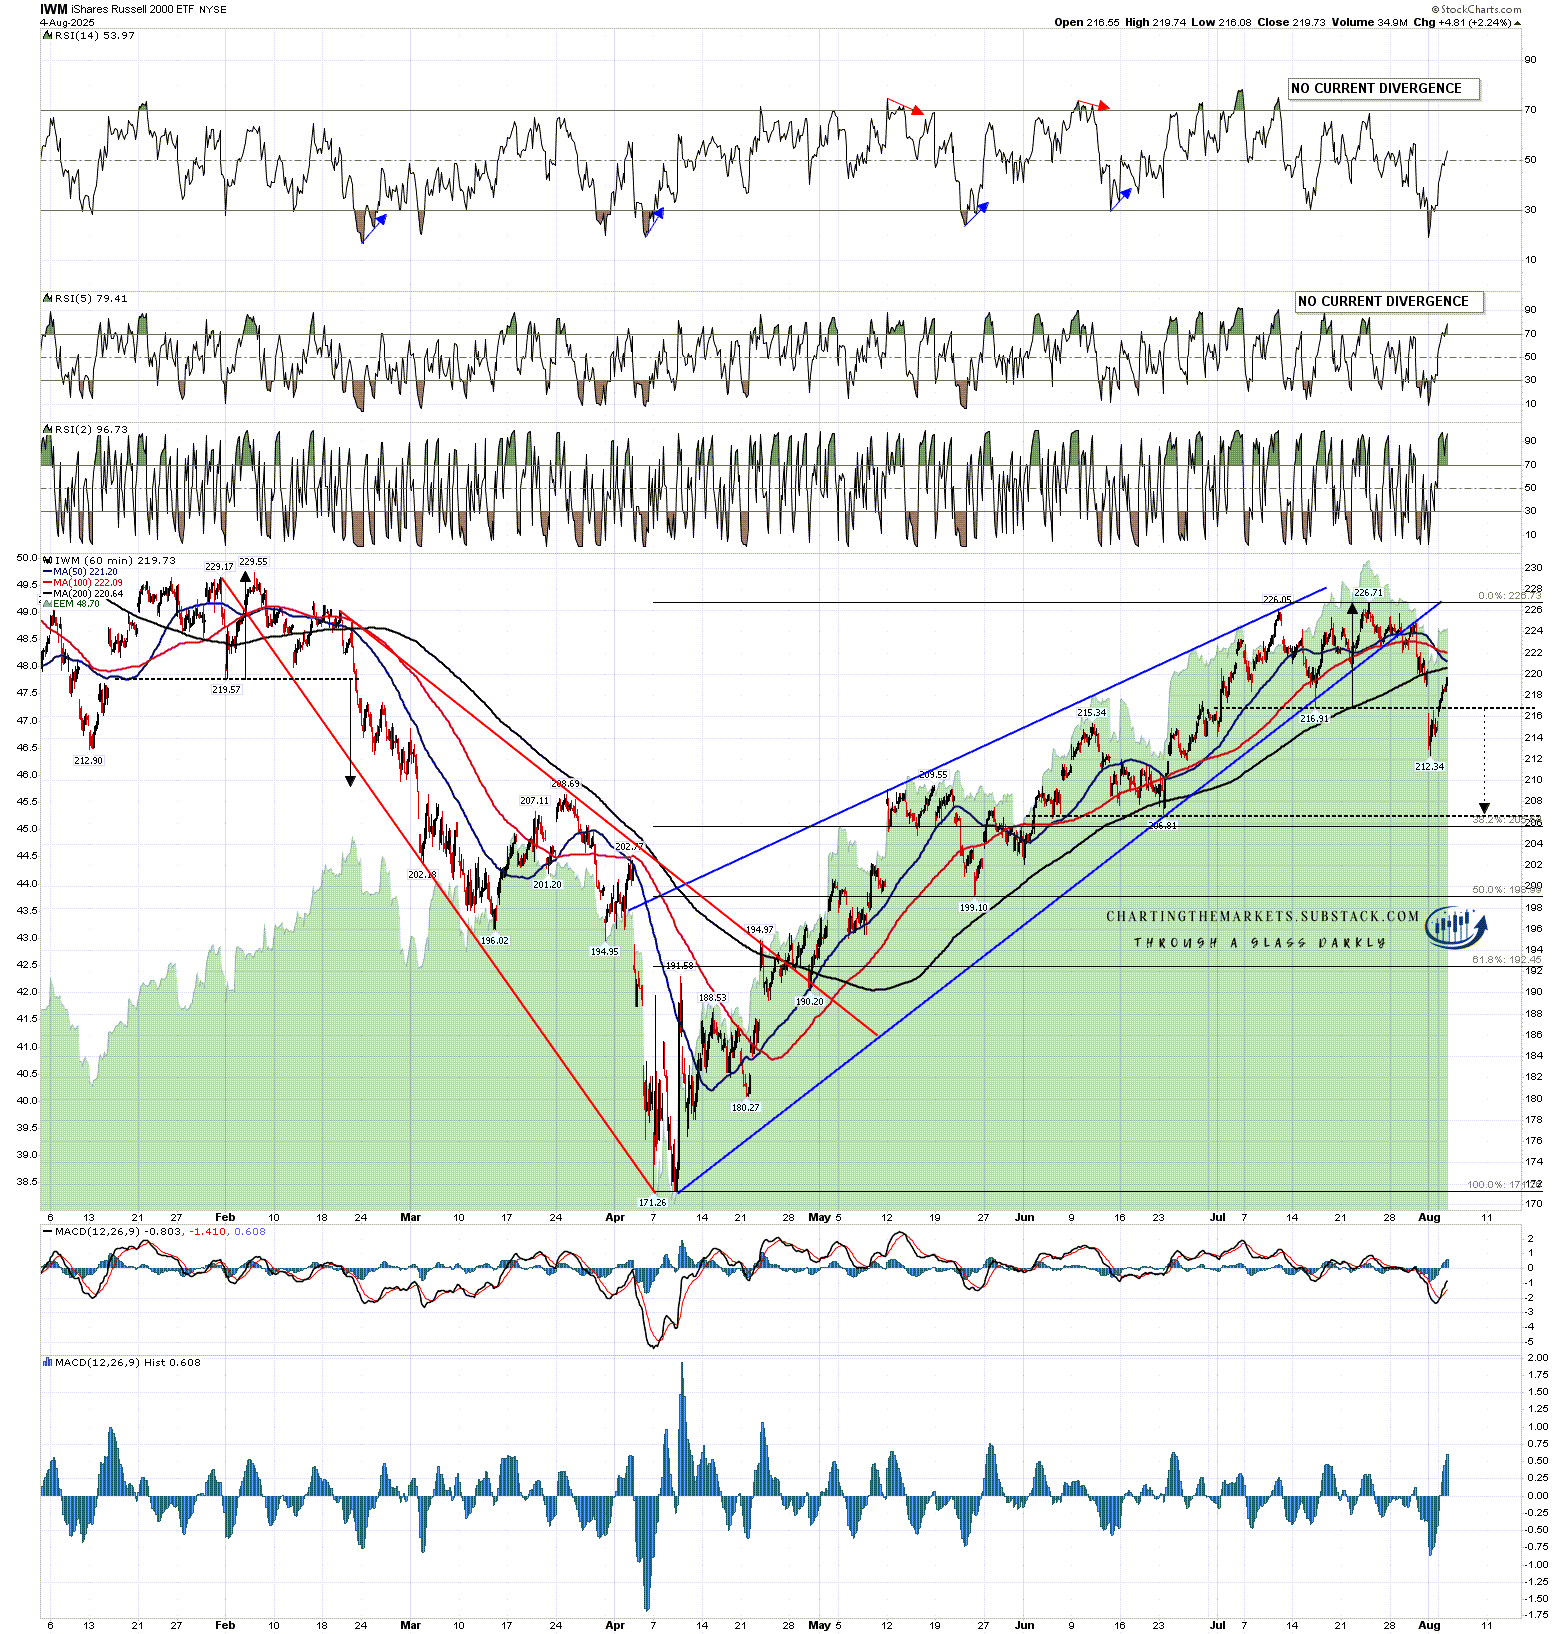
On IWM this that I’m watching here which is the double resistance at the 200 hour MA at 220.64 and the 50 hour MA at 221.20. If that double resistance is broken and converted then a retest of the July high at 226.71 would become likely.
IWM 60min chart:
I think equity indices are in the early stages of a significant retracement here that will ideally retrace around 50% of the move up from the April lows before at least retesting the current highs. That will likely be the case whatever happens at this short term resistance point.
In the short term I’m leaning 70% towards a break down directly from this inflection point. We’ll see how that goes today and tomorrow.
If you like my analysis and would like to see more, please take a free subscription at my chartingthemarkets substack, where I publish these posts first. I also do a premarket video every day on equity indices, bonds, currencies, energies, precious commodities and other commodities at 8.45am EST, but only for paying subscribers. Other places to find me are my twitter, and my Youtube channel.
No comments:
Post a Comment