
In my post on Tuesday 5th August I was looking at the modest breaks back over the daily middle bands on SPX and QQQ on Monday and noting that conversion of those to support would open possible all time high retests, and hard fails there would strongly support the H&S patterns forming on both.
In my last post on Thursday 7th August I was saying the same about the second breaks on SPX and QQQ above those daily middle bands on Wednesday and looking at the three strong resistance trendlines on SPX, QQQ and DIA in the event that SPX and QQQ delivered those all time high retests.
Yesterday the headline inflation number remained moderate, though the core CPI number edged back up over 3%, but overall this was interpreted as bullish and we have now seen those all time high retests on both SPX and QQQ. IWM delivered a very strong break above the daily middle band yesterday into a full retest of the July high and DIA, though lagging badly behind, managed a slight break back over the daily middle band, closing at 444.68 against the daily middle band’s close at 443.66.
Short term this puts US equity indices in a short term inflection point as that modest break up on DIA, if it is going to fail, would most likely fail today or perhaps tomorrow. At the same time there are currently decent looking double top setups on all of SPX, QQQ and IWM.
On the DIA daily chart a second confirming daily close above the middle band is needed and, if DIA is going to head significantly higher, a decent move up from the middle band in the near future.
DIA daily chart:

If we are going to see US equity indices head higher from here then I will be watching the three high quality resistance trendlines that I was looking at in my last post, though the one on DIA isn’t currently in much danger of being hit.
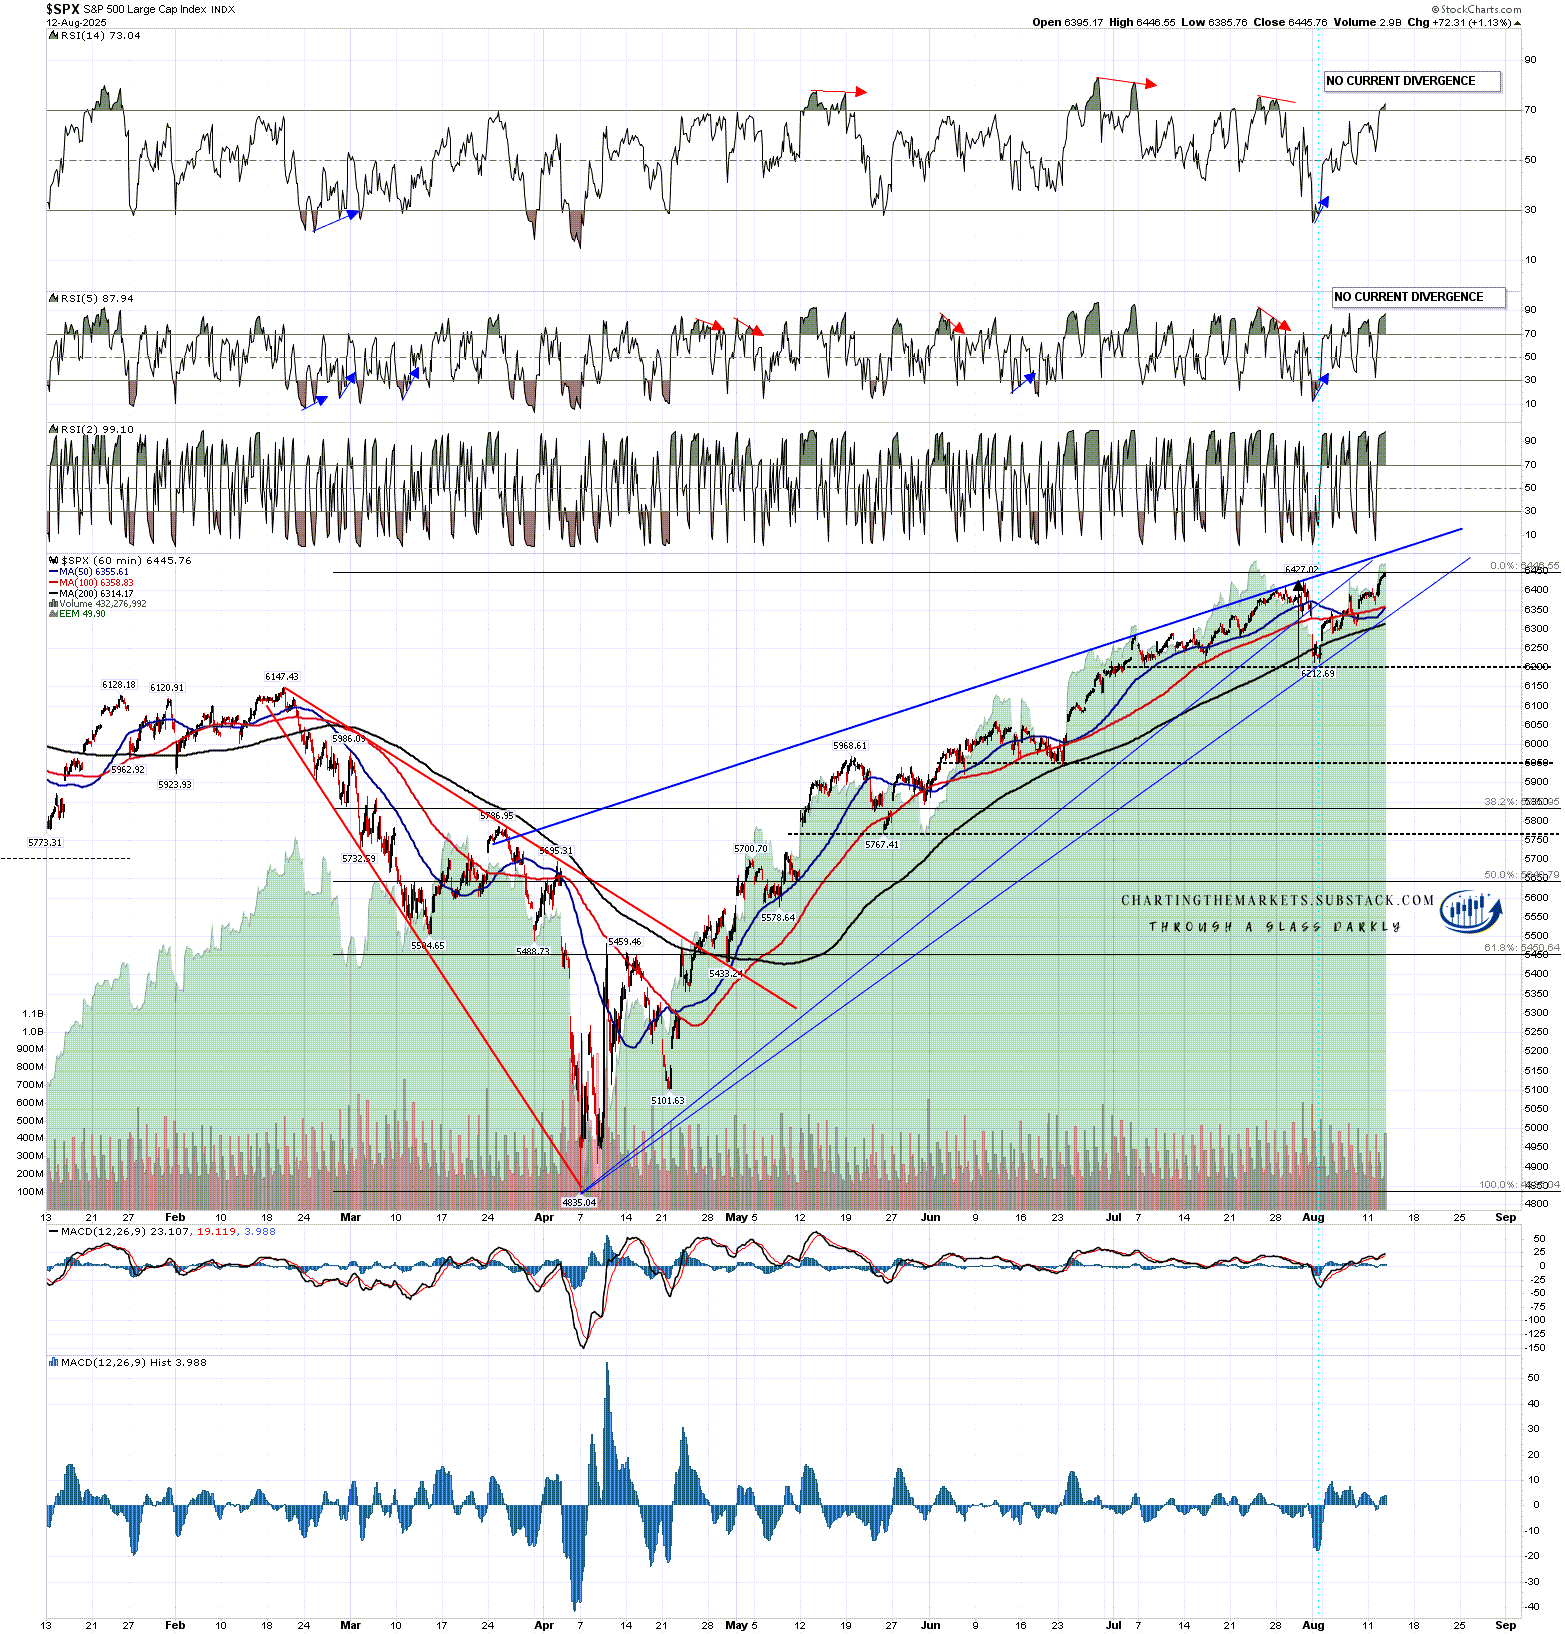
Of the other two, SPX has a decent quality possible double top setup currently but may be heading to that resistance trendline in an expansion of the rising wedge from the early April low. That trendline is currently in the 6490-6500 area and is rising about 5 handles per day.
SPX 60min chart:
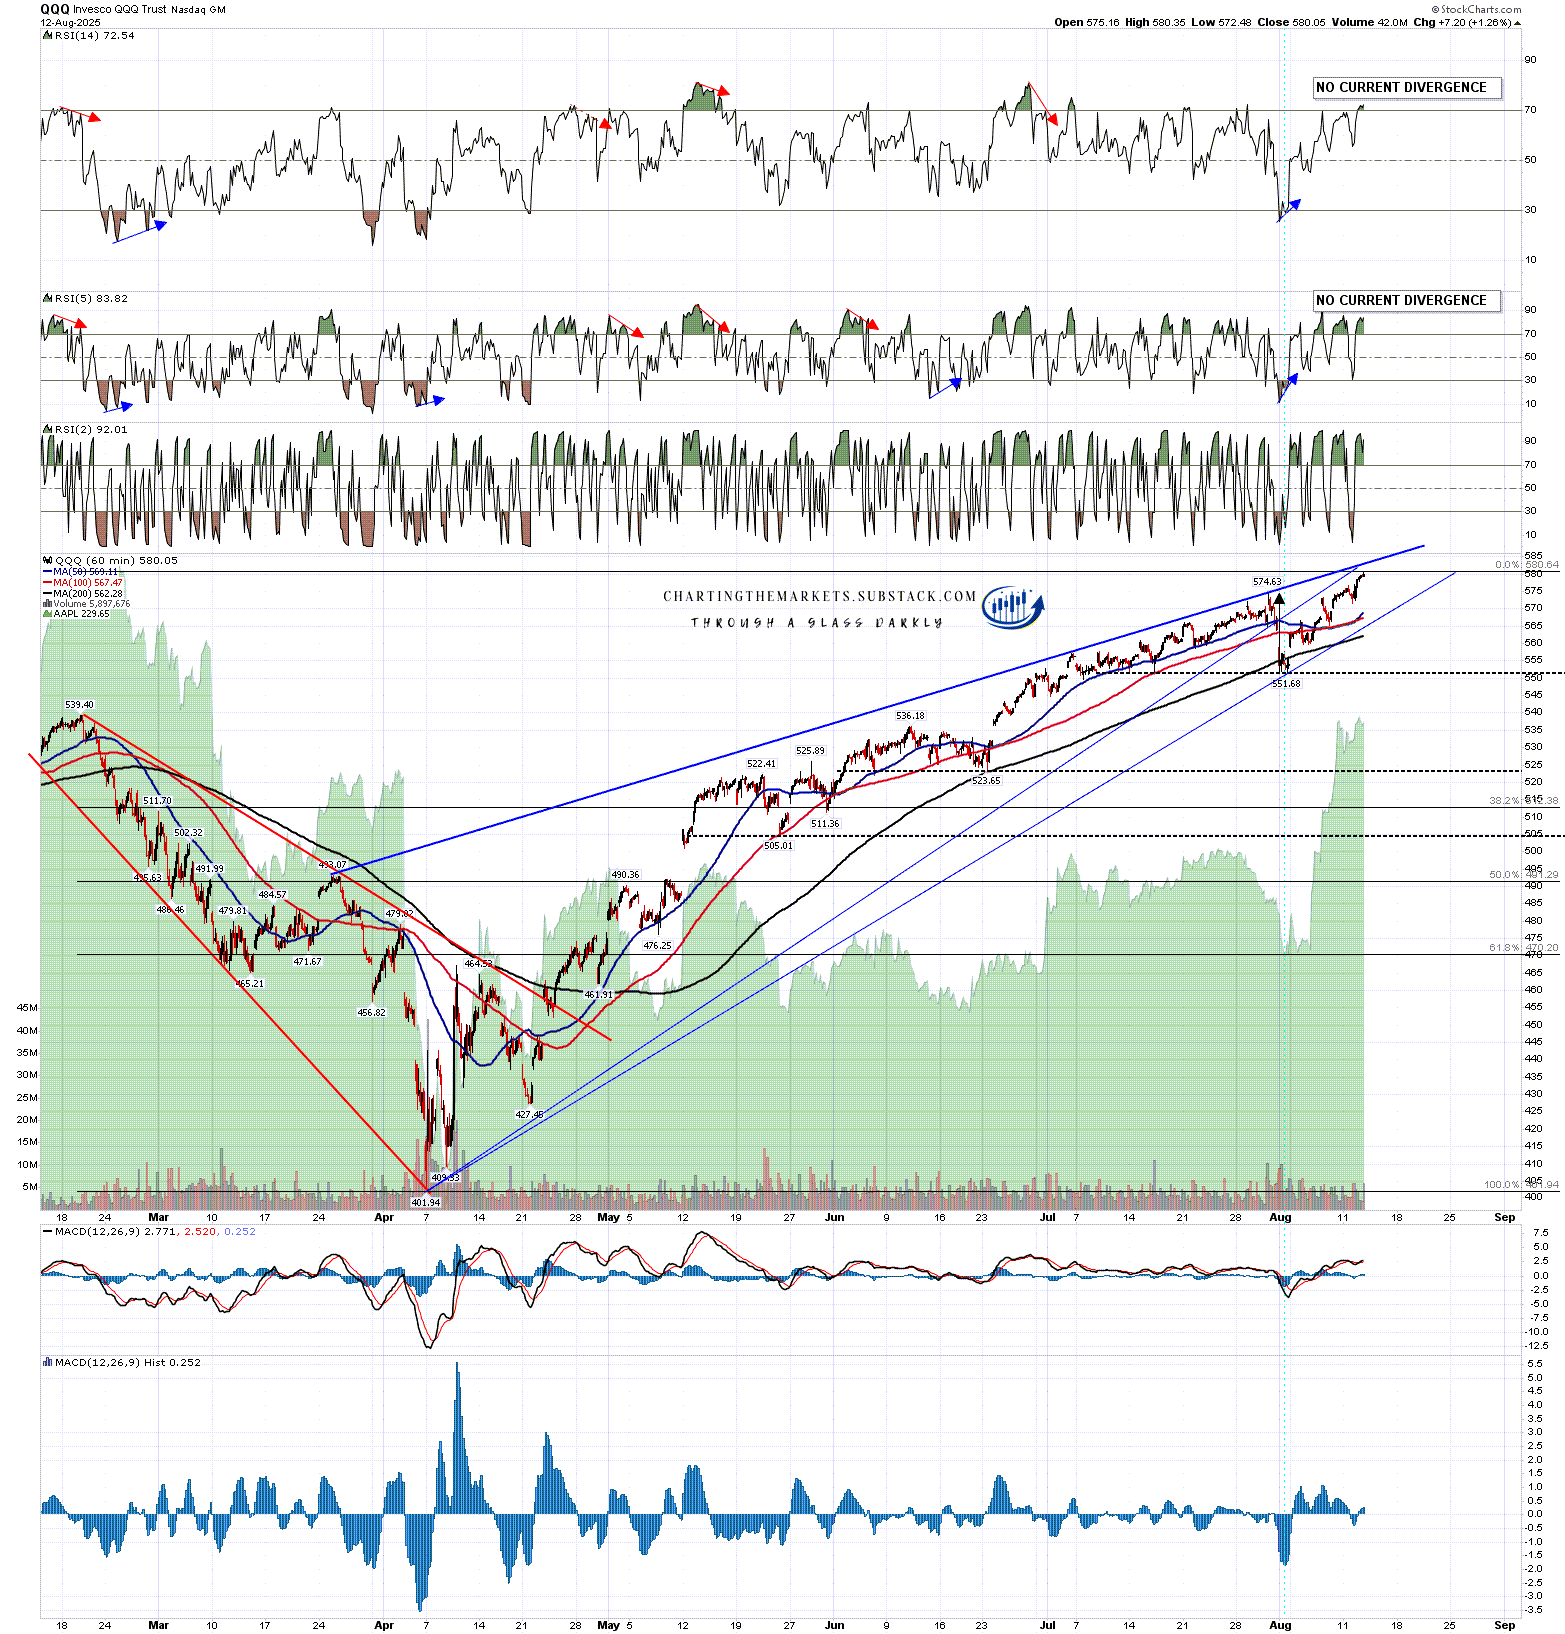
QQQ also has a decent quality possible double top setup currently but may be heading to the resistance trendline there in an expansion of the rising wedge from the early April low. That trendline is currently in the 583 area and is rising about 0.7 handles per day.
If these two resistance trendlines are reached, and a short term high is forming there, both of those trendlines might overthrow bearishly at the high of course.
QQQ 60min chart:
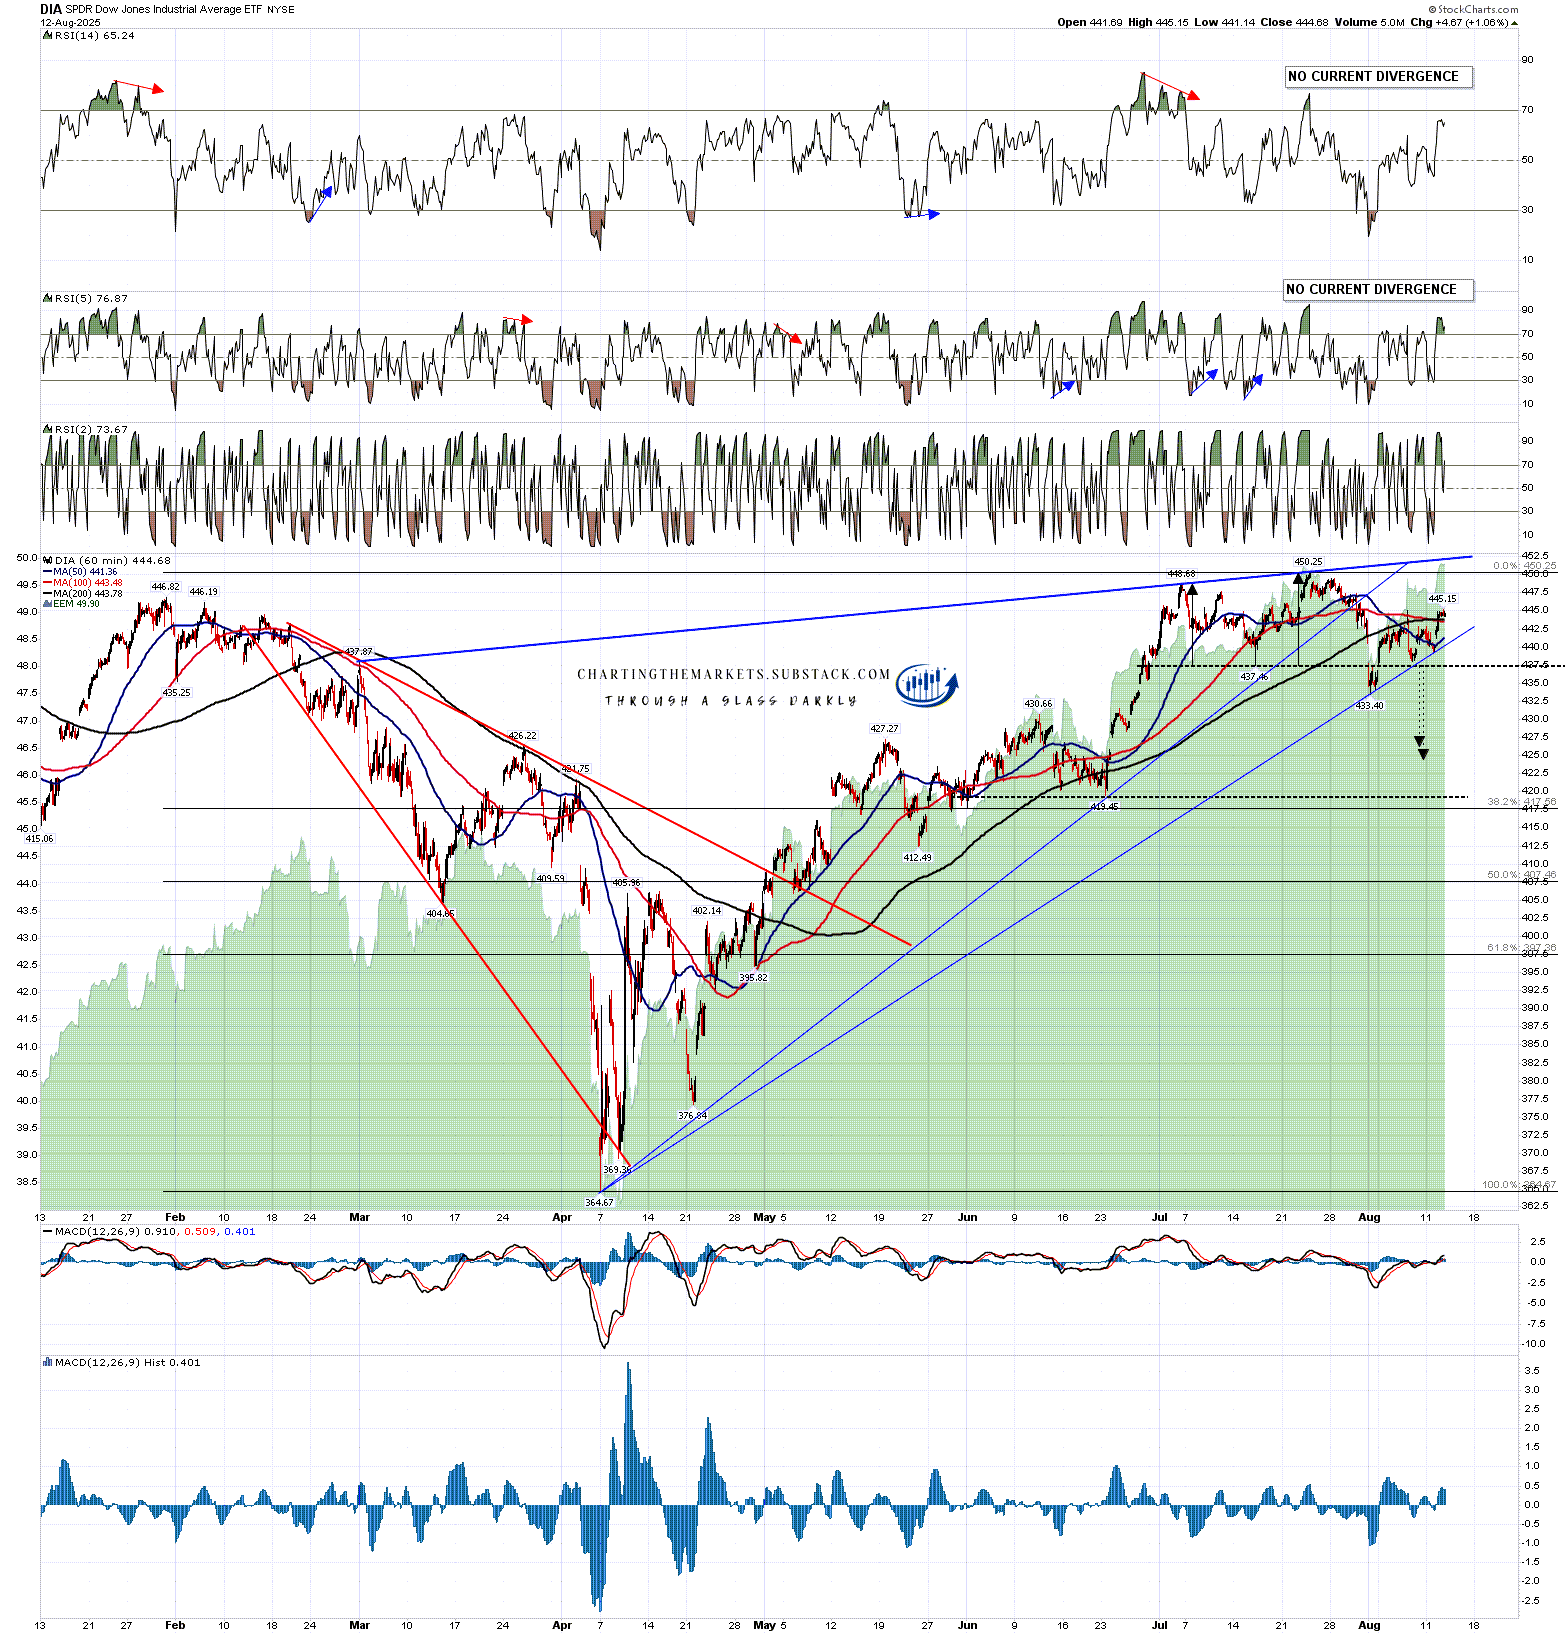
There’s no obvious reason yet to expect the resistance trendline on DIA to be tested in the near future, but if the July high is tested, then it would not be far above. That trendline is currently in the 452 area and is rising about 0.09 handles per day.
DIA 60min chart:
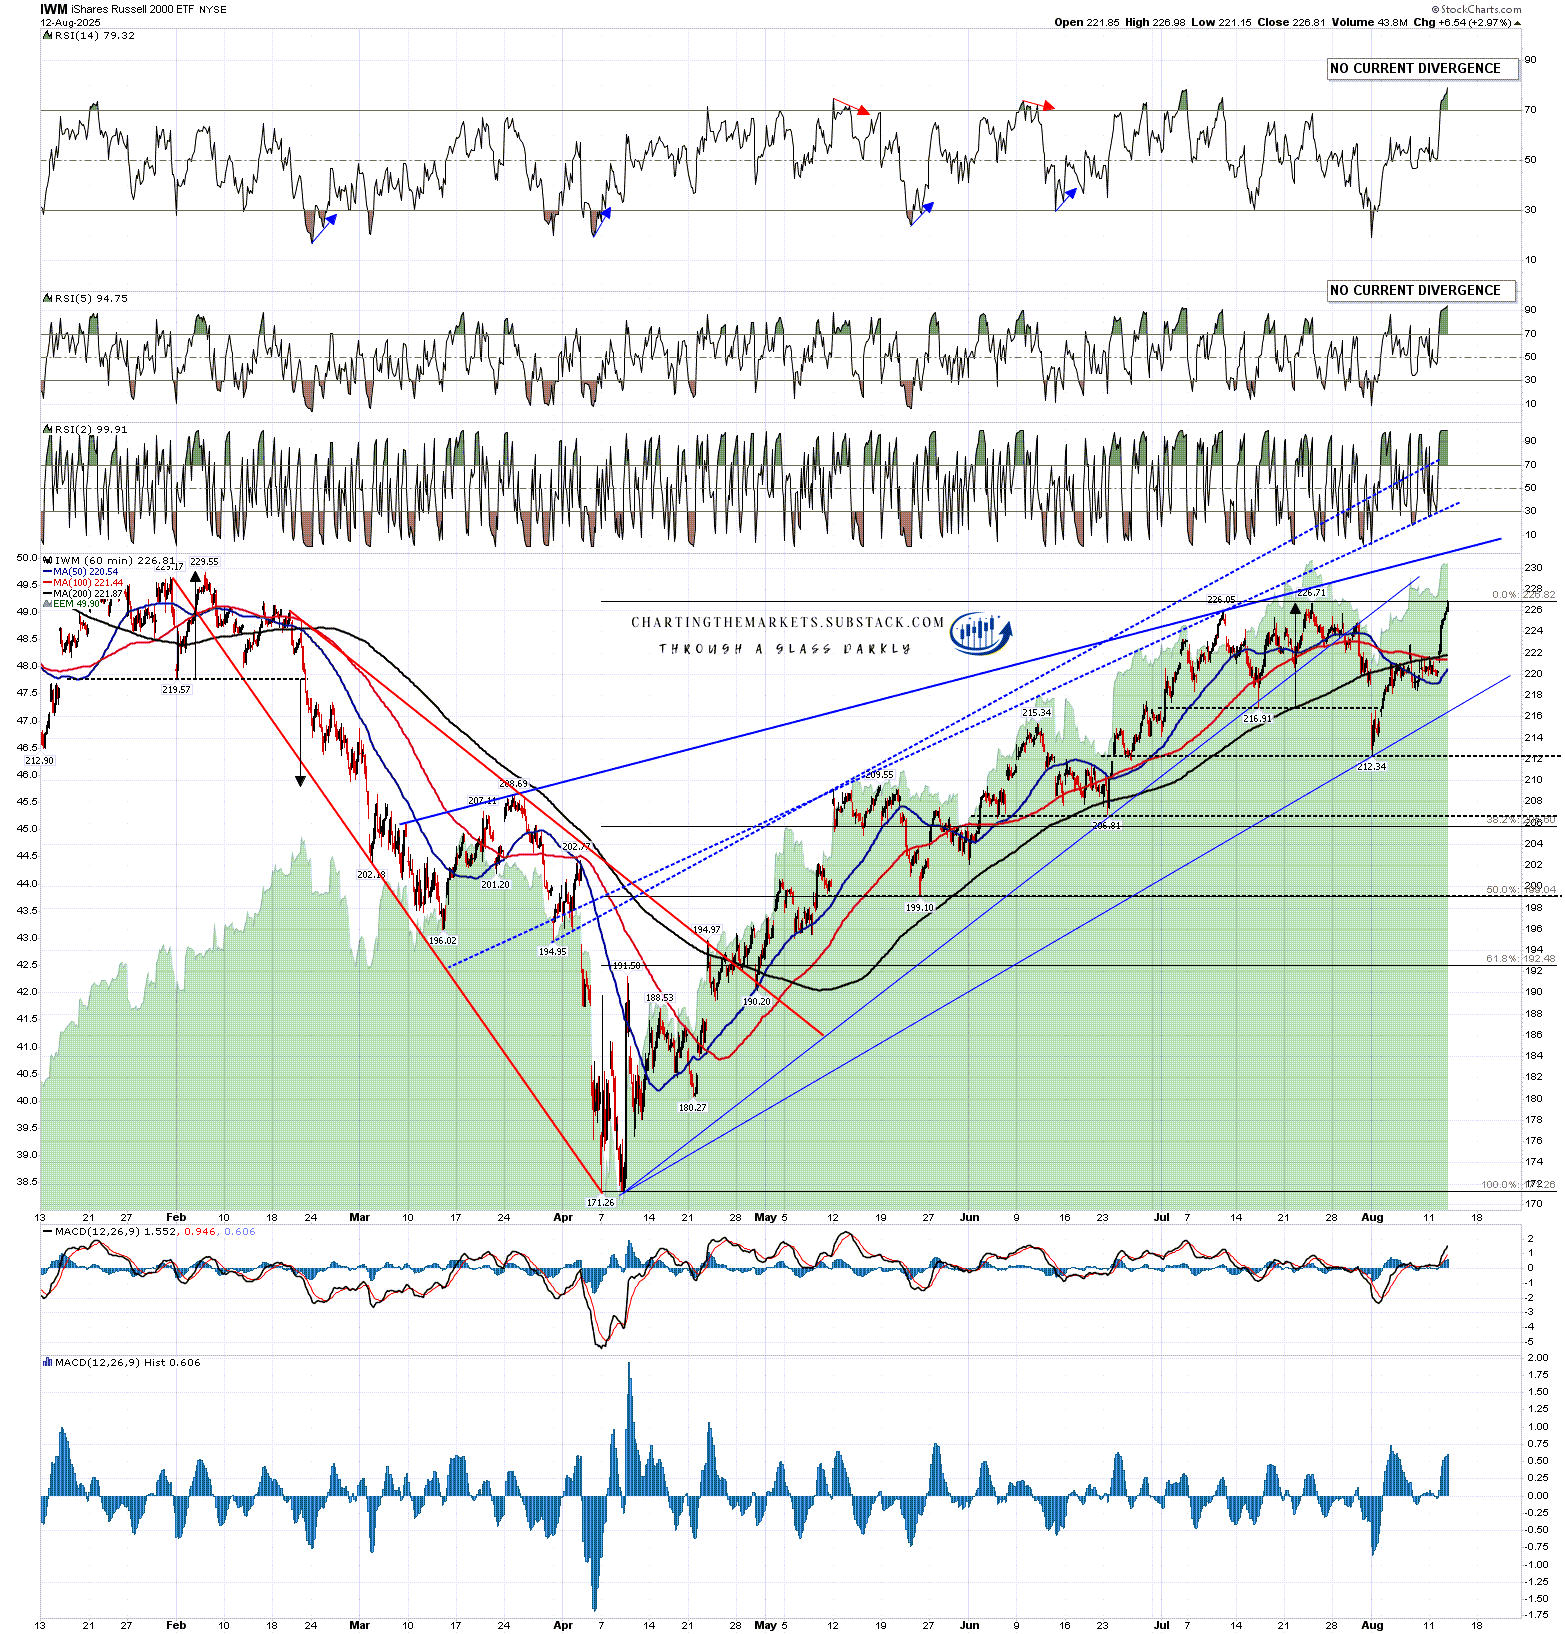
IWM rose hard yesterday on the expectation that interest rates might be going down soon as the smaller caps are more sensitive to interest rates.
I have a decent looking trendline there too, albeit not quite as high quality as the other three, and that is currently in the 231.5 area & rising about 0.33 handles per day.
IWM 60min chart:
I would note though that while there has been for decades a polite fiction that the Fed controls interest rates, that isn’t actually true. Lending rates are based on the ten and thirty year treasury yields (TNX & TYX) and those are set directly by the bond markets. Both have traded sideways since the April low on equities. The Fed cut the discount rate by 1% from September to December 2024 and since that started the ten year treasury yield (TNX) has risen 0.6%, and the thirty year treasury yield (TYX) has risen 1%. If the Fed cuts rates now that may again have no impact on actual interest rates.
There is also an increasing danger to both equity and bond markets from the Trump Administration. There have been for decades two strong, independent and internationally trusted institutions in the US delivering economic numbers and they are the Federal Reserve, and the Bureau of Labor Statistics (BLS). Last week Trump fired the BLS chief and appointed an inexperienced political hack in her place. Jerome Powell at the Fed looks secure for now but that is in part because his term in office ends in May 2026. When he goes it seems very possible that another political hack may be appointed in his place.
I don’t know how many of you have read Douglas Adams and his wonderful Hitchhiker’s Guide series but the Galactic President in that series, Zaphod Beeblebrox, had a pair of Peril Sensitive Sunglasses that in the event of any trouble turned completely black, thus preventing Zaphod from ever seeing anything that might alarm him. It seems that Donald Trump may be doing something similar at the BLS and planning more of the same at the Fed. If so that will reduce the transparency and trustworthiness of US economic numbers and the confidence of foreign governments and investors, who own close to a quarter of both the US equity markets and the US national Debt.
Obviously that could end very badly, and Trump’s dream of having an obedient Fed chair that cuts interest rates back down to 1%, might well instead deliver a crisis of confidence that could send actual interest rates in the US far higher.
If you like my analysis and would like to see more, please take a free subscription at my chartingthemarkets substack, where I publish these posts first. I also do a premarket video every day on equity indices, bonds, currencies, energies, precious commodities and other commodities at 8.45am EST, but only for paying subscribers. Other places to find me are my twitter, and my Youtube channel.
No comments:
Post a Comment