
In my post on Tuesday 5th August I was looking at the modest breaks back over the daily middle bands on SPX and QQQ on the previous day and noting that conversion of those to support would open possible all time high retests, and hard fails there would strongly support the H&S patterns forming on both.
In my post on Thursday 7th August I was saying the same about the second breaks on SPX and QQQ above those daily middle bands on Wednesday and looking at the three strong resistance trendlines on SPX, QQQ and DIA in the event that SPX and QQQ delivered those all time high retests.
In my post on Wednesday 13th August I added a fourth target trendline on IWM and noted a short term inflection point as we waited to see whether DIA would confirm the break back over the daily middle band on Tuesday. That resolved into a strong break higher on DIA.
By the weekend two out of four of my target trendlines on US equity indices had been hit perfectly on QQQ & DIA and held as resistance, with near misses on the SPX and IWM so far.
Every so often I get a comment from someone that market moves are random and, if that was the case, it would be remarkable if one of those trendlines got a perfect hit and reversal. The odds of that happening twice in the same week would be very low indeed. That is the power of a really well drawn trendline, which is to identify the underlying structure that was already there.
So what now? Well that these two trendlines were hit and respected confirms that they are the correct resistance trendlines from the April low, They match support trendlines that confirm two rising wedges that will likely in due course break down and deliver either a retracement and continuation higher, or a full reversal back into the April low.
In the short term, just under those resistance trendlines, it means that US indices will likely see a period of consolidation or retracement here until those trendlines go higher and create room for US indices to go higher too.
Can those trendlines break? Any trendlines can break, but if we see that here that would likely be a bearish overthrow signalling a decent retracement in this area. The lower probability scenario would be a hard break up, though that does happen and for anyone interested I showed a good example of that that I called in 2021 on SPX in my The Bigger Picture video yesterday.
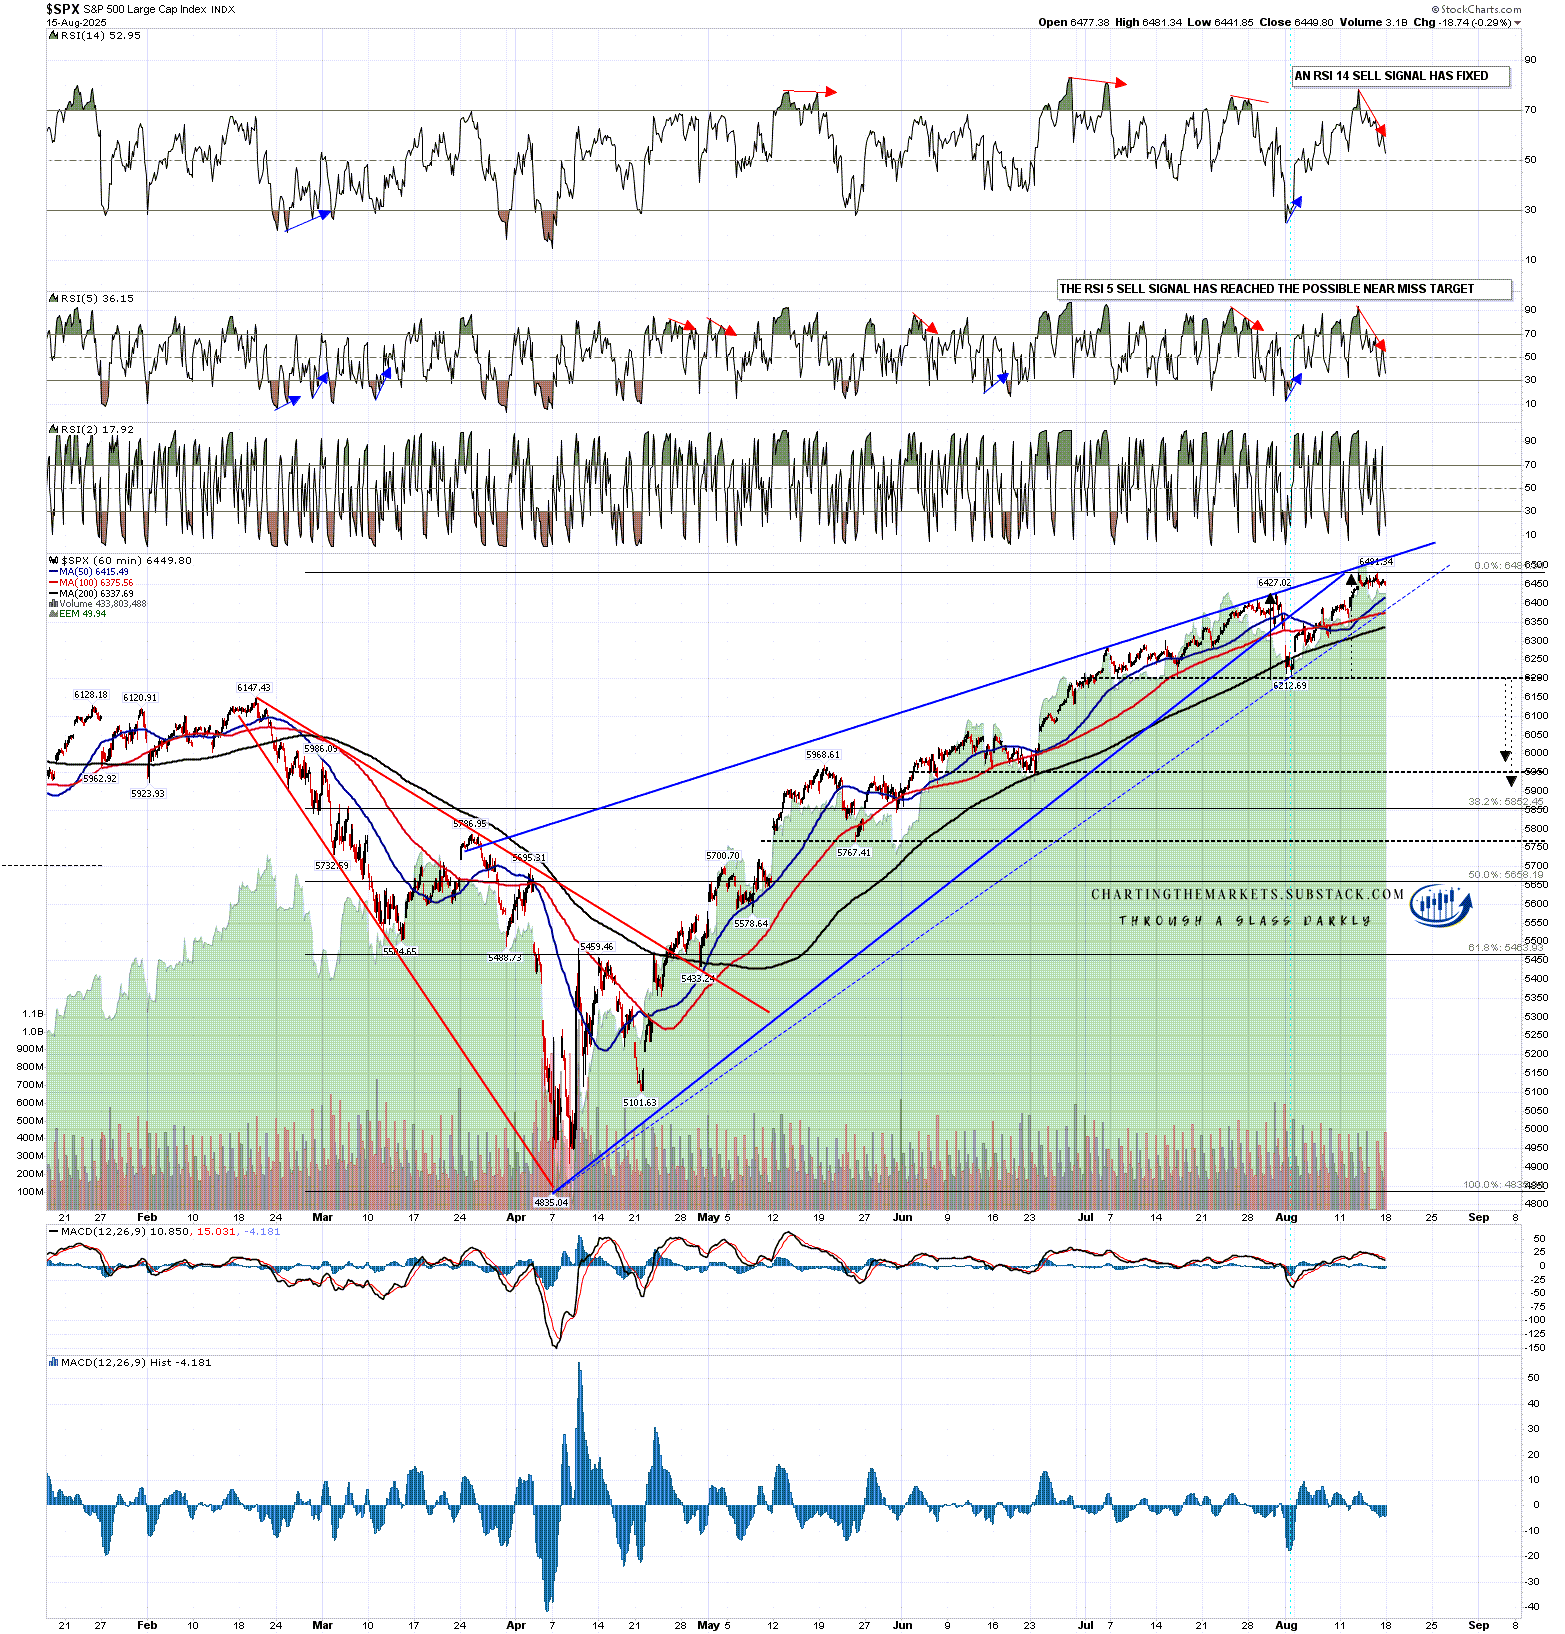
Looking at the SPX hourly chart the target trendline was almost reached and might yet still be reached this week. I haven’t yet drawn in the support trendline going through the August low as unbroken, but there is still of course a high quality falling wedge there that has already broken down.
At some point I would expect this to break down into a minimum 38.2%, and ideally 50%, retracement of the move up from the April low and that retracement is definitely overdue. We may well be topping out for that here. In this case the obvious topping pattern would be an asymmetric double top or part-formed H&S with pattern support at 6212.69 and a full target in the 5900 area, close to the 38.2% fib retracement level at 5852.
SPX 60min chart:
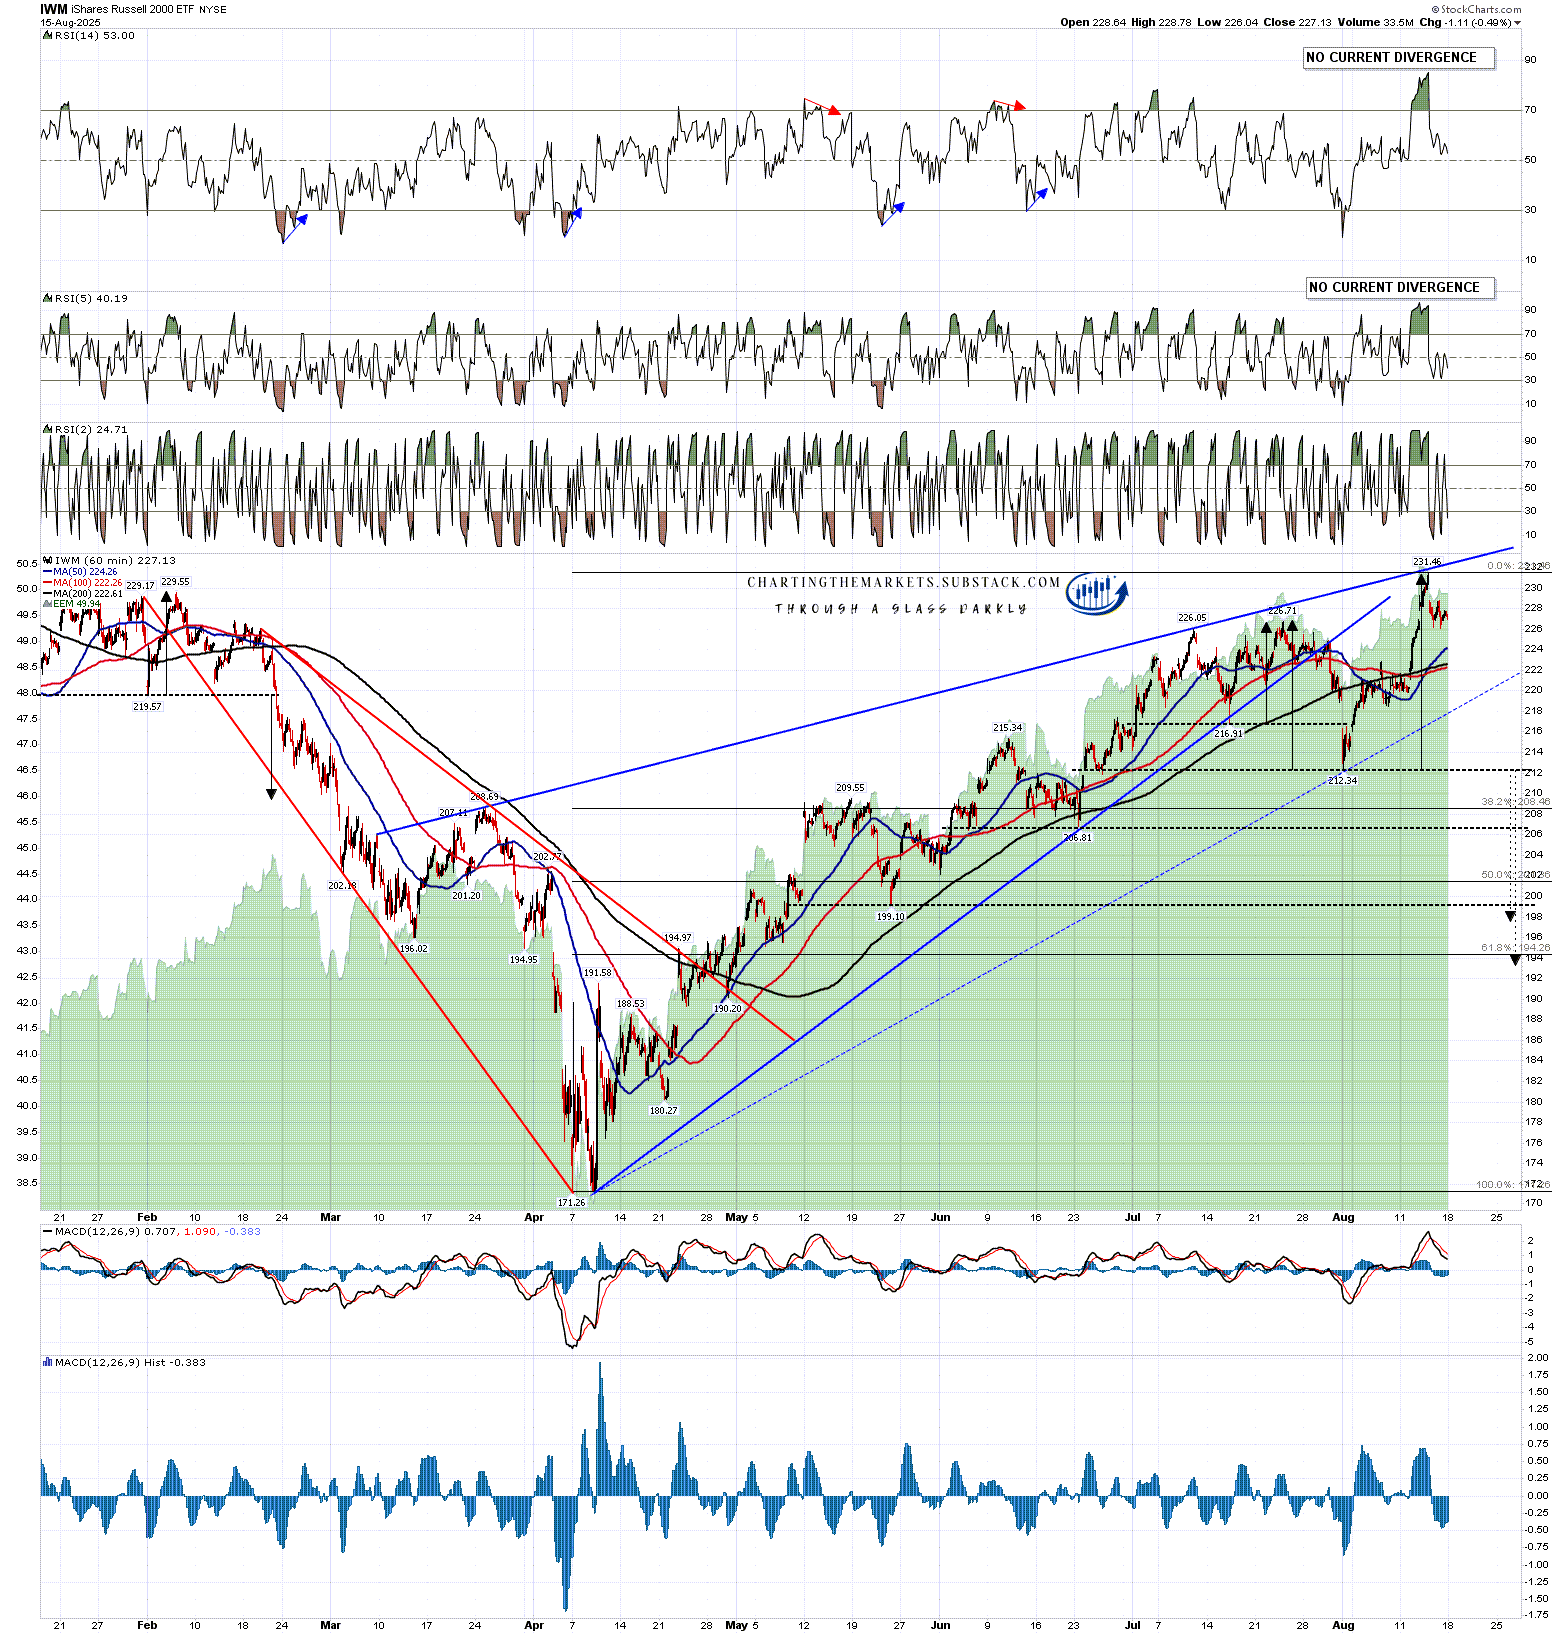
Looking at the IWM hourly chart the target trendline was almost reached and might yet still be reached this week. I haven’t yet drawn in the support trendline going through the August low as unbroken, but there is still of course a high quality falling wedge there that has already broken down.
At some point I would expect this to break down into a minimum 38.2%, and ideally 50%, retracement of the move up from the April low and that retracement is definitely overdue. We may well be topping out for that here. In this case the obvious topping pattern would also be an asymmetric double top or part-formed H&S with pattern support at 212.34 and a target range in the 193-8 area, close to the 61.8% fib retracement level at 194.26.
IWM 60min chart:
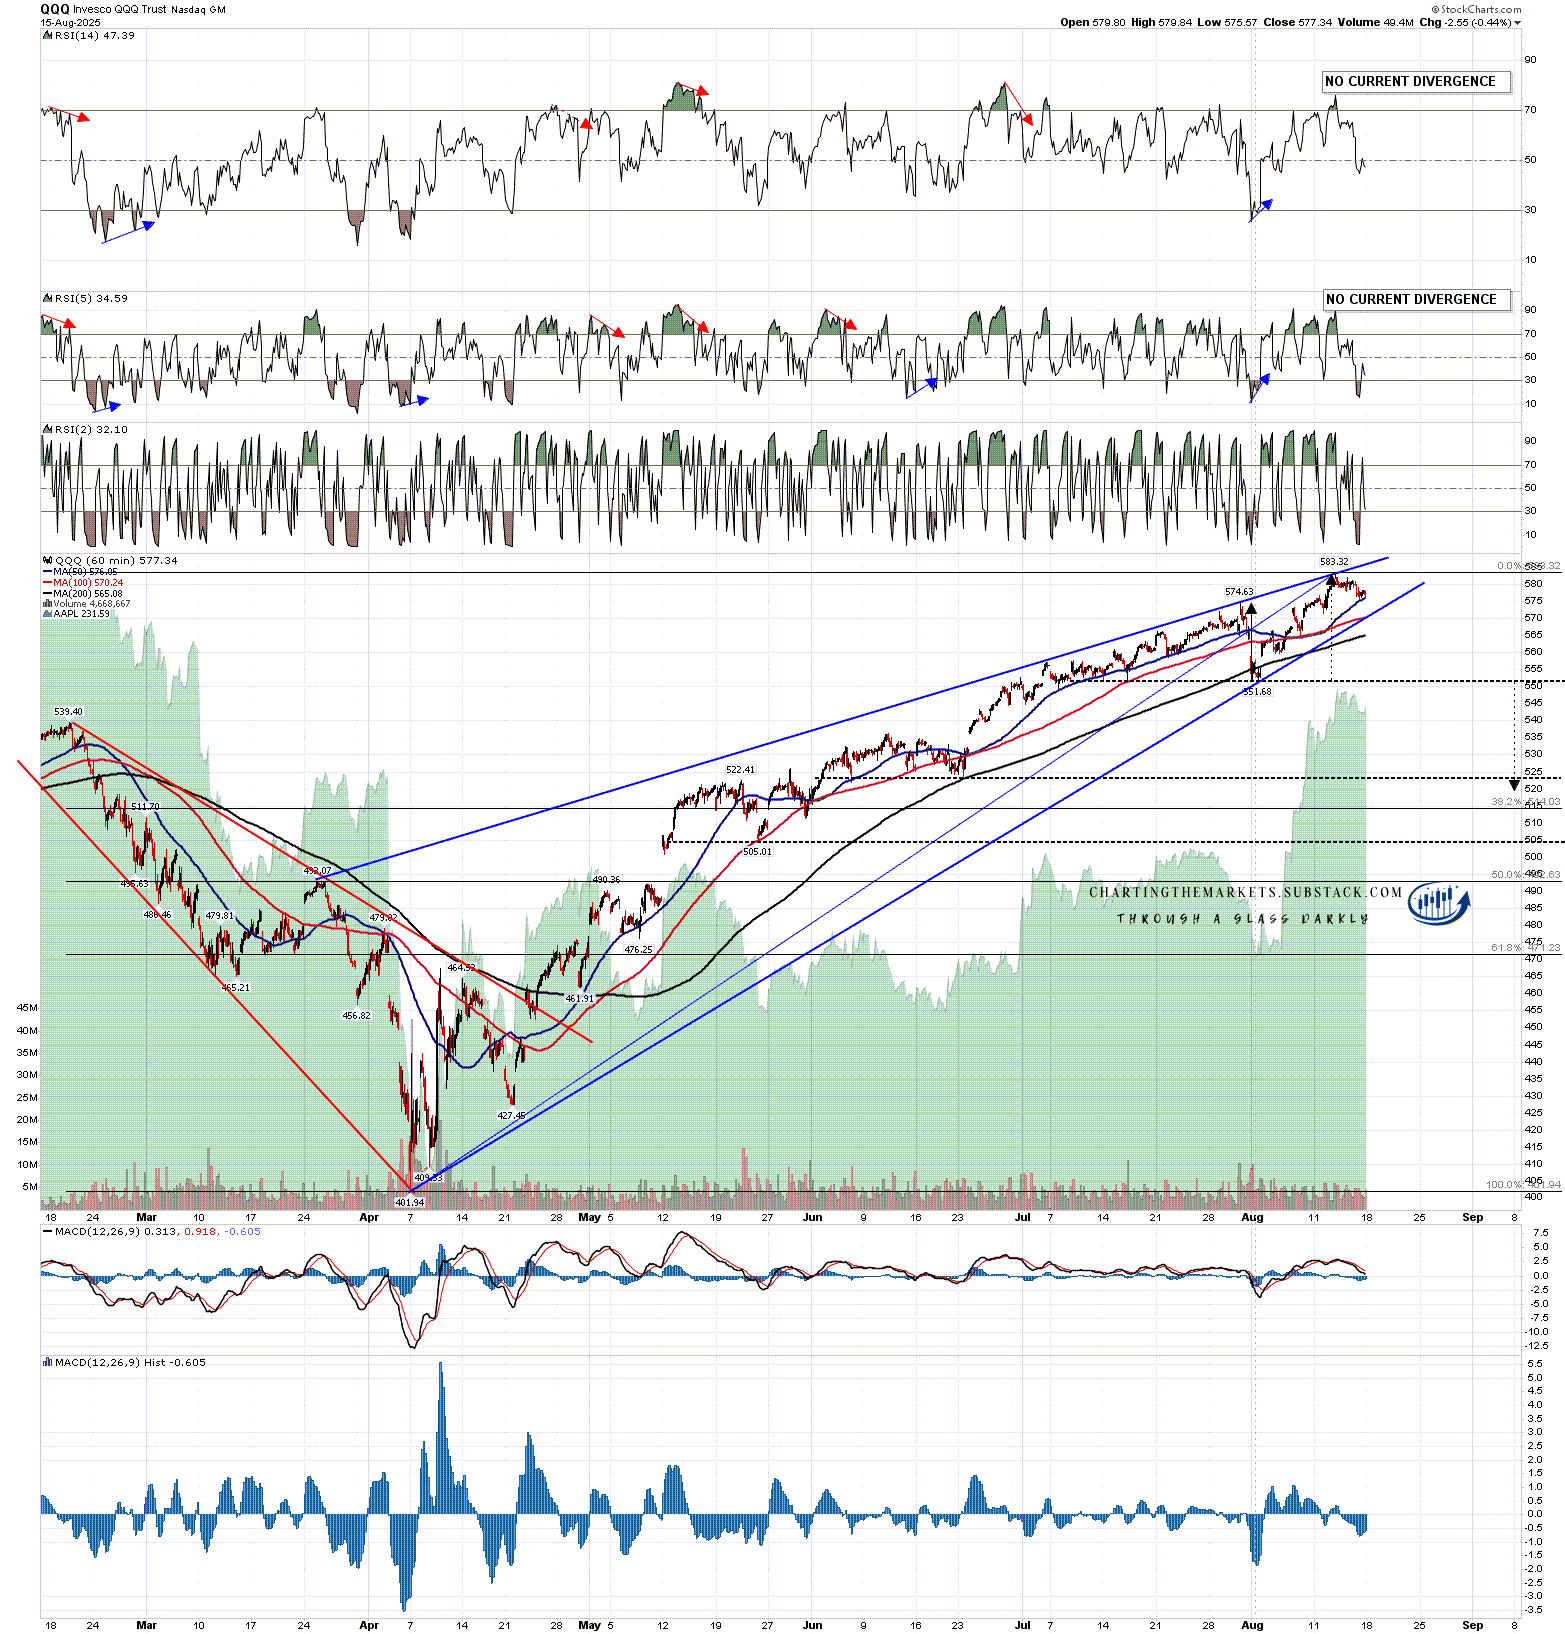
Looking at the QQQ hourly chart the target trendline was hit perfectly so I have now drawn in the rising wedge support trendline going through the August low as unbroken.
At some point I would expect this to break down into a minimum 38.2%, and ideally 50%, retracement of the move up from the April low and that retracement is definitely overdue. We may well be topping out for that here. In this case the obvious topping pattern would also be a part-formed H&S with the neckline at 551.68 and a target in the 520 area, close to the 38.2% fib retracement level at 514.
QQQ 60min chart:
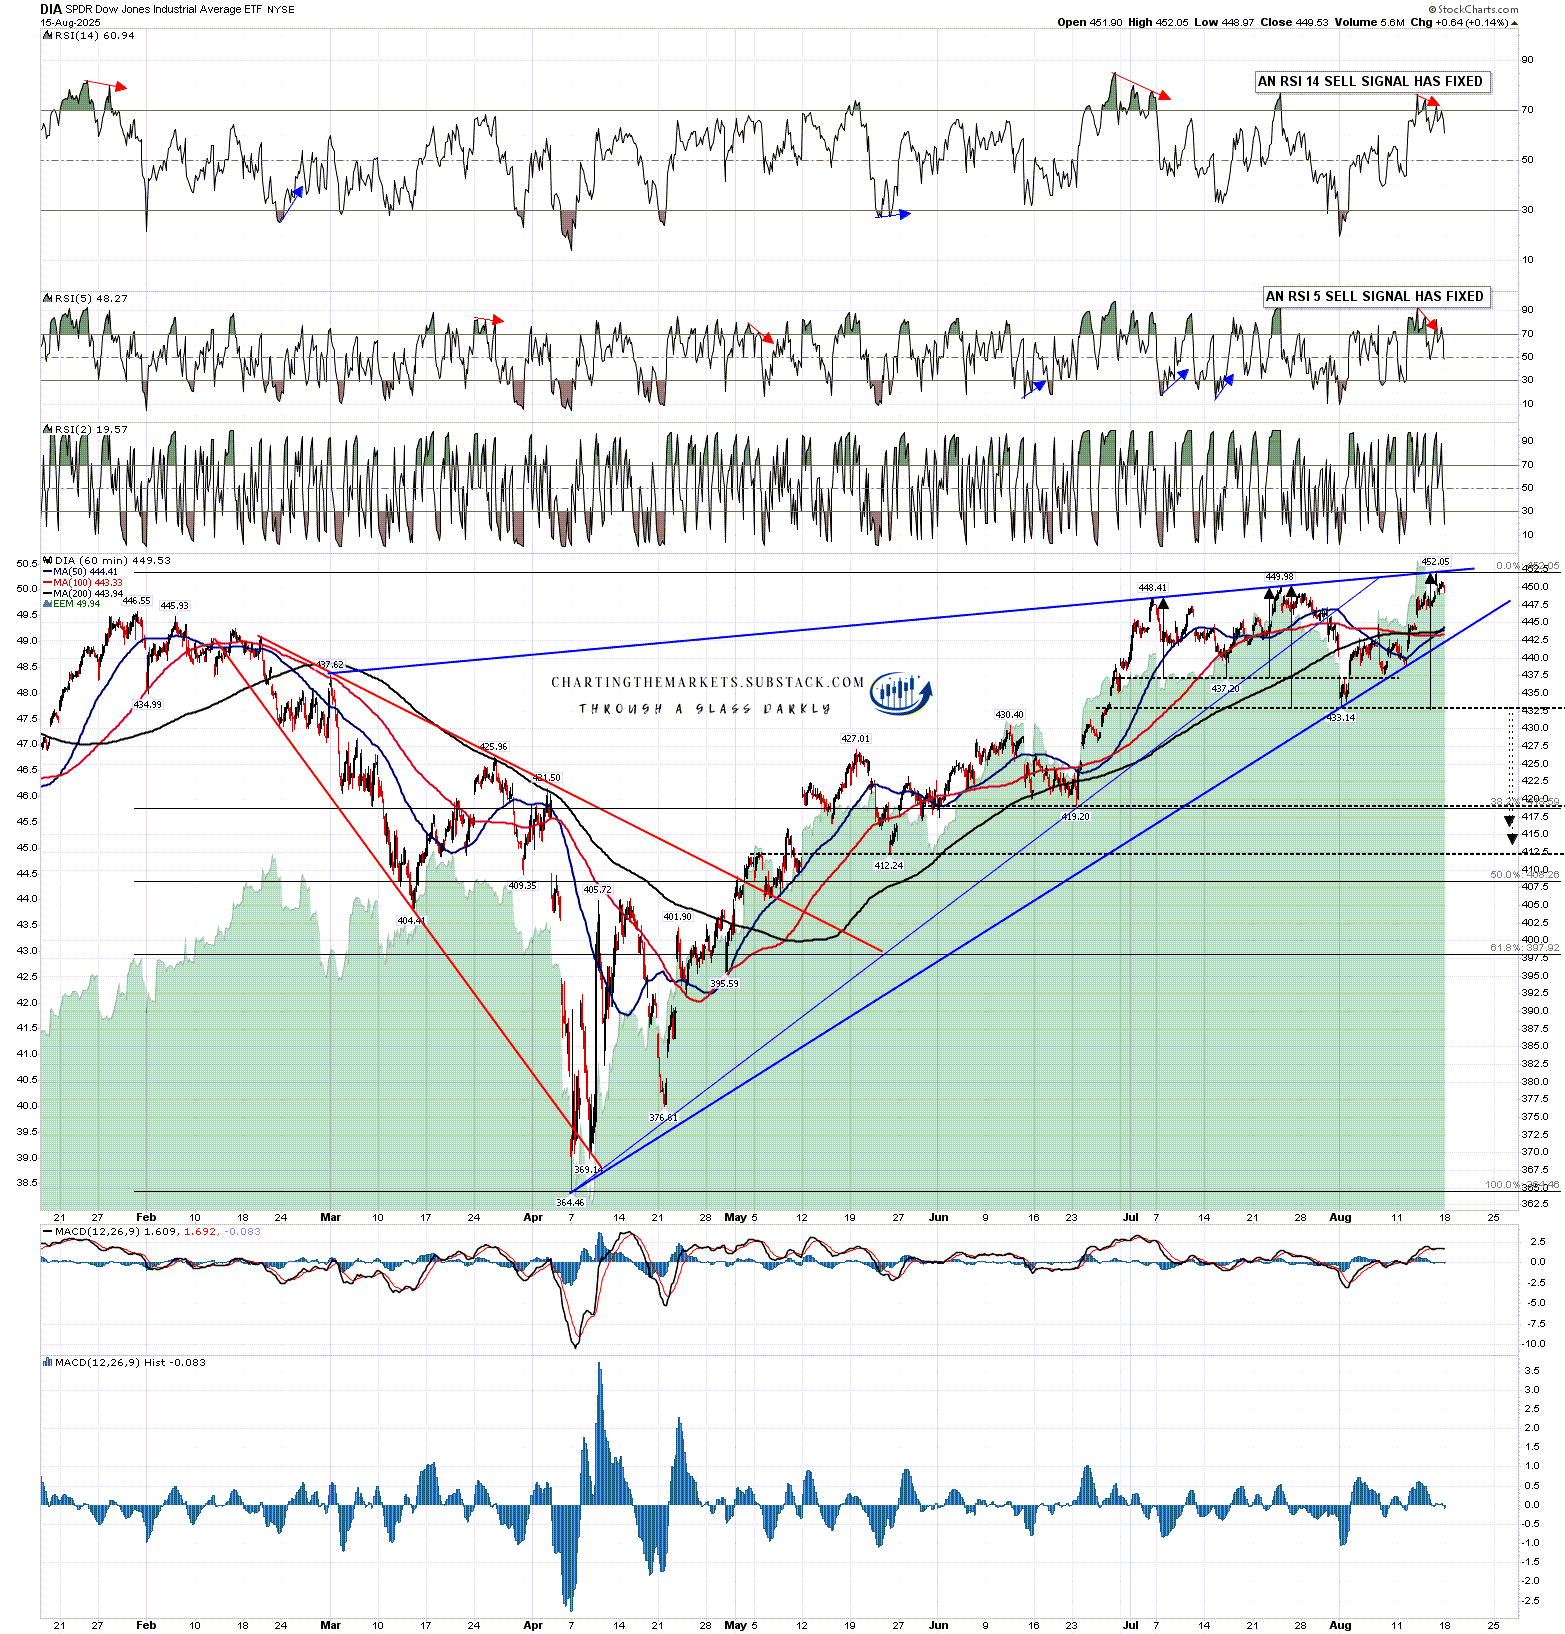
Looking at the DIA hourly chart the target trendline was hit perfectly so I have now drawn in the rising wedge support trendline going through the August low as unbroken.
At some point I would expect this to break down into a minimum 38.2%, and ideally 50%, retracement of the move up from the April low and that retracement is definitely overdue. We may well be topping out for that here. In this case the obvious topping pattern would also be a double top with support at 433.14 and a target range in the 413.50 to 416 area, under the 38.2% fib retracement level at 419.50.
DIA 60min chart:
So what next? Well I’m seeing decent looking short term bull flag setups on NQ and RTY here and I’m thinking that the current highs may well get a retest early this week. If we see that then we could get some good quality possible daily RSI 5 sell signals brewing on SPX, QQQ and IWM, and a possible lower quality one on DIA. If we are going to see a decent retracement start in this area that would strengthen the setup.
SPX daily chart:
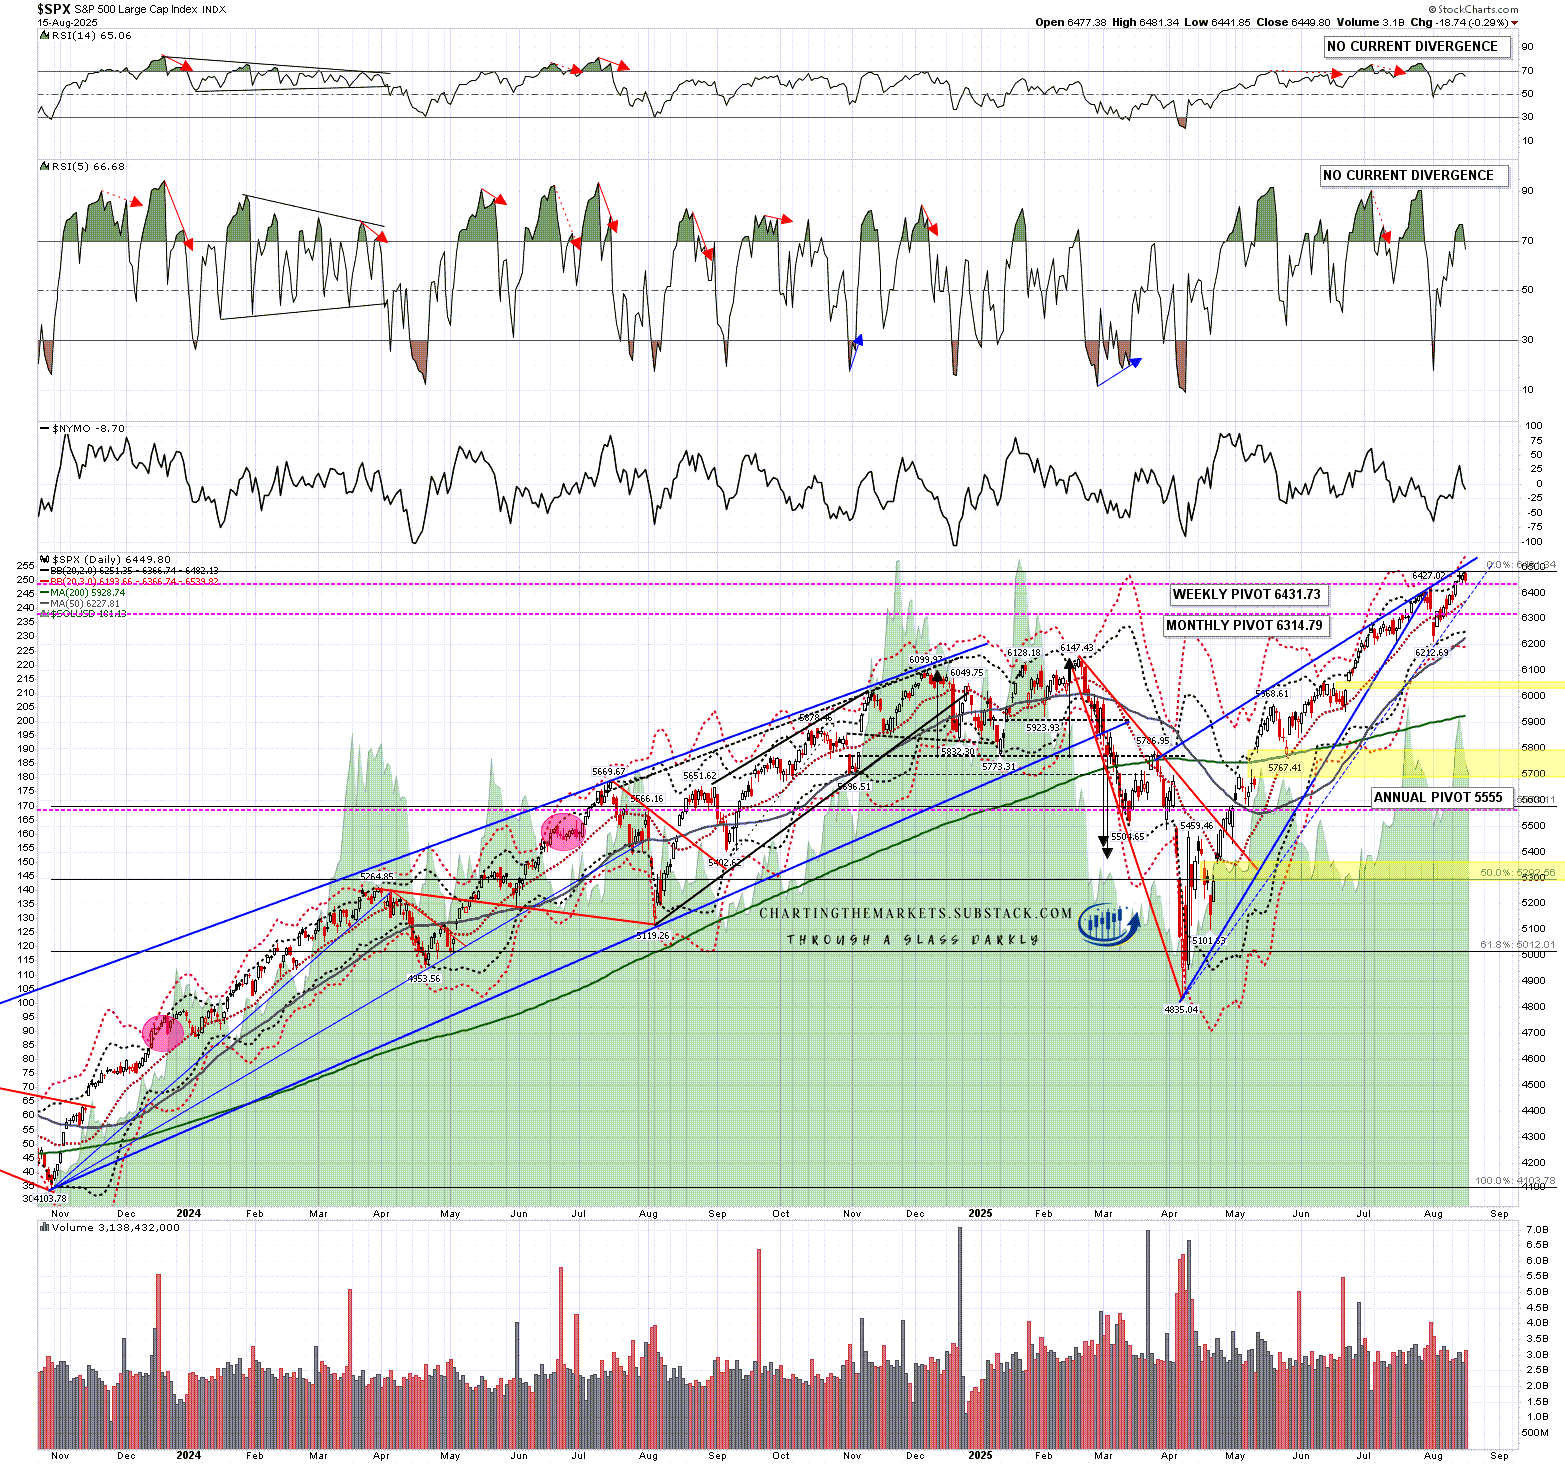
What are the odds that all four of these indices are topping out for that overdue decent retracement here? Pretty good in my view, and at minimum a period of consolidation is likely here to create some space between price and these rising resistance trendlines.
I said back in April that it takes a few months for bad economic numbers to feed through and in the last few days we have seen those start to feed through on both jobs and inflation. We may still not be ready for those retracements yet but this is a very nice looking setup.
I am still thinking that a big high on this uptrend may not be seen before the end of this year.
If you like my analysis and would like to see more, please take a free subscription at my chartingthemarkets substack, where I publish these posts first. I also do a premarket video every day on equity indices, bonds, currencies, energies, precious commodities and other commodities at 8.45am EST, but only for paying subscribers. Other places to find me are my twitter, and my Youtube channel.
No comments:
Post a Comment