
In my post on the morning of Wednesday 30th July I was looking at the pattern setups on SPX, QQQ and DIA and saying that these delivered a very nice setup for at least a short time high forming there.
In my post on the morning of Friday 1st August I was looking at the first real signs of weakness on the US equity indices since the April low after the strong breaks of the daily middle bands on DIA and IWM on Thursday, and saying that confirmation was needed with further breaks of the daily middle bands on SPX and QQQ.
We saw those further breaks on Friday so it is likely that the first significant retracement on US indices since the April low are now in progress. So what next?
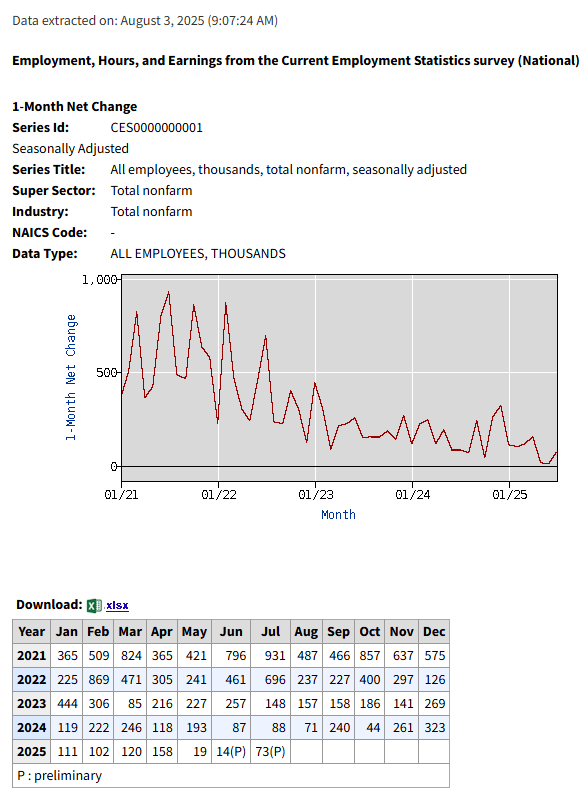
Well it’s worth looking first at the reason market had such a bad day on Friday and that was the horrible employment numbers after I published my post on Friday morning.
The estimated employment numbers for July weren’t actually that bad, though these are generally revised before reaching a final number two months after the first release, it was the revisions to the numbers for May and June that were bad, reducing May’s number to a final 19k, the lowest final number since 2020 & COVID, and June to a still estimated 14k, currently the lowest number since 2020 but not yet final. The July number at 73k was still not good, as it was the fifth worst number since 2020, with the third and fourth worst numbers in August and October last year.
How bad are these numbers? Well I would note that the average job creation Jan to Oct last year was about 140k, with the optimism after Trump’s election adding about 300k jobs over that average in Nov & Dec. If you were to add that 300k back into the 2025 numbers then the average would be about 130k in 2025 so far this year, so the numbers aren’t necessarily as bad as they look, but at minimum they aren’t encouraging for the rest of this year. Trump’s new golden age for the US economy may not have started yet.
US Jobs Numbers 2021-Date from Bureau of Labor Statistics:
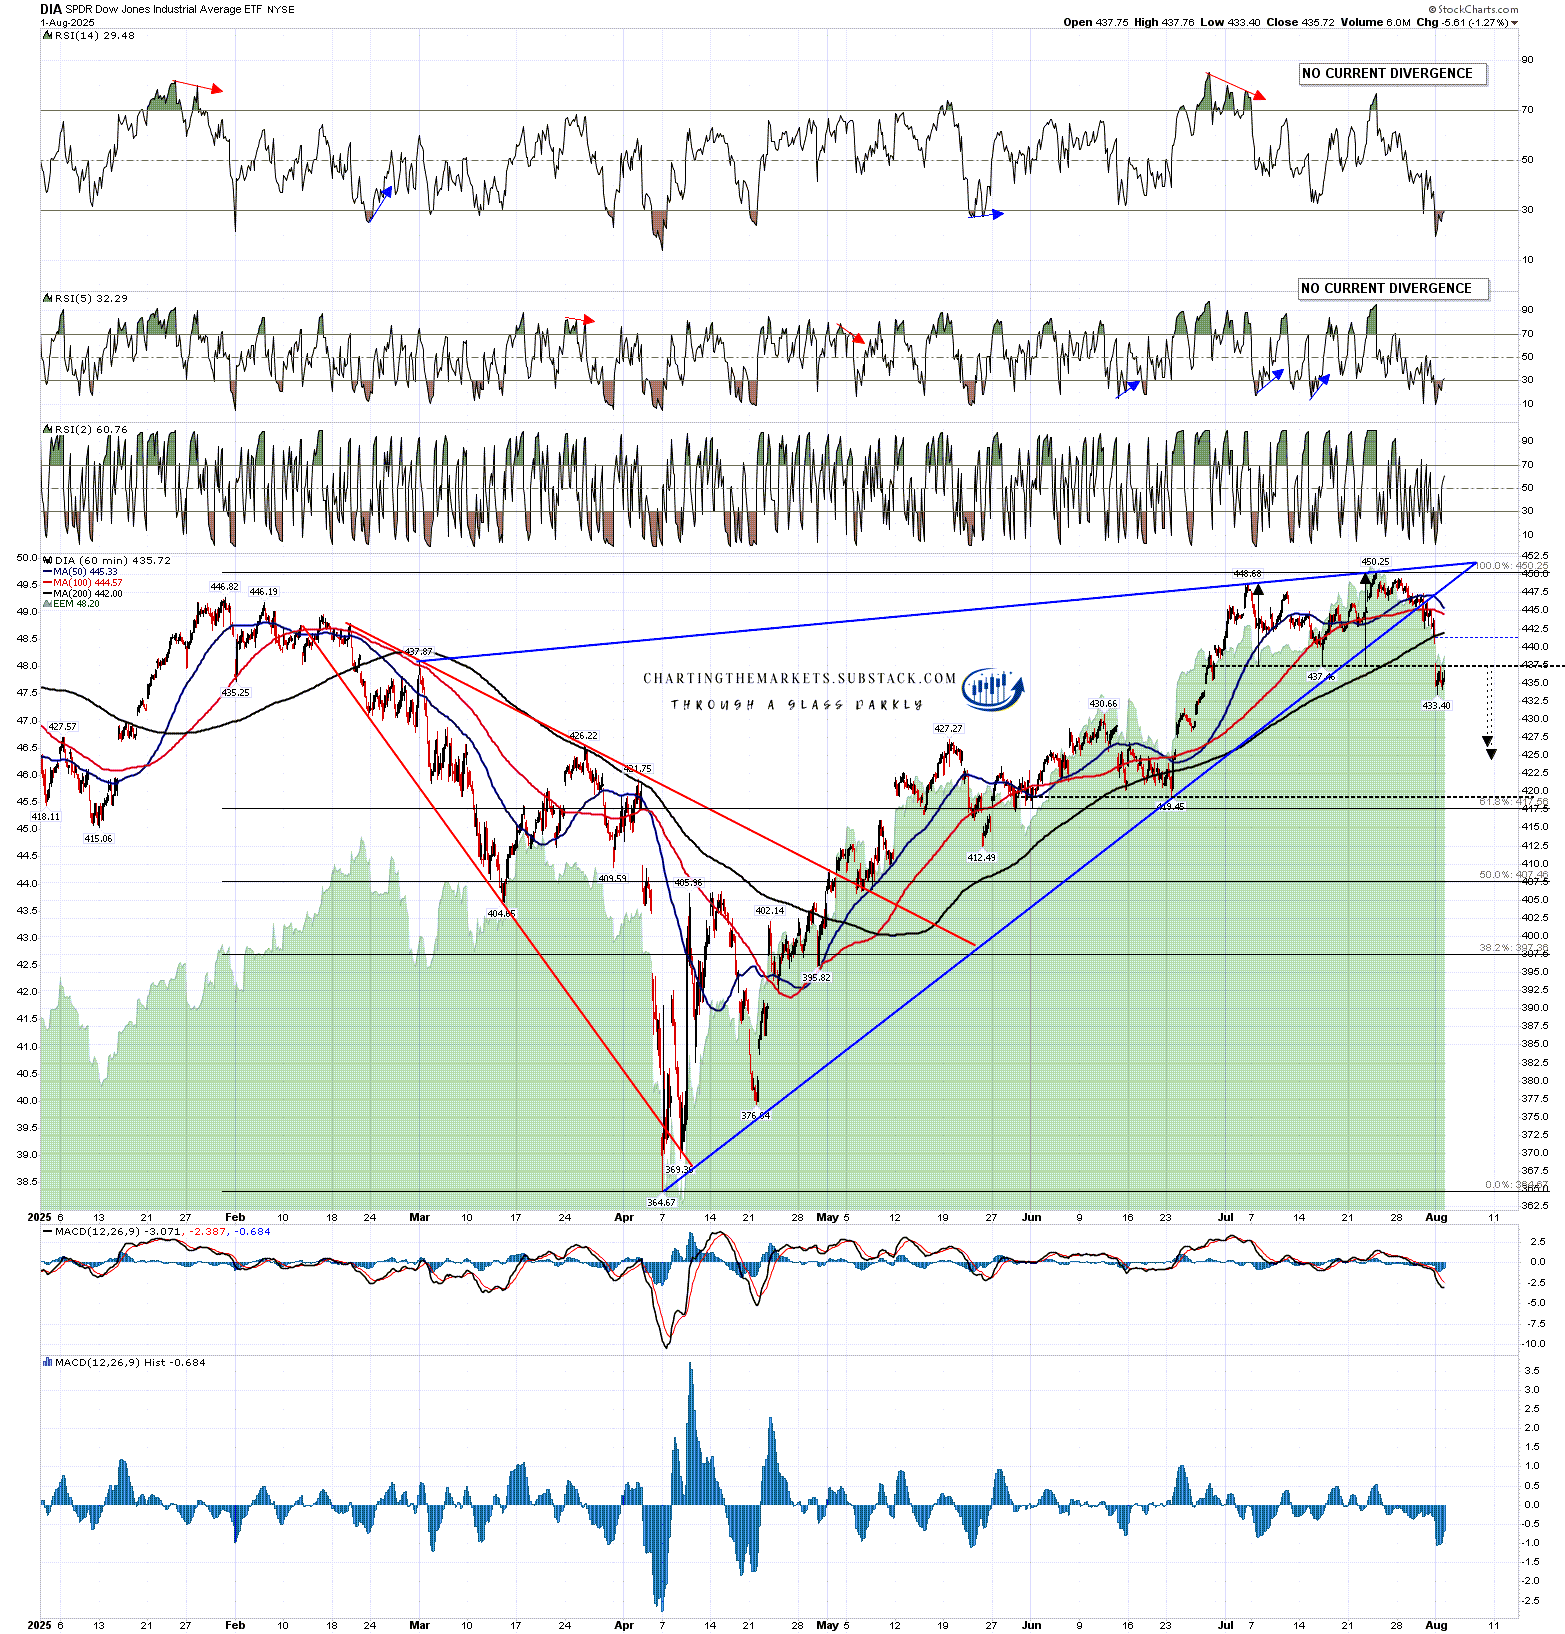
OK, on to the markets. On Friday morning I was looking at double top setups on both DIA and IWM and both of those broke down on Friday.
On Friday DIA broke down towards a target in the 424.5 to 426 area. There are obvious target levels a bit lower with larger possible H&S necklines in the 419.45 and 412.49 areas.
DIA 60min chart:
On Friday IWM broke down from the double top there towards a target in the 207 area, just above the possible larger IHS neckline in the 206.81 area. There is a second lower possible IHS neckline in the 199.10 area which is an almost perfect match with a 50% retracement of the move up from the April low.
IWM 60min chart:
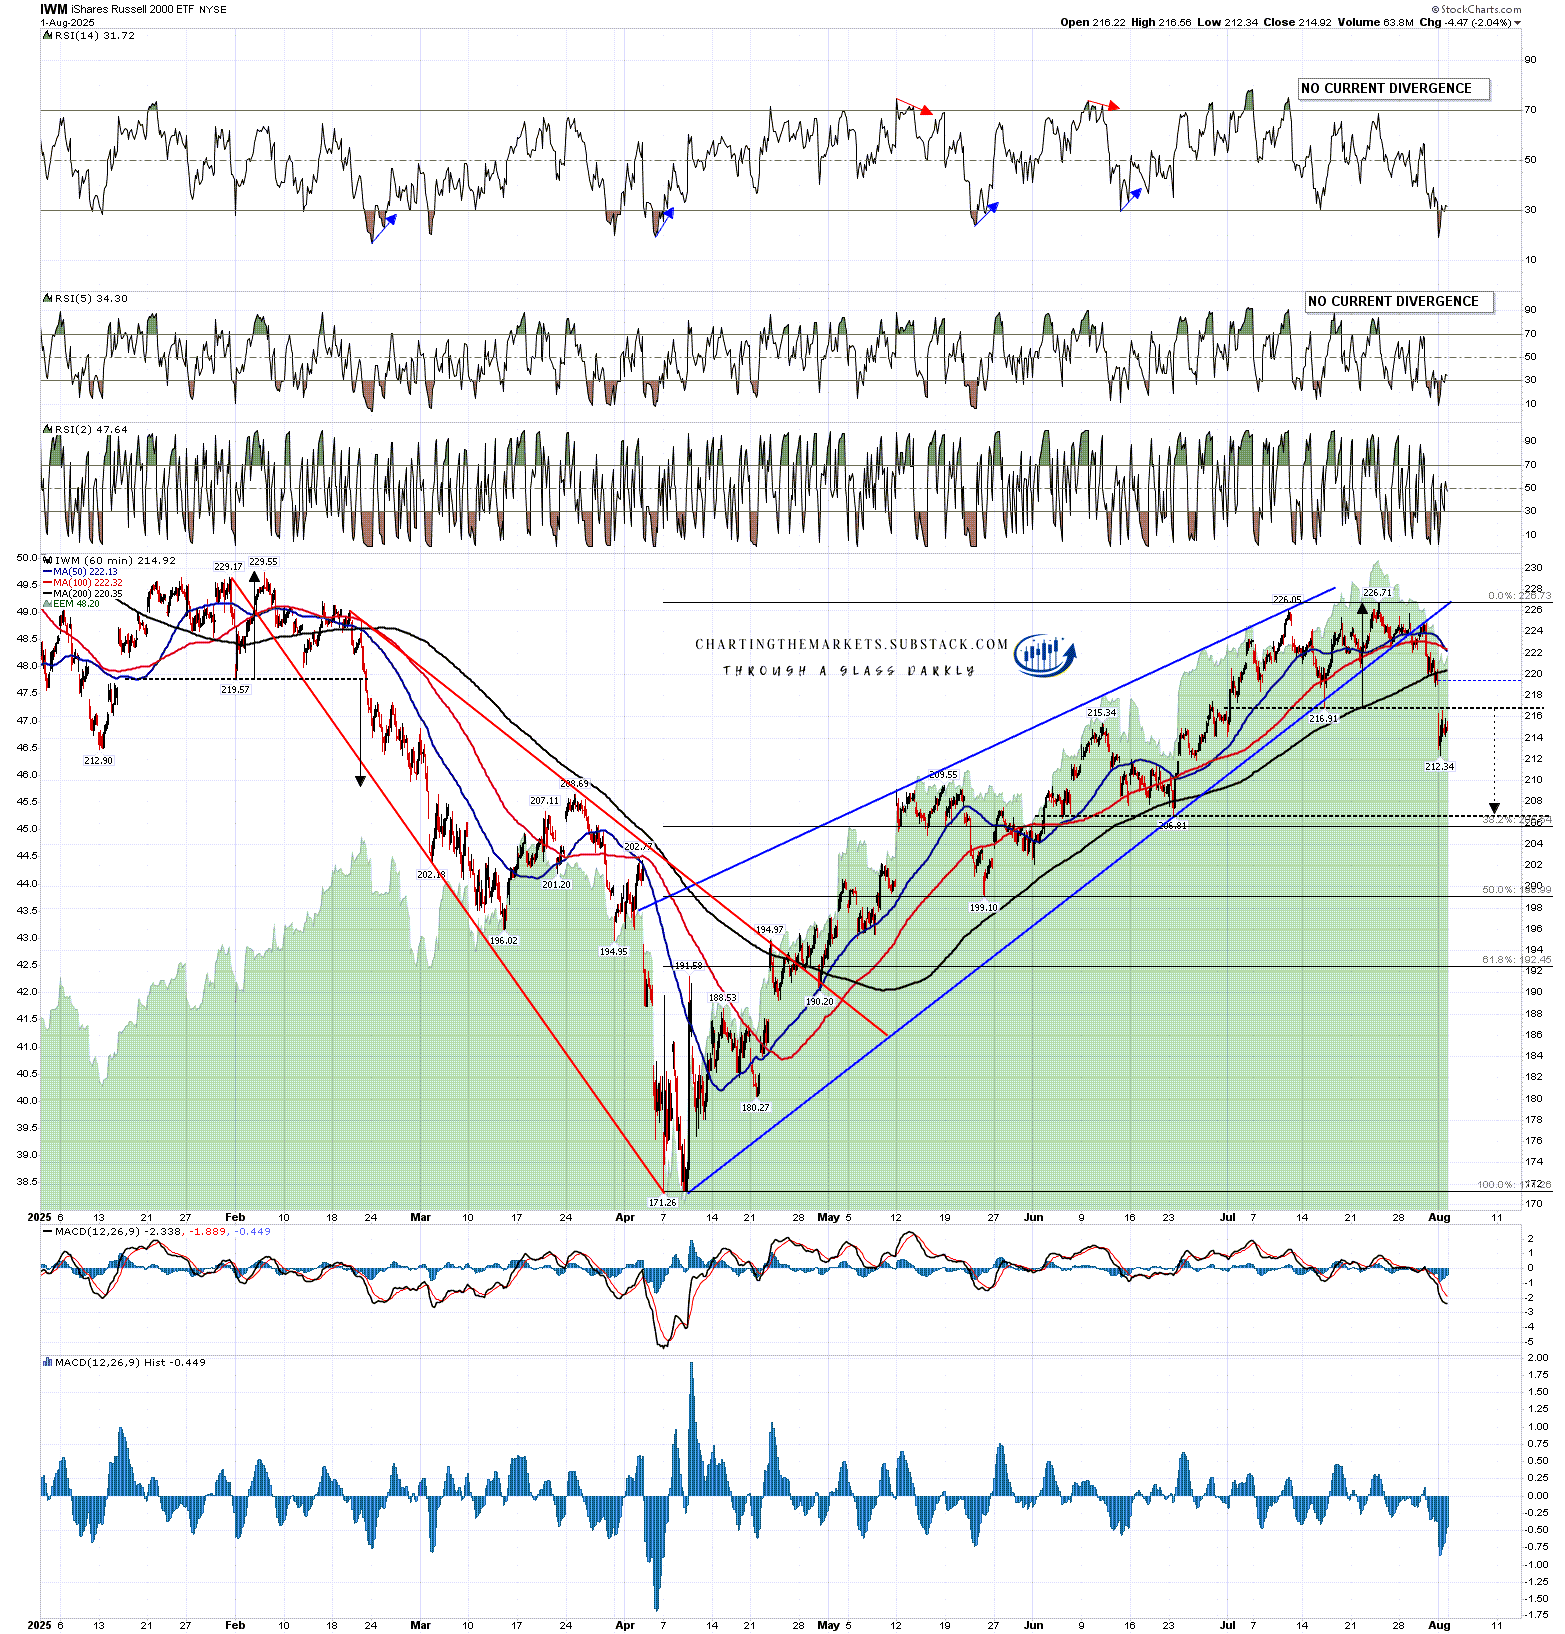
Because of the strength of the move on Friday there is another question here though. That move was strong enough that both DIA and IWM closed significantly below the daily 3sd lower band, which is an unusual event.
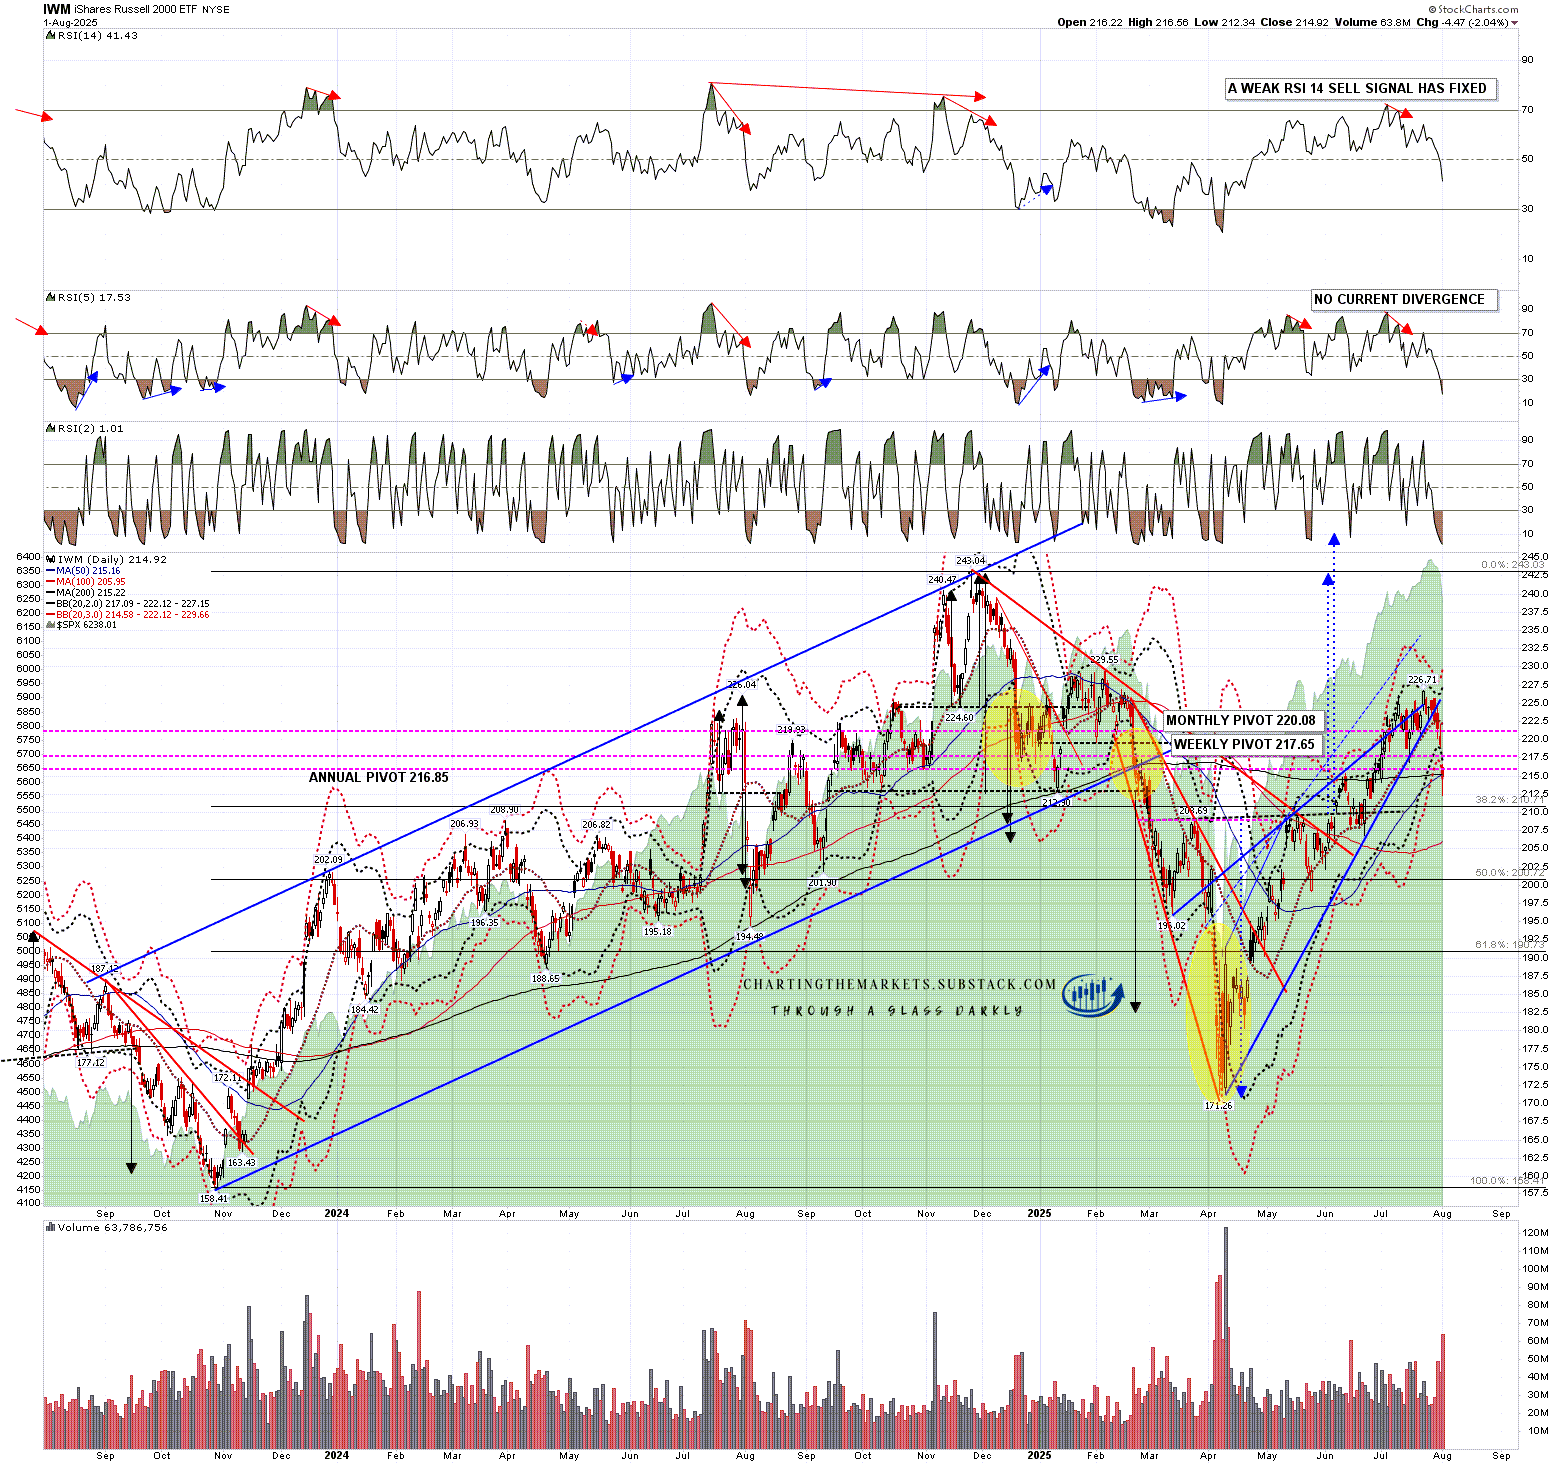
I was reading in the comments on Friday at slopeofhope.com that this generally signifies a hard break (for sure) and immediate continuation downwards, but the history is more nuanced than that. On the IWM daily chart below I show the three times that we have seen a hard break below the 3sd lower band in the last two years, and those were in December last year and in February and April this year.
What I saw when I was looking at these three instances on IWM was that in the first case there was a rally started very close to that day’s low that lasted over two weeks before going lower. In the second instance there was a rally that started the following day close to that day’s low that lasted two days before going lower. In the third instance there was a major low two days later and considerably lower.
There is a theme here that in all three cases markets went lower, but on the two that didn’t happen after an already serious retracement, there was a rally that started close to the low made on that first close below the 3sd lower band. That fits with what I’d generally be looking for.
IWM daily chart:
That being the case, though obviously these three instances fall significantly short of being a statistical universe, I am wondering whether we might see a rally early in the coming week, and I have a decent looking setup for that on both SPX and QQQ. After that rally, as long as the daily middle bands on both aren’t converted back to support, I’d be looking for those double top targets on DIA and IWM to be hit.
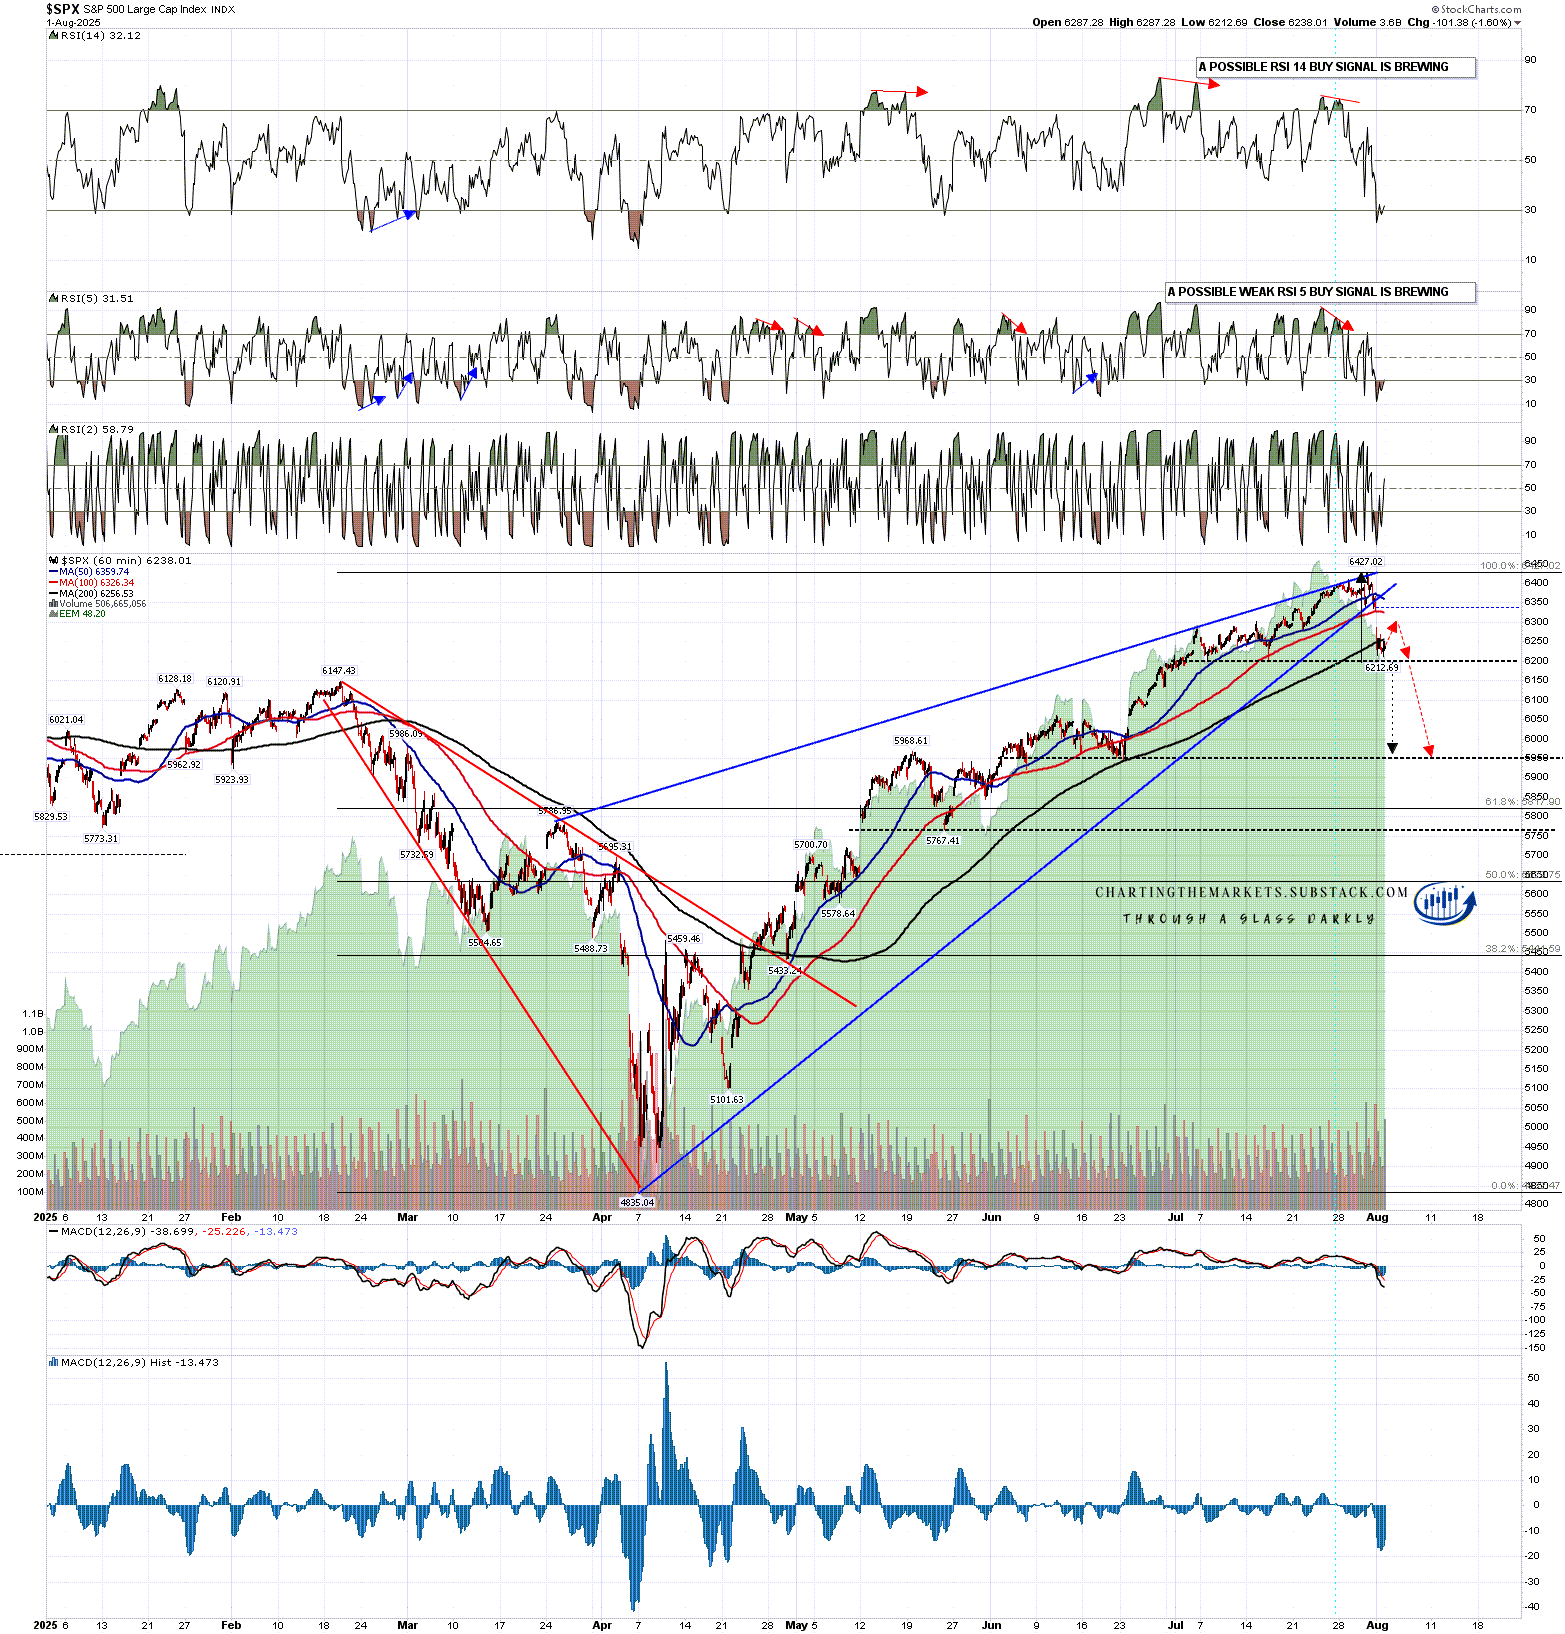
On SPX there was a little double top that reached target on Friday that is too small to mark up on the chart below, but the move down reached the first possible neckline that I had marked on the chart. Possible hourly RSI 14 and RSI 5 buy signals are brewing but not yet fixed.
If we were to see a rally on Monday to make a right shoulder on this currently theoretical H&S pattern then the ideal right shoulder high would be in the 6300 area, with the key resistance and attractive backtest target being at the daily middle band, which closed on Friday at 6302.81.
This would be a very elegant setup for an H&S that on a sustained break back below the H&S neckline would look for a target at the next possible H&S neckline marked on the chart below in the 5767.41 area.
SPX 60min chart:
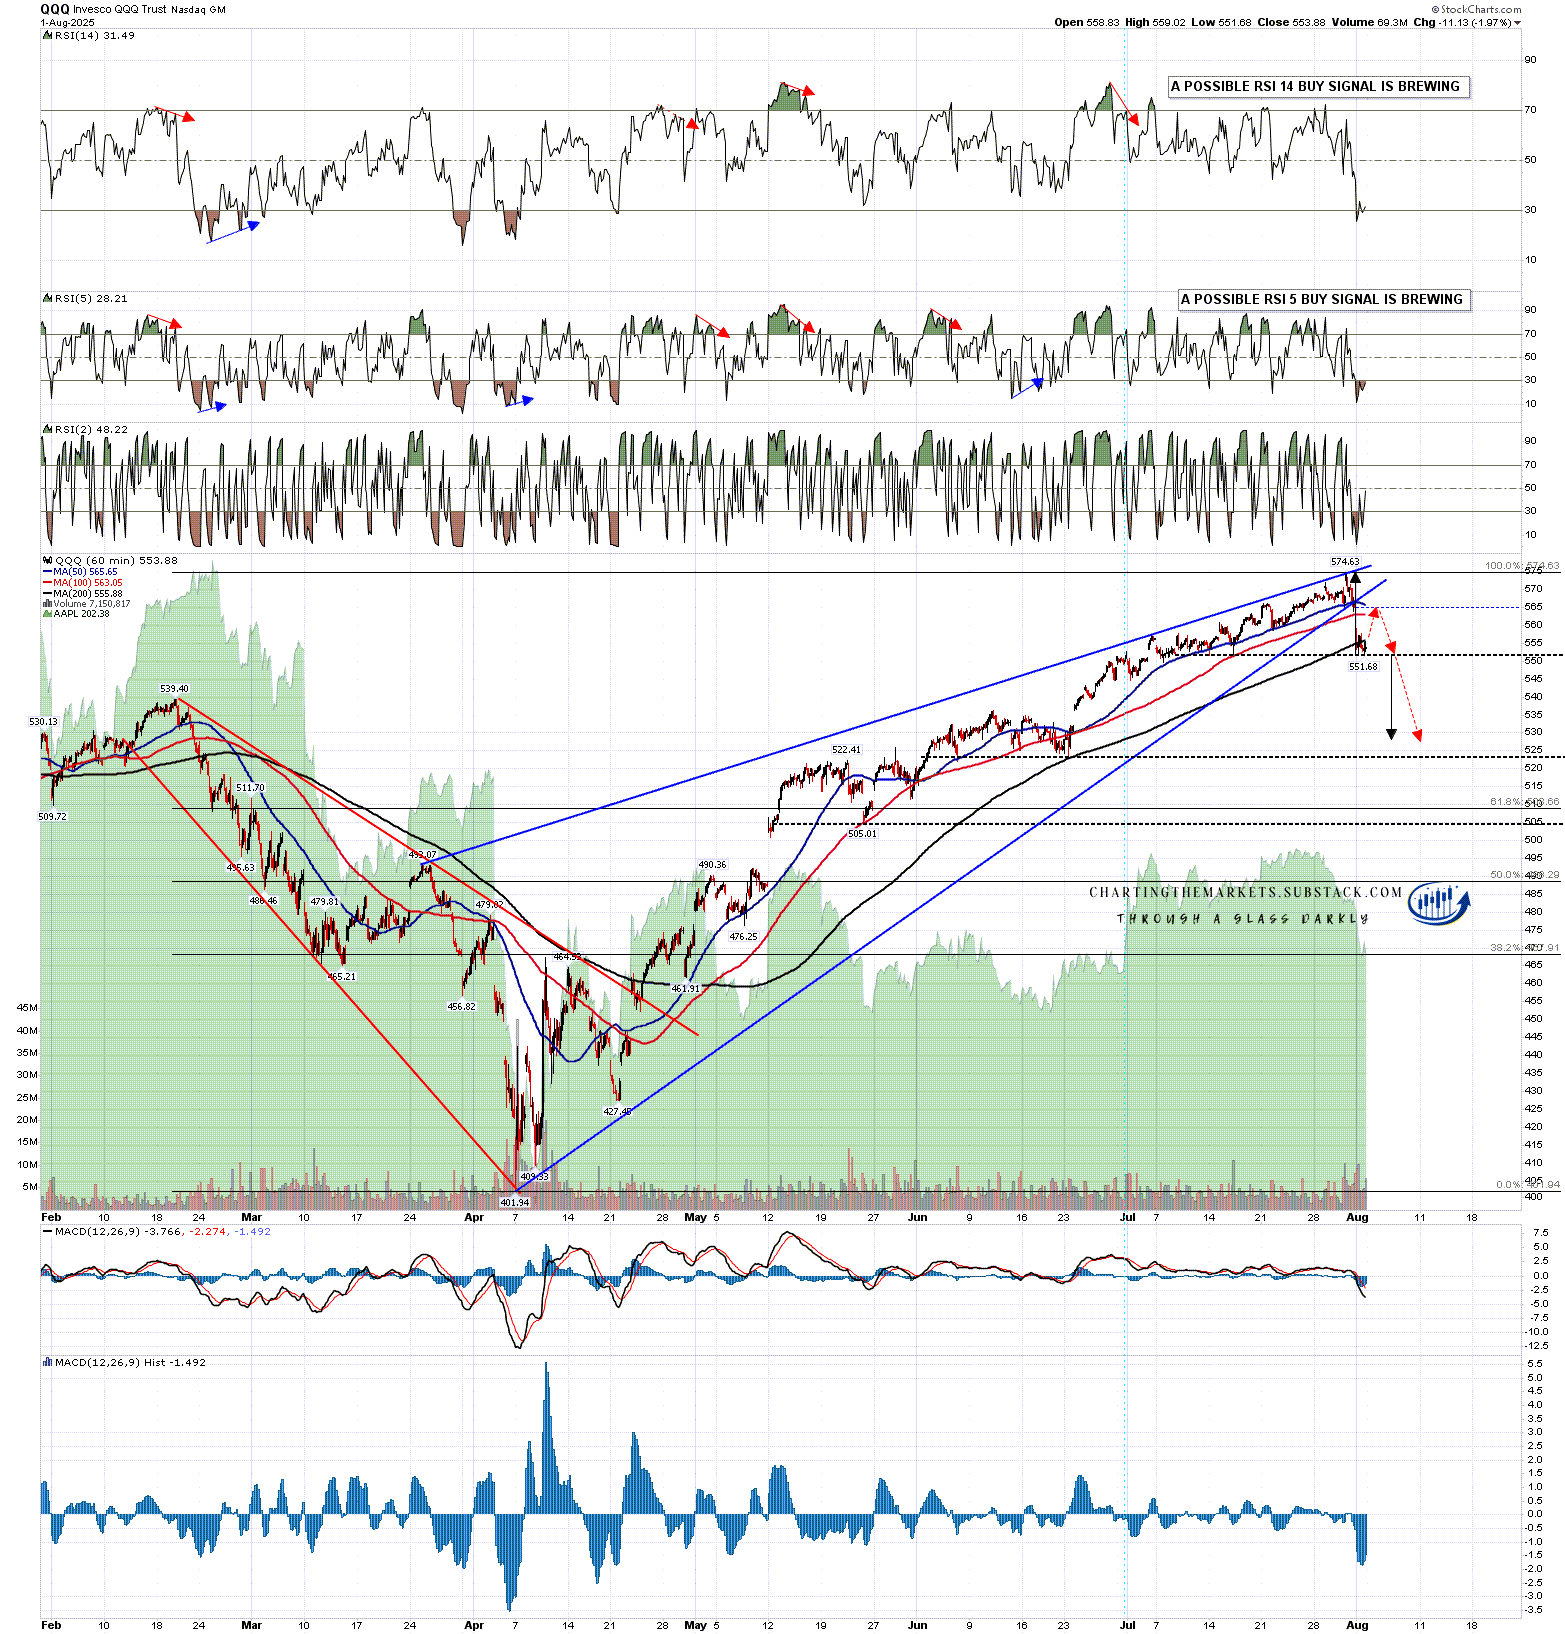
On QQQ the move down on Friday also reached the first possible neckline that I had marked on the chart. Possible hourly RSI 14 and RSI 5 buy signals are brewing but not yet fixed.
If we were to see a rally on Monday to make a right shoulder on this currently theoretical H&S pattern then the ideal right shoulder high would be in the 567 area, with the key resistance and attractive backtest target being at the daily middle band, which closed on Friday at 560.32.
This again would be a very elegant setup for an H&S that on a sustained break back below the H&S neckline would look for a target in the 527.5 area, not far above the next possible H&S neckline marked on the chart below in the 524 area.
QQQ 60min chart:
I think equity indices are in the early stages of a significant retracement here that will ideally retrace around 50% of the move up from the April lows before at least retesting the current highs.
I’m not looking for a more serious high to form yet though we could see that, as I suspect that the rest of the economic numbers this year will likely be at best mediocre. There is one thing that may really boost markets in two or three months and that is the court case about the legality of Trump’s tariffs. That was being reviewed by the Appeals Court late last week and seems likely to be ruled illegal by them when they make their judgement but, at that stage, the case will likely go to the Supreme Court.
If the Supreme Court backs the lower and Appeals courts, and rules that the tariffs are illegal, that could deliver a strong rally into the end of the year.
If you like my analysis and would like to see more, please take a free subscription at my chartingthemarkets substack, where I publish these posts first. I also do a premarket video every day on equity indices, bonds, currencies, energies, precious commodities and other commodities at 8.45am EST, but only for paying subscribers. Other places to find me are my twitter, and my Youtube channel.
No comments:
Post a Comment