
In my post on Tuesday 5th August I was looking at the modest breaks back over the daily middle bands on SPX and QQQ on the previous day and noting that conversion of those to support would open possible all time high retests, and hard fails there would strongly support the H&S patterns forming on both.
In my post on Thursday 7th August I was saying the same about the second breaks on SPX and QQQ above those daily middle bands on Wednesday and looking at the three strong resistance trendlines on SPX, QQQ and DIA in the event that SPX and QQQ delivered those all time high retests.
In my last post yesterday I was updating the situation with the trendline resistance levels on US indices and noting a short term inflection point as we waited to see whether DIA would confirm the break back over the daily middle band on Tuesday. That has now resolved into a strong break higher on DIA.
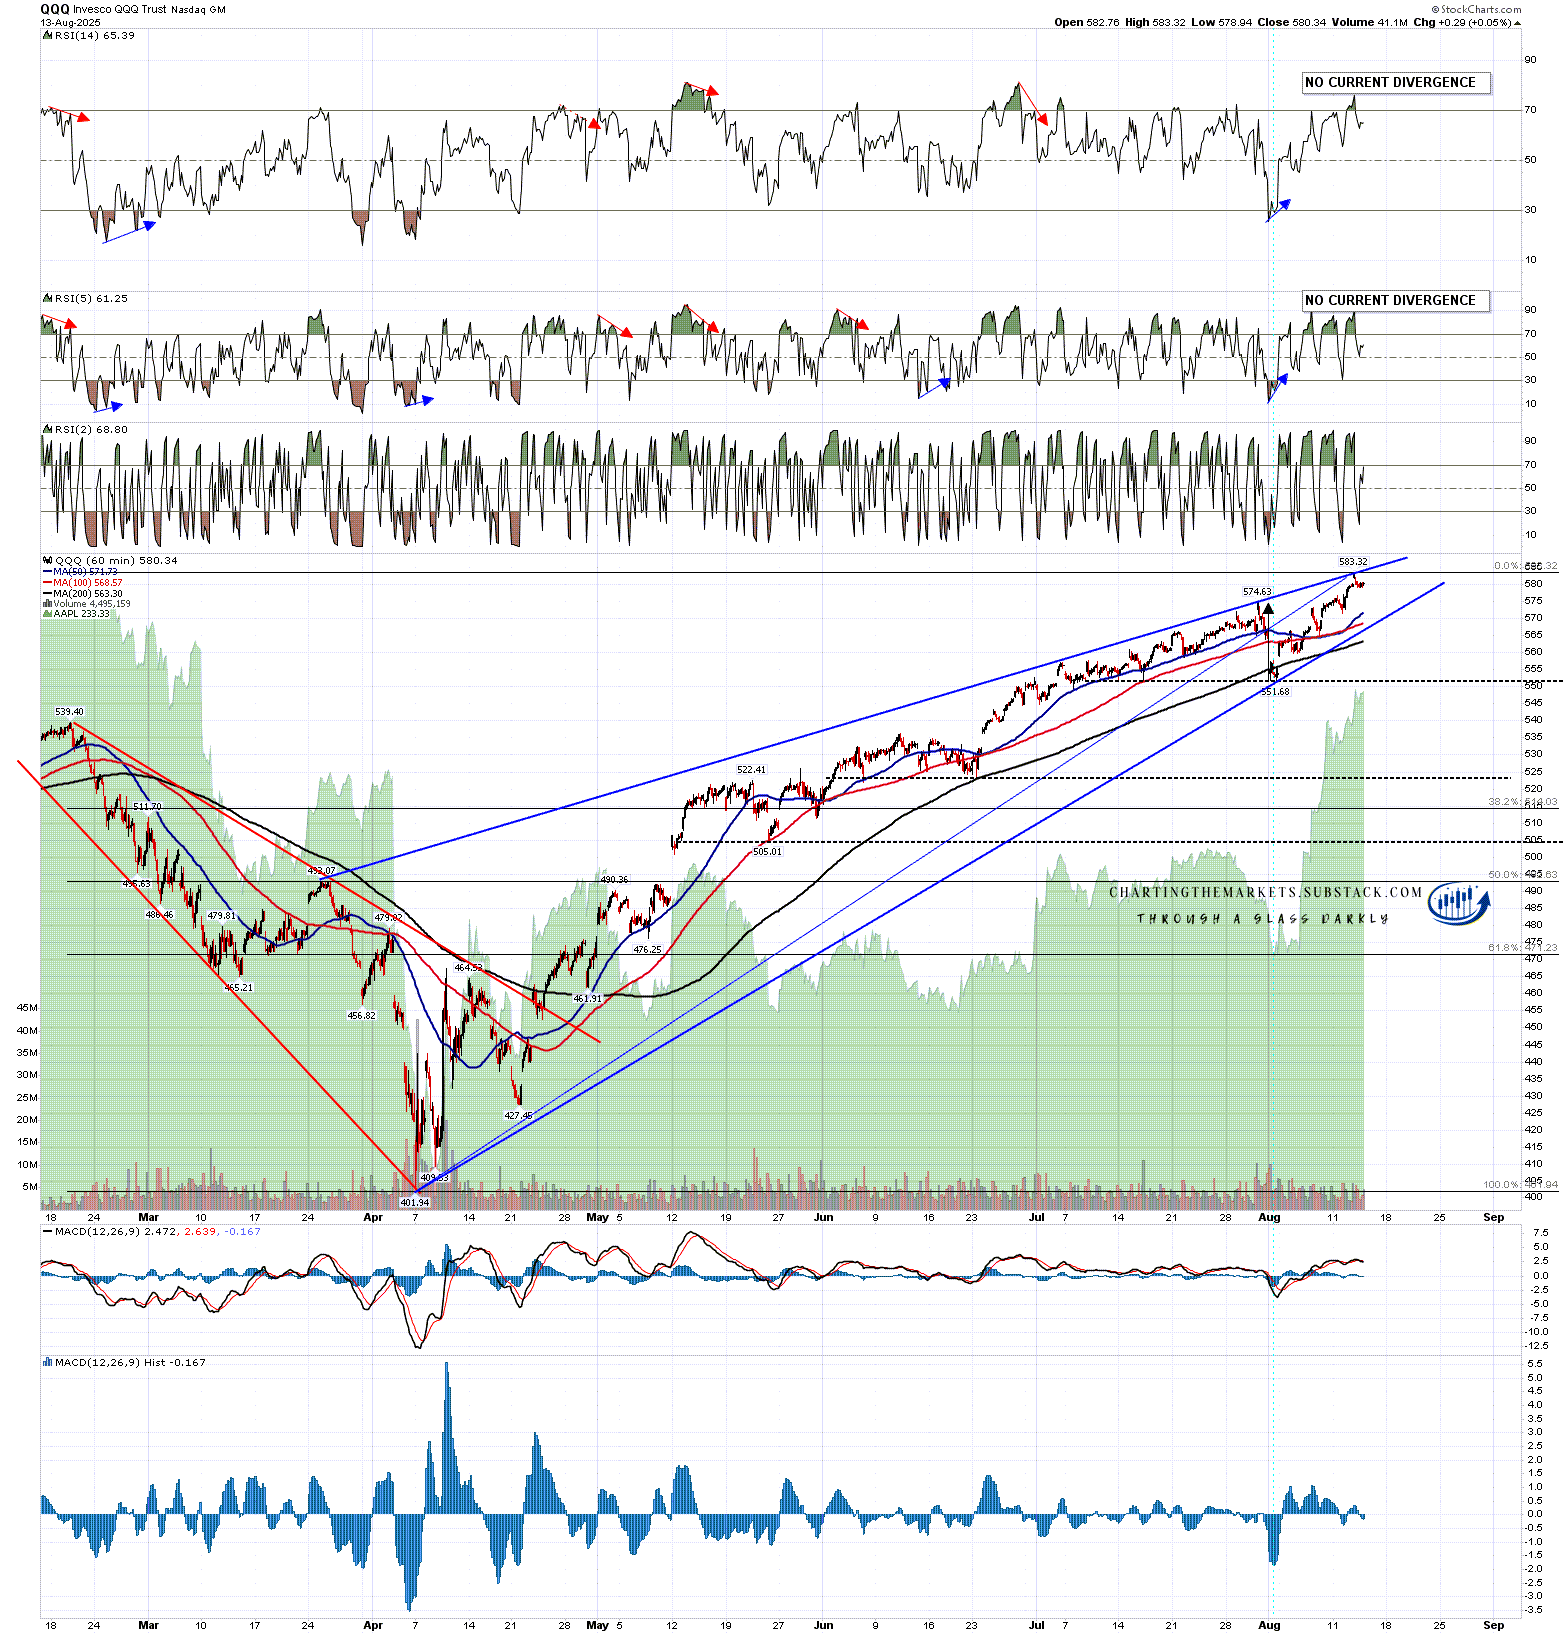
Since yesterday morning two of my (now four including IWM) resistance trendlines have now been hit. The first of those is on QQQ where there was a perfect hit of the trendline at yesterday’s high. This confirms the expansion of the original rising wedge and the trendline starting at the April low and running through the early August low is now wedge support.
If we are going to see a high form here for either a retracement or a hard reversal then that resistance trendline may well break in a bearish overthrow and I think that would likely happen here. I’d be looking for negative divergence to form on the RSI 14.
QQQ 60min chart:
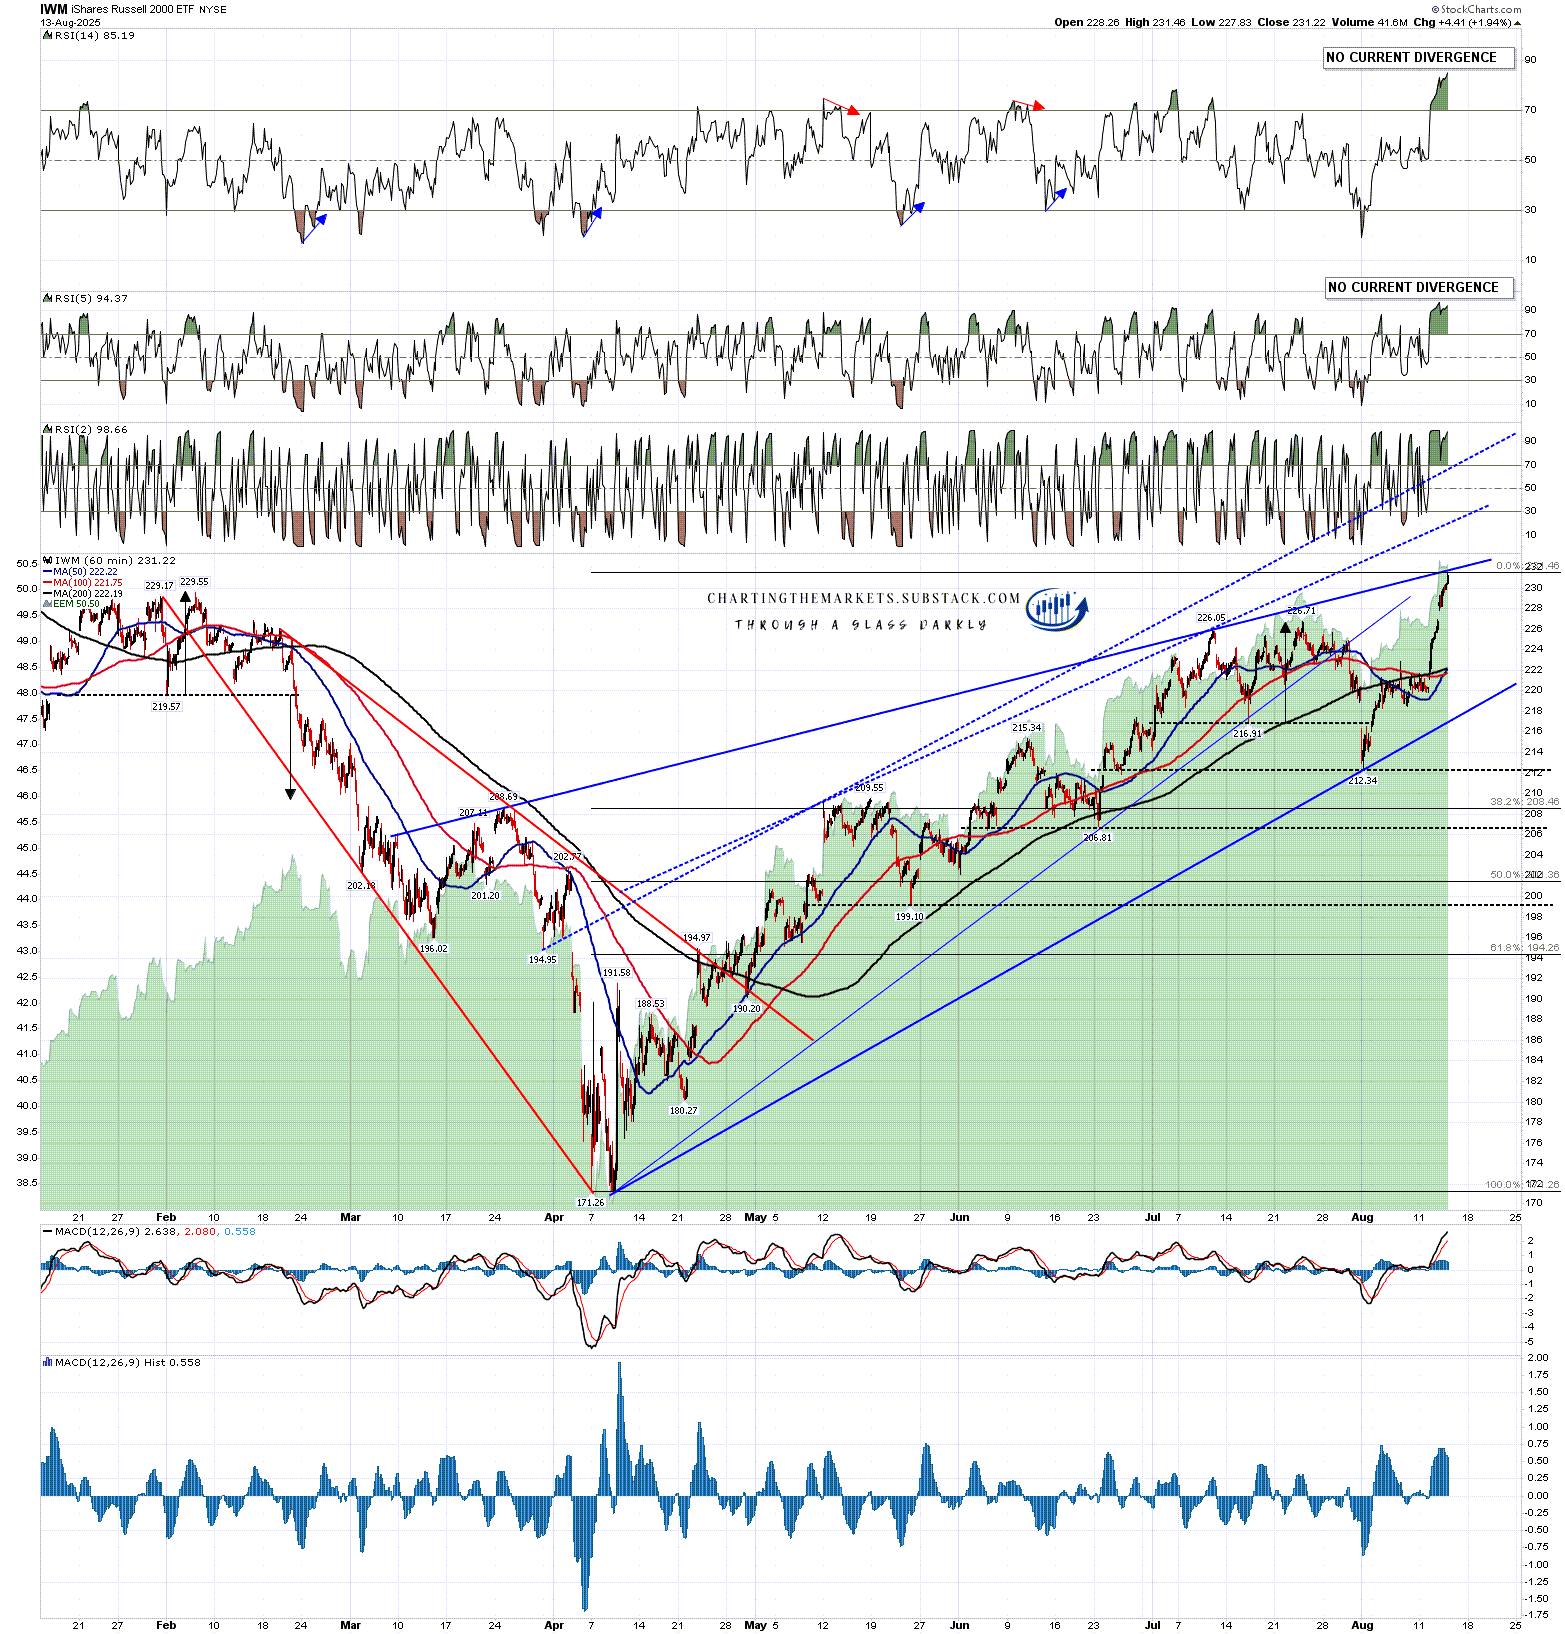
The second of those is on IWM, on a major tear the last two days, and where there was a perfect hit of the trendline at yesterday’s high. This confirms the expansion of the original rising wedge and the trendline starting at the April low and running through the early August low is now wedge support.
If we are going to see a high form here for either a retracement or a hard reversal then that resistance trendline may well break in a bearish overthrow and I think that would likely happen here. I’d be looking for negative divergence to form on the RSI 14.
IWM 60min chart:
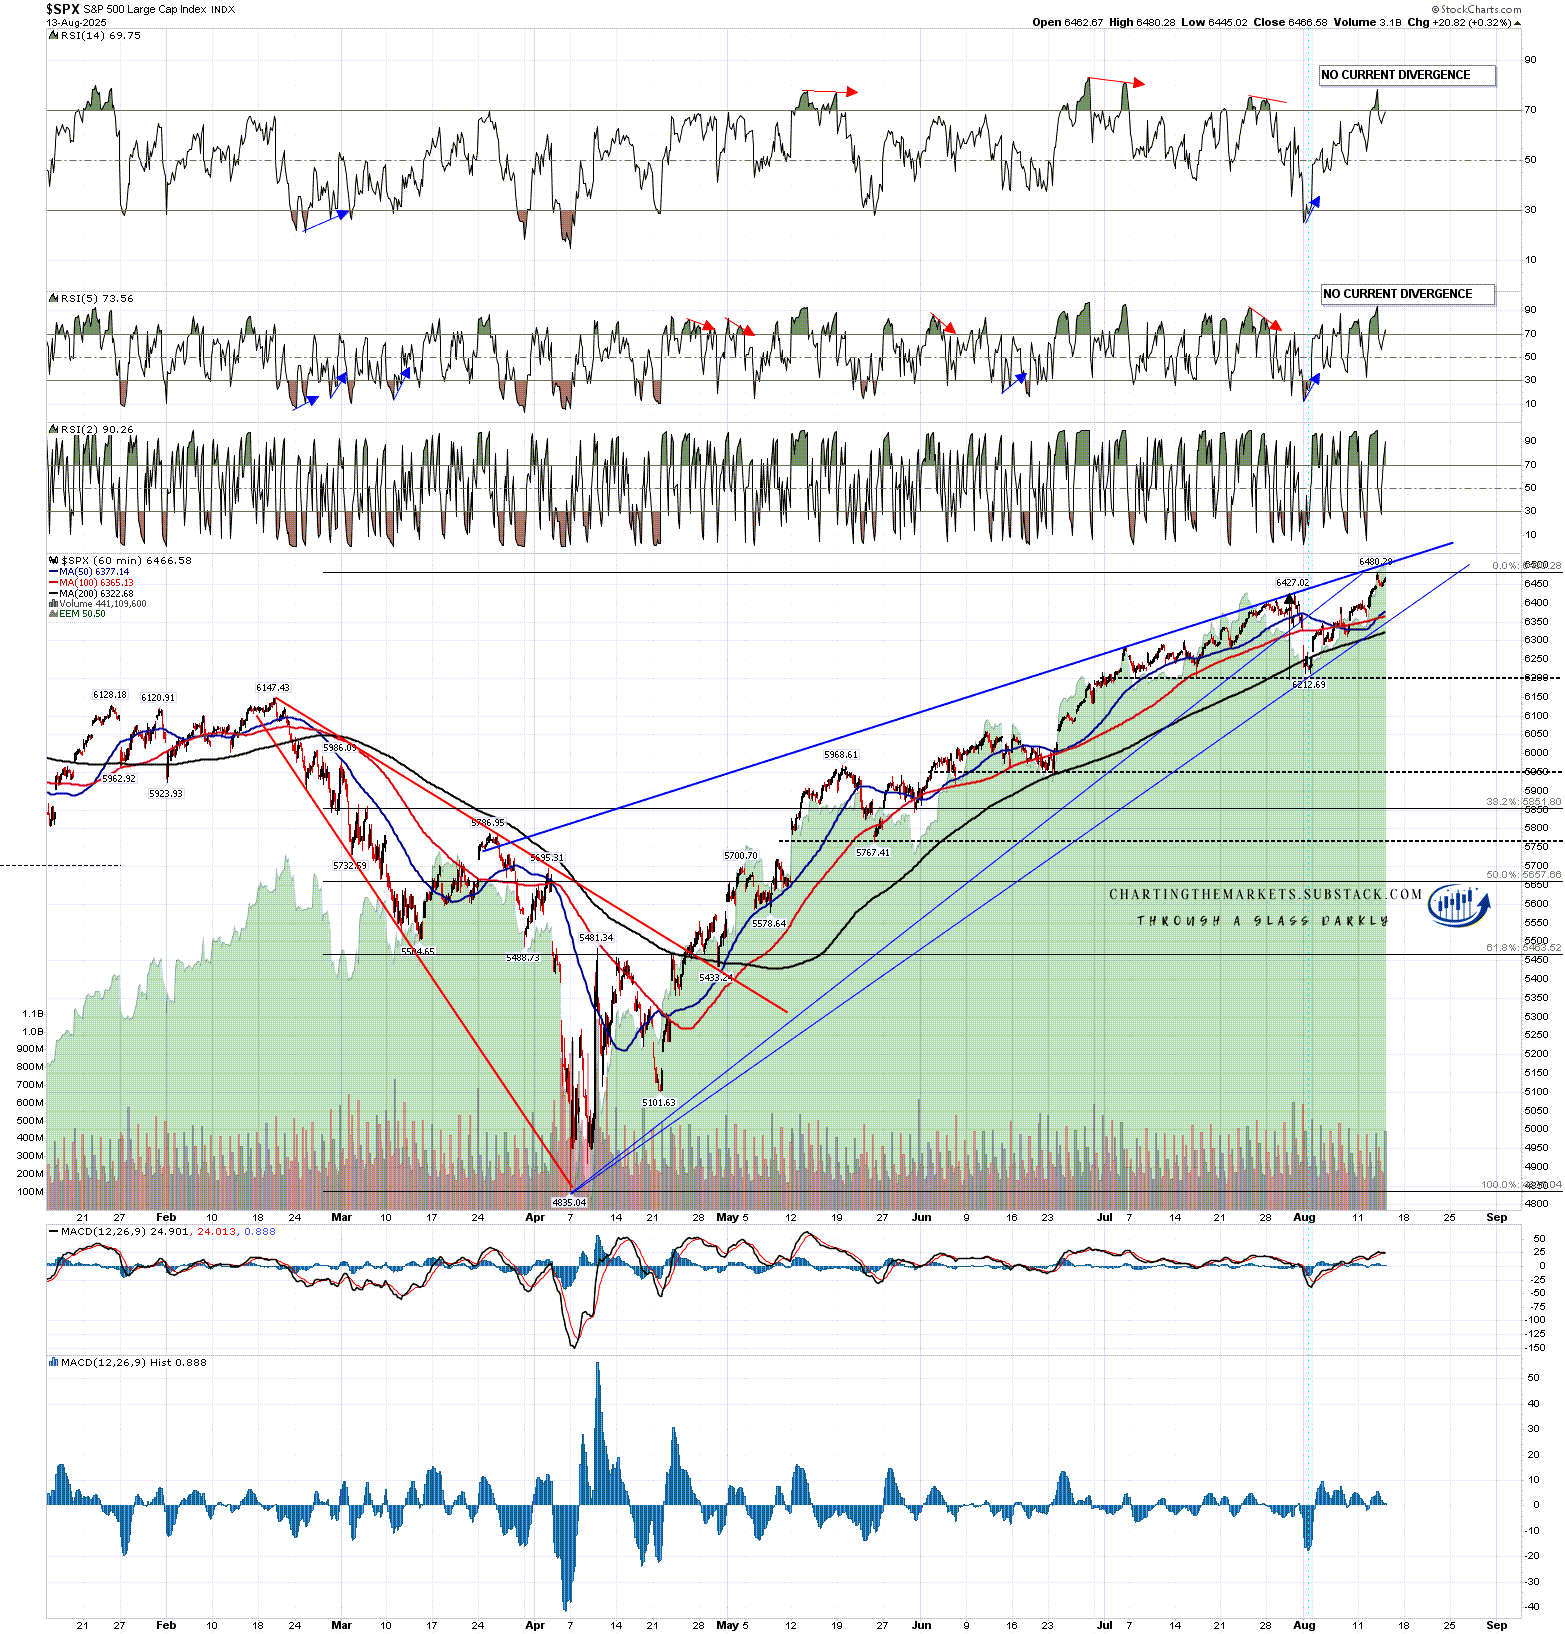
SPX hasn’t quite made it to the resistance trendline yet but that is now in the 6500-5 area and there are decent odds that will be hit in coming days. A retest of yesterday’s high would set possible hourly RSI 14 and RSI 5 sell signals brewing.
SPX 60min chart:
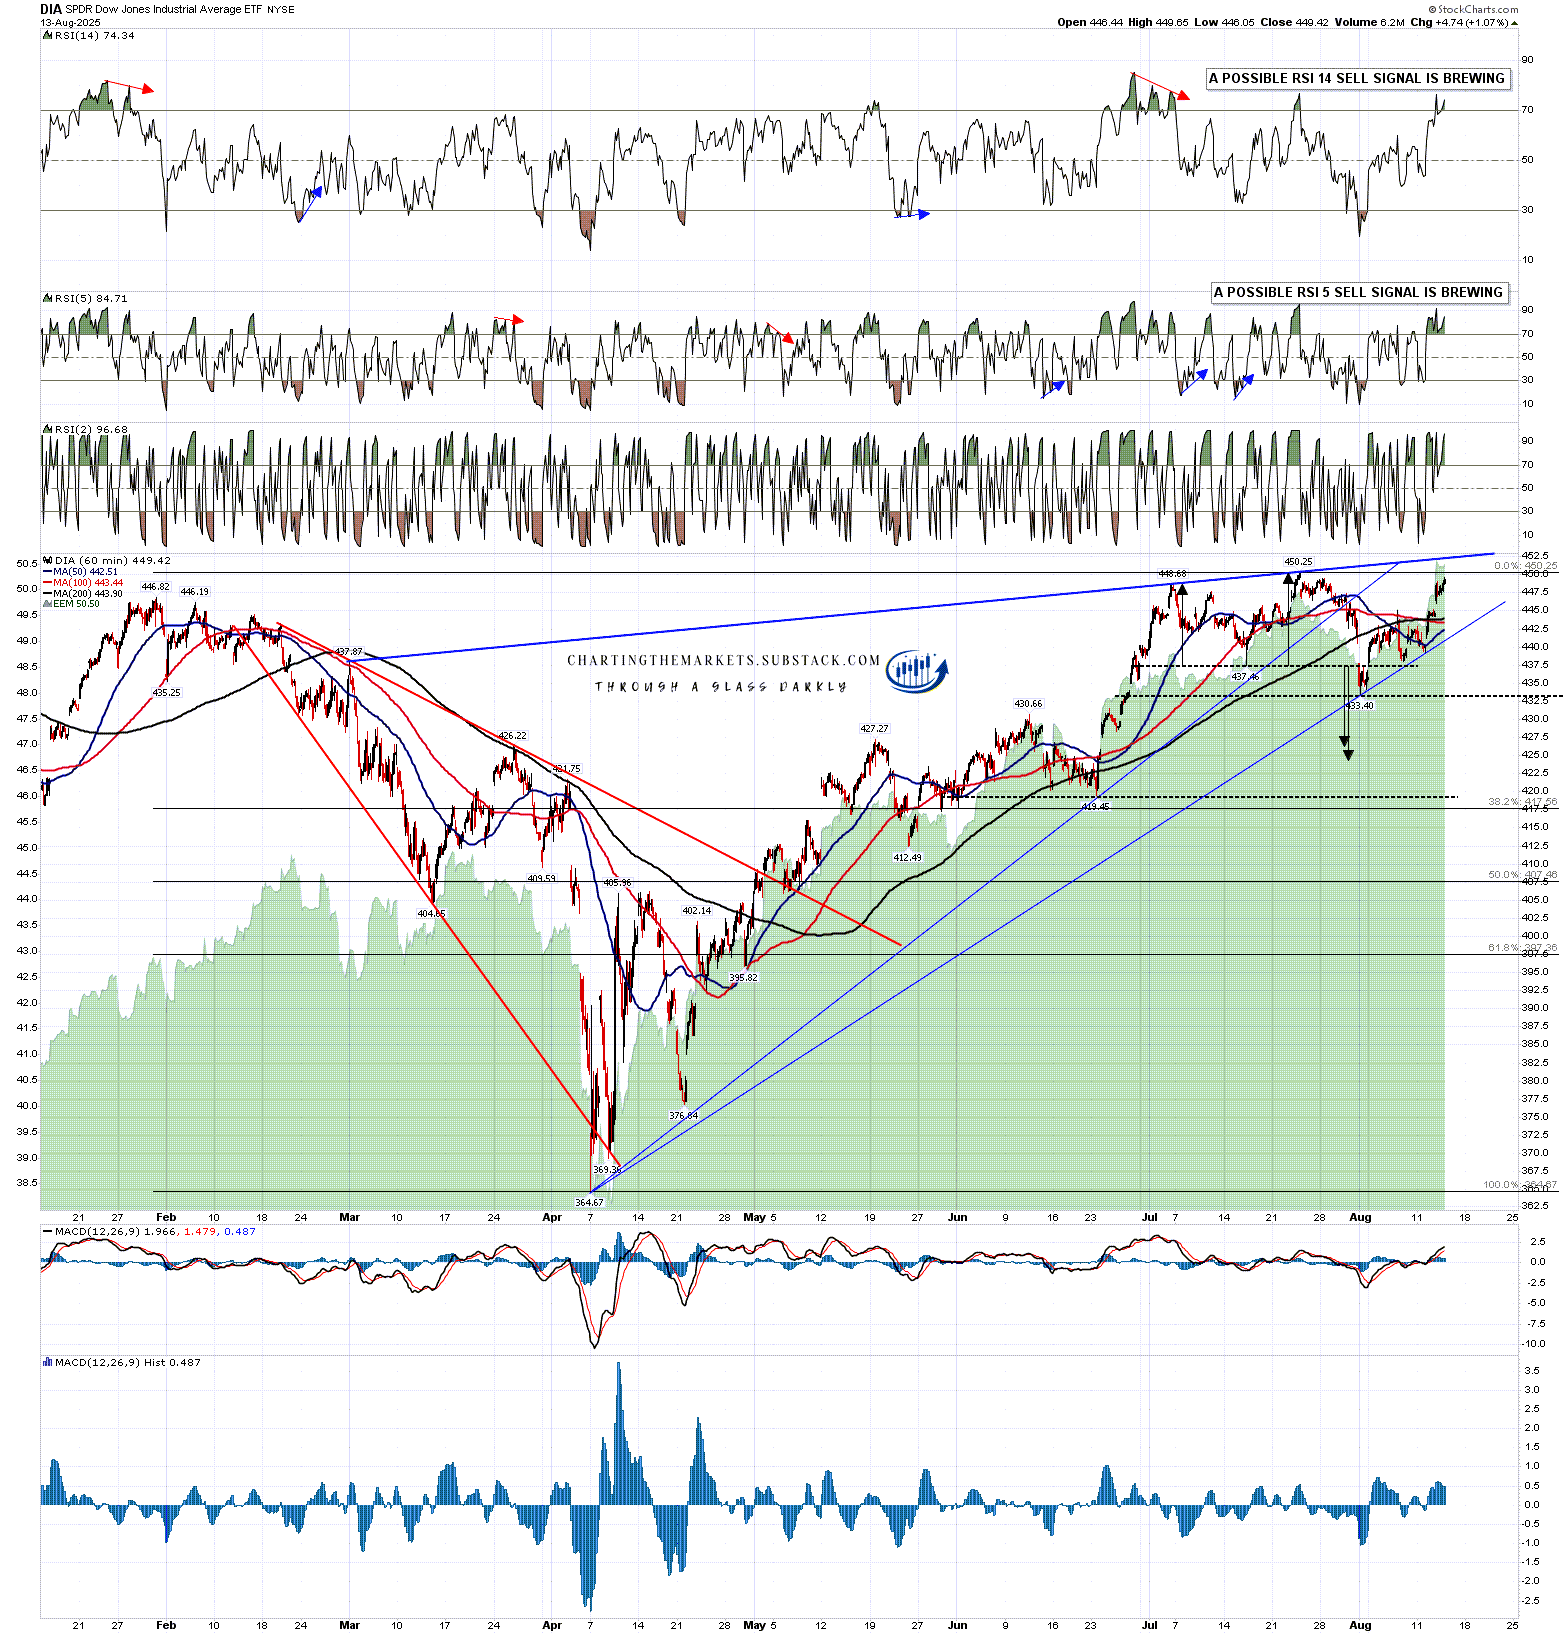
DIA had a very strong day yesterday and is now also in range of hitting the resistance trendline there. That is now in the 452 area and I’m expecting to see at least a retest of the July all time high at 450.25 in coming days. Possible hourly RSI 14 and RSI 5 sell signals are already brewing.
DIA 60min chart:
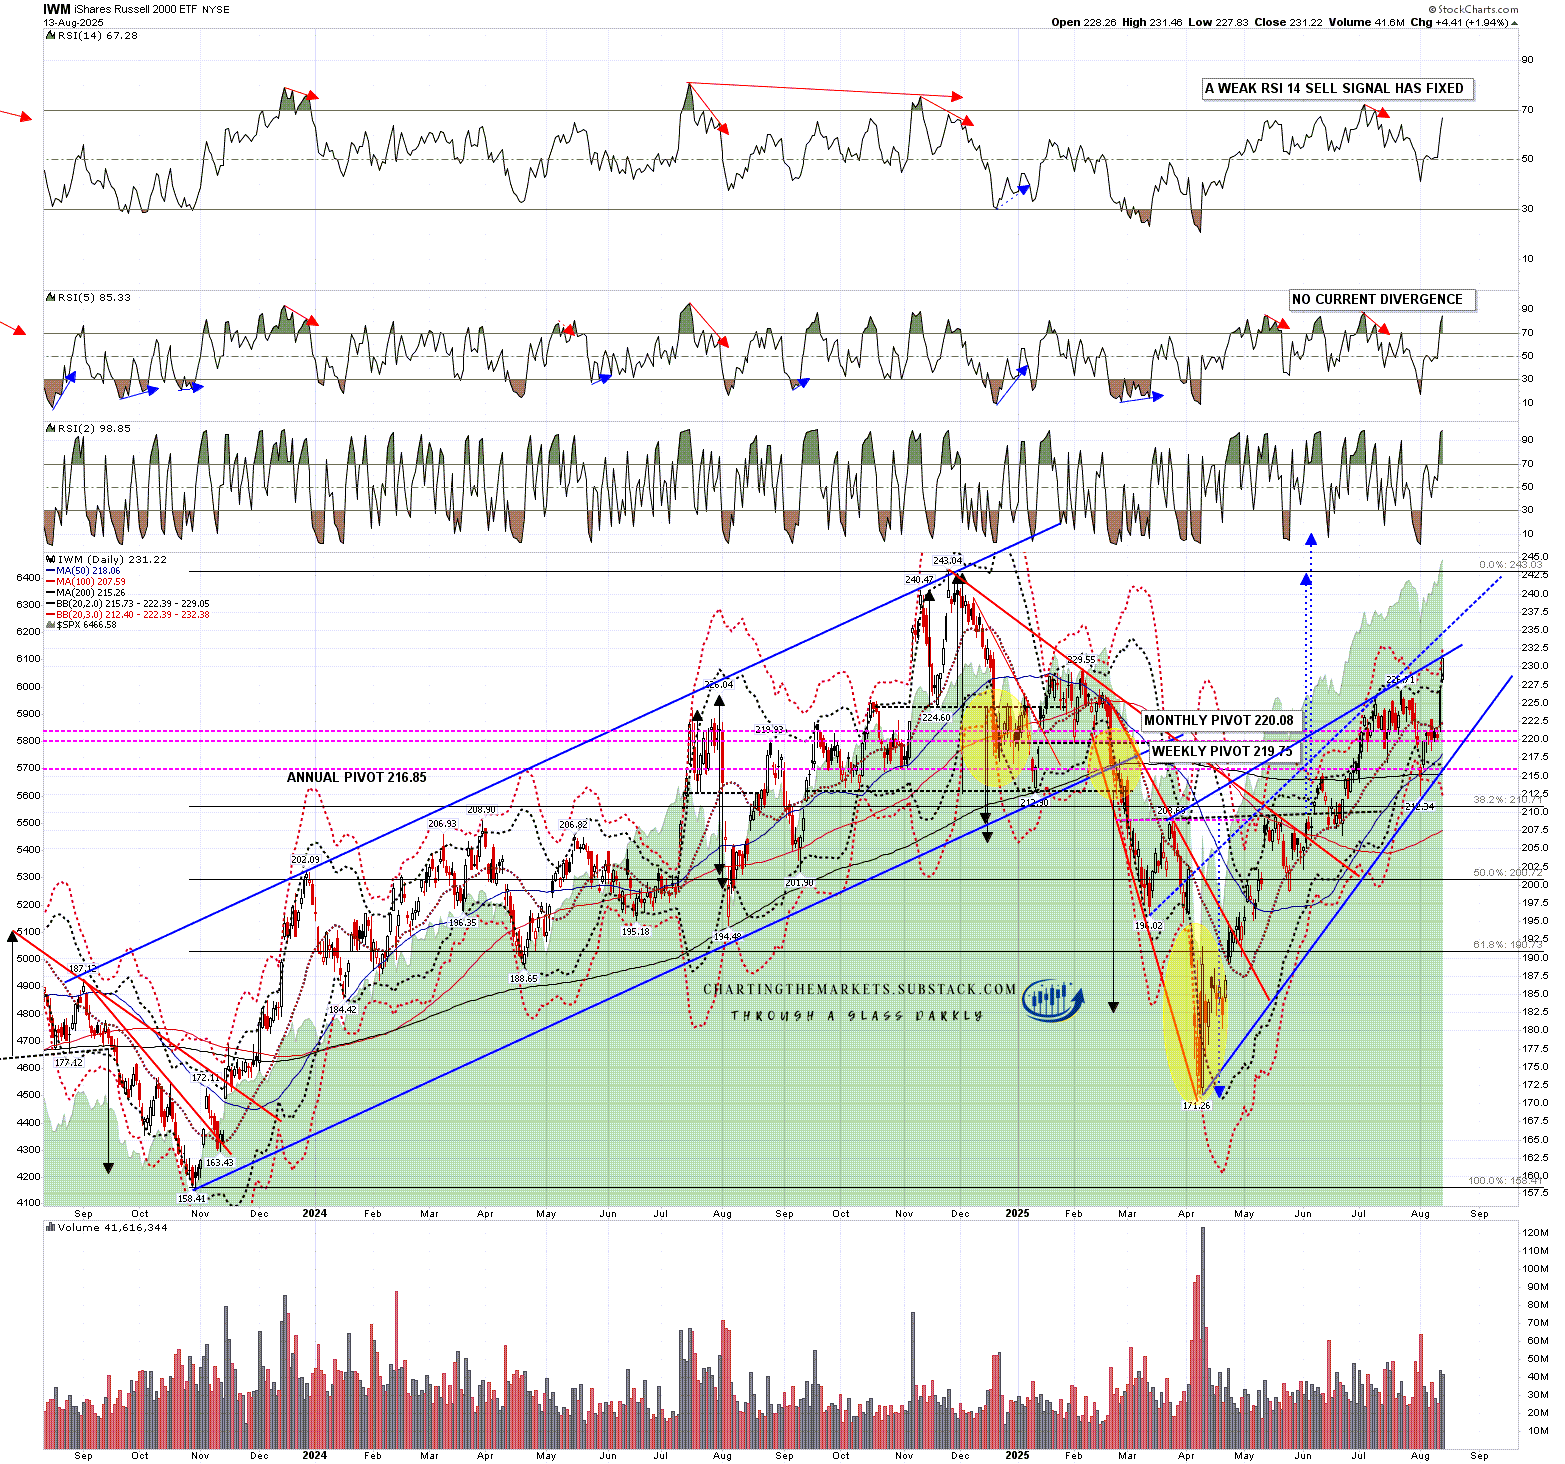
The last chart today is the IWM daily chart, which is currently interesting for two reasons. I posted this chart in my post on Sunday 3rd August proposing a rally from the Friday 1st August low after the bad jobs numbers. The point I was making was that the close below the daily 3sd lower band seen at that close historically suggested an imminent rally.
The point I’d make today is that IWM touched the 3sd upper band yesterday and that touch is suggesting that at least a short term consolidation or retracement is close.
The second point I would make looking at this chart is that there is still an IHS on this chart that has broken up with a target at a retest of the Dec ‘24 all time high at 243.04, and that this target may be made in coming months if we see a retracement soon and then equity markets go higher.
IWM daily chart:
I’m still thinking that this IHS target may be reached, and I’ve been talking for months about the possibility of this market uptrend running through to the end of the year.
I’ve noted before that bad news takes a while to filter through into the economic numbers, and we’ve been seeing that. With an unqualified political hack now appointed to head the Bureau of Labor Statistics that process may now take even longer. Something to bear in mind.
If you like my analysis and would like to see more, please take a free subscription at my chartingthemarkets substack, where I publish these posts first. I also do a premarket video every day on equity indices, bonds, currencies, energies, precious commodities and other commodities at 8.45am EST, but only for paying subscribers. Other places to find me are my twitter, and my Youtube channel.
No comments:
Post a Comment